Fertility Rates in Low Birth-Rate Countries, 1996-2011
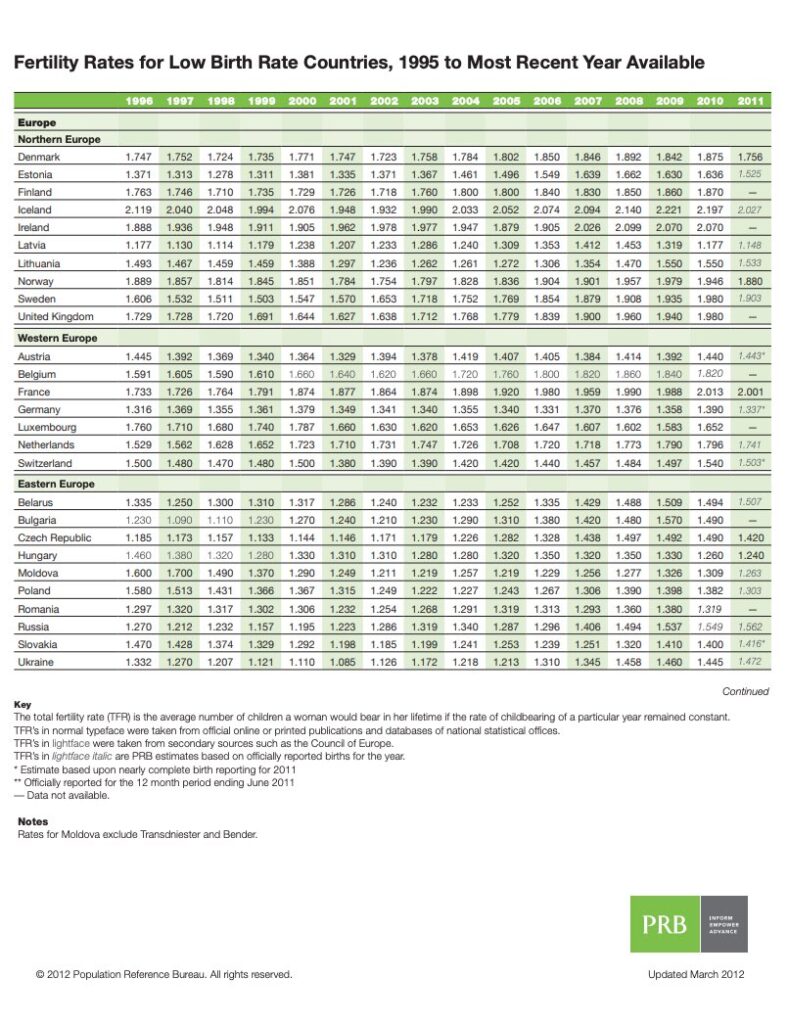
(March 2012) PRB has updated “Fertility Rates in Low Birth-Rate Countries, 1996 to Most Recent Year,” showing birth rate trends in low-fertility countries. A large number of TFRs for 2011 are now available, either reported officially by national statistical offices (in normal typeface) or estimated by PRB from reported births (lightface italic).
Government concern over chronically low birth rates has grown dramatically over time. The number of media stories covering the issue continues to grow. But in many respects, it is too little, too late. In Germany, for example, the total fertility rate (the average number of children per woman, or TFR) fell below the “replacement level” of 2.1 children per woman in 1970—over 40 years ago—then dipped as low as 1.2 and has been fairly steady at about 1.35 in recent years. While some would see slower population growth as a good thing, especially for the environment, the government is very concerned about the disproportional aging such very low birth rates cause. Currently, over 20 percent of Germany’s population is in the age group 65 and over, a share projected to rise to 35 percent or more in the next 40 years. Germany is far from alone. Official Japanese projections show the same proportion passing 40 percent by 2050. Lengthy periods of low fertility have an irreversible consequence. With greatly decreased numbers of young people, there will simply not be enough parents in the future to make a serious difference in a country’s demographic prospects even if there are some modest increases in birth rates. And the prospects for that now appear very dim. Although governments scramble to encourage childbearing, the demographic futures of their countries have been, for all practical purposes, already decided.
This update shows TFRs up to 2011 for most countries. Most 2011 figures have been released very recently. This year, likely 2011 TFRs have been estimated by PRB for the few countries that have released monthly birth statistics for most of 2011. These figures are indicated by an asterisk in the table. The ultimate TFR will differ, but the estimates show the likely direction of change projected by PRB based on birth data for less than a full year when such data are available.
Fertility Trends in Very Low-Fertility Countries Through 2011
| Risers | Modest Risers | No Significant Rise and/or Consistent Pattern | Declined in 2011 |
|---|---|---|---|
| Belarus | United Kingdom* | Ireland* | Denmark |
| Bulgaria* | Slovakia | Austria | Estonia |
| Russia | Italy | Belgium* | Iceland |
| Ukraine | Portugal | Malta | Latvia |
| China, Hong Kong SAR | Israel | Lithuania | |
| Japan | Norway | ||
| Singapore | Sweden | ||
| South Korea | France | ||
| Taiwan | Germany | ||
| Australia | Luxembourg* | ||
| Canada | Netherlands | ||
| Cuba* | Switzerland | ||
| Czech Republic | |||
| Hungary | |||
| Moldova | |||
| Poland | |||
| Romania* | |||
| Bosnia-Herzegovina | |||
| Croatia | |||
| Greece | |||
| Macedonia | |||
| Montenegro* | |||
| Serbia | |||
| Slovenia | |||
| Spain** | |||
| New Zealand | |||
| United States* |
* Through 2010
** Through 12-month period ending June 2011
Source: National statistical offices and PRB estimates.
In order to classify such a large amount of data, the table above groups countries into fertility-change categories. This is difficult given the various patterns of change, but the table offers an approximate summary of where countries stand. In this update, a new category has been added from last year: “Declined in 2011.” In a large number of countries, the TFR declined in 2011 (and may have in 2010 also), a development often linked to the global recession. Only in a handful of Eastern European countries, such as Russia, have there been notable increases, likely due to pronatalist policies and financial incentives. In the table, “Riser” countries are those that have had an increase of 0.3 or more above the TFR low point since 1996. Countries with less than a 0.3 TFR increase but more than 0.2 are called “Modest Risers.” The other two categories are self-explanatory.
For many countries concerned about a dwindling number of younger workers paying taxes to support a growing number of retirees, the 2011 results must be rather discouraging.
Related Posts
Adolescents and Youth Are Key to Fully Achieving Universal Health Coverage
In 2021, adolescents and youth between ages 10 and 24 are estimated to make up approximately 24% of the world’s population.

Understanding and Comparing Population Projections in Sub-Saharan Africa
The release of a new set of population projections by the Institute for Health Metrics and Evaluation (IHME) in July 2020 was greeted with extensive coverage in the media and stimulated fresh debate among demographers about calculation and communication of projections.

Population Age Structure and Pathways to Inclusive, Effective Governance
Among countries with a youthful population, a window of opportunity to achieve key development goals opens across four sectors―health, education, the economy, and governance―as fertility declines and the age structure of the population gets older.

Aging and Health in China: What Can We Learn From the World’s Largest Population of Older People?
The United Nations projects that there will be 366 million older Chinese adults by 2050, which is substantially larger than the current total U.S. population of 331 million.