Report Explores Appalachia’s Current Strengths and Vulnerabilities

Appalachian Communities May Be More Vulnerable to the Coronavirus Pandemic’s Health and Schooling Impacts
Although Appalachia’s residents of nearly all ages have been more likely to have health insurance than other Americans in recent years, the Region may be more vulnerable to the health and schooling impacts of the coronavirus pandemic due to larger shares of elderly and disabled residents and lower levels of computer and broadband access.
The Appalachian Region: A Data Overview From the 2014-2018 American Community Survey (51 MB), a Population Reference Bureau (PRB) report for the Appalachian Regional Commission, provides a comprehensive picture of social and economic conditions in Appalachia prior to the coronavirus pandemic. These data can help researchers and policymakers assess the pandemic’s potential implications for the Region.
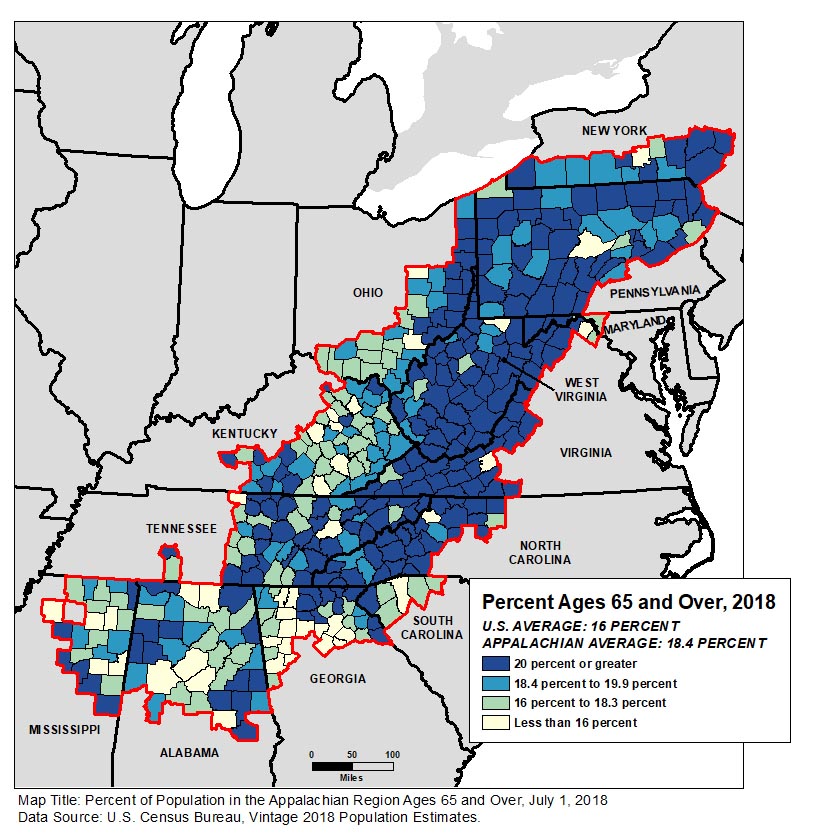
People ages 65 and older made up 18.4% of Appalachia’s population—more than two percentage points above the national average. The share exceeded 20% in more than half of the Region’s counties (see Figure 1).
FIGURE 1. Percent of Population in Appalachian Region Ages 65 and Over, July 1, 2018
Among all age groups, the share of Appalachian residents who reported a disability (difficulty with hearing, vision, cognition, walking or climbing, self-care, or independent living) in 2014-2018 was above the national average—with the widest gap among 35- to 64-year-olds (more than four percentage points: 17.1% in Appalachia versus 12.8% nationwide).
“People ages 65 and over and those with underlying health conditions are considered among the groups most vulnerable to serious complications related to the coronavirus; if the virus becomes widespread in Appalachian communities with the largest share of older adults, they may risk high illness and death rates,” says Kelvin Pollard, PRB senior demographer and report co-author.
Just over 84% of Appalachian households had access to a computer device, nearly five percentage points below the national average. The share of households with broadband access, at 75%, was likewise five points below the national average. The report found that the digital divide was particularly acute in Appalachia’s most rural communities: three in 10 rural Appalachian households lacked internet access.
“With most schools closed due to the coronavirus pandemic, this rural digital divide has made online education and maintaining learning extremely challenging,” according to report co-author Linda A. Jacobsen, PRB’s vice president for U.S. Programs.
Rural Appalachia at a Disadvantage Compared With Elsewhere in Rural America
The report also compares Appalachia’s 107 rural counties (that is, counties that are neither part of nor adjacent to a metropolitan area) to the 840 rural counties outside the Region. It shows that rural Appalachia lagged behind the rest of rural America on a variety of measures such as educational attainment, household income, population growth, and labor force participation.
However, residents of rural counties in Appalachia were more likely than residents of rural counties outside the Region to have health insurance coverage in the 2014-2018 period—both among all residents and among young adults ages 26 to 34 where noncoverage rates were highest.
But disability rates and poverty rates were also significantly higher in rural Appalachia than in other parts of rural America (see Figure 2). Disability rates in Appalachia were higher in every age group, with a six-percentage point gap among those ages 35 to 64 and ages 65 and older.
FIGURE 2. Levels of Disability and Poverty Are Higher Across All Age Groups in Rural Appalachia Than in Rural Counties Outside the Region
| wdt_ID | Population | Appalachian Rural | Non-Appalachian Rural |
|---|---|---|---|
| 1 | With a Disability | 20 | 16 |
| 2 | Adults 18-64 With a Disability | 18 | 14 |
| 3 | Adults 35-64 With a Disability | 23 | 17 |
| 4 | Adults 65+ With a Disability | 44 | 38 |
| 5 | In Poverty | 22 | 16 |
| 6 | Children in Poverty | 30 | 23 |
| 7 | Adults 18-24 in Poverty | 32 | 26 |
| 8 | Adults 25-64 in Poverty | 20 | 14 |
| wdt_ID | Population | Appalachian Rural | Non-Appalachian Rural |
|---|---|---|---|
| 1 | In Poverty | 22 | 16 |
| 2 | Children in Poverty | 30 | 23 |
| 3 | Adults 18-24 in Poverty | 32 | 26 |
| 4 | Adults 25-64 in Poverty | 20 | 14 |
Poverty rates in rural Appalachia were also higher, with at least a six-percentage point gap in every age group. Nearly one-third of young adults ages 18 to 24 were in poverty in rural Appalachia in 2014-2018—a rate even higher than that among children.
“Across the country, lower-income households and young adults have been hard hit by the current pandemic in terms of job and income loss; our findings indicate that conditions were already more challenging in rural counties within Appalachia than in those outside the Region, even before the pandemic,” said Jacobsen.
Other Key Findings
- Just 26% of Appalachia’s working-age population had a four-year college degree, seven percentage points lower than the U.S. average of 33%. The share of adults with an associate’s degree was nearly 10%, slightly higher than the national average.
- Median household income in Appalachia increased by 5% between 2009-2013 and 2014-2018, just slightly below the national increase of 5.3%. But median household income in Appalachia was more than $10,000 lower than the national median of $60,293.
- Nearly three-fourths (73%) of Appalachia’s prime working-age adults (ages 25 to 64) were in the labor force in 2014-2018, which was almost five percentage points lower than in the United States as a whole. Counties with higher labor force participation rates tended to have higher levels of educational attainment, the analysis showed. Although the unemployment rate in Appalachia declined by more than three percentage points between 2009-2013 and 2014-2018, 16 counties had unemployment rates of 10% or higher in 2014-2018.
- The share of Appalachian residents living below the poverty level ($25,465 for a family of two adults and two children) exceeded the national average for every age group except those ages 65 and older. The largest gap was among young adults ages 18 to 24, where the Appalachian share was more than three percentage points higher. More than one-fifth of children and one-fourth of young adults were poor in 2014-2018.
- Appalachian residents were less likely to be without health insurance coverage in the 2014-2018 period compared with the rest of the nation (8.8% in Appalachia compared with the national average of 9.4%). The only exception was among young adults ages 26 to 34, where the share without insurance was higher in Appalachia.
- The population growth rate of 1.6% between 2010 and 2018 was significantly lower than the national average of 5.8%, with almost two-thirds of Appalachian counties experiencing a net loss of population.
- The Appalachian Region is significantly less racially and ethnically diverse than the United States as a whole. In 2018, minorities (defined as anyone identifying with a racial or ethnic group other than “white alone, not Hispanic”) made up 19% of the Appalachian population—less than half the national average. African Americans remained the largest single minority group in Appalachia. Yet Hispanics have fueled much—if not most—of the Region’s minority increase.
- Although the share of Appalachian households with no vehicle available was slightly below the national average, the share in 51 counties, primarily located in New York, Pennsylvania, West Virginia, and Kentucky, reached 10% or more.
- Nearly one-third of Appalachian workers ages 16 and older commuted to jobs outside their county of residence, four percentage points above the national average. This share was even higher across much of the Region—at least half of workers in 122 of Appalachia’s 420 counties. Many of these counties were in metro areas, including the suburbs and exurbs of Birmingham, Atlanta, and Cincinnati.
The Appalachian Region encompasses 205,000 square miles along the Appalachian Mountains from southern New York to northern Mississippi, including portions of 12 states and all of West Virginia. The Appalachian Regional Commission report uses data from the 2014-2018 American Community Survey and the Census Bureau’s vintage 2018 population estimates—the most recent data available for the characteristics studied. It includes detailed tables and county-level maps covering state- and county-level data on population, age, race and ethnicity, housing occupancy and tenure, housing type, education, computer ownership and internet access, labor force participation, employment and unemployment, transportation and commuting, income and poverty, health insurance coverage, disability status, migration patterns, and veteran status. It also includes a detailed comparison of characteristics in rural Appalachian counties with those outside the Region.
About the Appalachian Regional Commission
The Appalachian Regional Commission is an economic development agency of the federal government and 13 state governments focusing on 420 counties across the Appalachian Region. ARC’s mission is to innovate, partner, and invest to build community capacity and strengthen economic growth in Appalachia to help the Region achieve socioeconomic parity with the nation.
Footnotes
Related Posts
How Accurate Was the 2020 Census—and Why Should You Care?
Significant undercounts in the 2020 Census could have serious consequences for underrepresented groups and individual states.
The Nation’s Preexisting Condition: How Rising Inequality Exacerbated the Economic Toll of the Coronavirus
In 2019, many economic indicators seemed to be pointing in the right direction. The unemployment rate had fallen to its lowest level since 1969, the poverty rate fell to the lowest level in 60 years, and the Dow Jones Industrial Average reached an all-time high.

How Will We Measure the Accuracy of the 2020 Census?
Getting an accurate 2020 Census count is important because census numbers impact daily life in the United States in many ways.

Why Are They Asking That? What Everyone Needs to Know About 2020 Census Questions
By law, the U.S. government is required to count the number of people living in the United States every 10 years.