Future Trends in Fertility Will Shape the Demographic Window of Opportunity in USAID Priority Countries
A country’s age structure is primarily driven by its past fertility trends, which have important economic, social, and political implications.
Population age structure—or the relative size of a population across age groups—is important for national policy agendas and resource allocation. Although mortality and migration play a role, a country’s age structure is primarily driven by its past fertility trends, which have important economic, social, and political implications. Whereas countries with sustained, low fertility of less than two children per woman typically experience a relatively large share of middle-aged and older adults, countries with high fertility generally have a large share of children and, to develop, must invest sufficient resources to adequately address their health and educational needs.
As fertility declines from high to low levels, the share of its young dependent population declines relative to those in the working-ages. With a higher proportion of wage earners and fewer dependents to support, a country has a window of opportunity for sustained economic growth—or a demographic dividend—when complementary investments in health, education, and infrastructure are maintained, and policies encourage an open and stable economy.1 The window is time-limited, however, eventually closing as the age structure matures and older adults account for a greater share of the population. Our analysis explores the timing and duration of countries’ window of opportunity in the 24 USAID family planning priority countries (see annex) under different future fertility scenarios.
Countries With Moderate Child Dependency Have Economically Favorable Age Structures
Demographers use a variety of measures to assess the age structure of a population. One such measure is the dependency ratio, or the number of people in the dependent age groups per 100 working-age people. The two principal dependency ratios are the child dependency ratio and the old-age dependency ratio:
Child dependency ratio: Number of children (ages 0 to 14) per 100 working-age adults (ages 15 to 64).
Old-age dependency ratio: Number of older adults (ages 65 and over) per 100 working-age adults (ages 15 to 64).
In practice, not all individuals ages 15 and 64 are working, nor is everyone less than age 15 or 65 and older dependent, economically or otherwise. Nonetheless, these categories help assess the potential burden age structure places on a country and help classify countries in a way that sheds light on the potential challenges and opportunities they face with any given age structure.
Using these two dependency ratios, we developed a typology of age structures consisting of six summary categories defined as follows:
- High child dependency: Countries with a high child dependency ratio (≥45) and low old-age dependency ratio (<15).
- Moderate child dependency: Countries with a moderate child dependency ratio (≥25 and <45) and low old-age dependency ratio (<15).
- Double dependency: Countries with a moderate child dependency ratio (≥25 and <45) and high old-age dependency ratio (≥15).
- High old-age dependency: Countries with a low child dependency ratio (<25) and high old-age dependency ratio (≥15).
- Low overall dependency: Countries with both a low child dependency ratio (<25) and low old-age dependency ratio (<15).2
- High overall dependency: Countries with both a high child dependency ratio (≥45) and high old-age dependency (≥15).
The timing and pace of a country’s age structure shifts depend on the timing and speed at which its fertility rate changes. This article presents future country-level trajectories for age structural transitions under three fertility scenarios—high, medium, and low fertility—between 2020 and 2100 in the 24 countries. Population projections are generated using assumptions about the future and therefore always include an element of uncertainty and variability that should inform their interpretation. This note of caution is particularly relevant for projections looking far into the future. Even in view of these important limitations, comparing the projected trajectories over the next eight decades across three fertility scenarios enables us to highlight the impact that differences in fertility levels can have on age structure changes over time.3
Our analysis explores when and for how long countries are projected to be classified in the moderate child dependency category under each fertility scenario. Based on the few available definitions of the demographic window of opportunity, the moderate child dependency category is the age structure category that is most aligned with the existing definitions.4
Countries in the moderate child dependency category have experienced a decline in child dependency from a high level (45 or more children less than age 15 per 100 people ages 15 to 64) to a moderate level (between 25 and 44 children less than age 15 per 100 people ages 15 to 64), yet old-age dependency still remains low (less than 15 older adults ages 65 and over per 100 people ages 15 to 64). In this category, working-age adults comprise a larger share of the population than any other age group. Assuming the growing working-age population can find gainful employment in the labor markets, savings, production, and income grow, increasing countries’ capacity to invest in social and economic infrastructure and boost sustainable development. When the old-age dependency ratio reaches higher levels, countries increasingly experience pressure to divert resources towards supporting the older population, for example through pensions and long-term care services. This pressure can exist in both double-dependency and high-old age dependency countries. In countries with a limited pension system, working-age adults still provide a source of informal support to older family members. While the low overall dependency category (where both child and old-age dependencies are low) is also an optimal time for investments that boost economic growth, it is common only in a limited number of countries, typically with sustained immigration of working-age adults.
To identify when and for how long countries are projected to be in the moderate child dependency category under each fertility scenario, our analysis identifies which age structure category the countries are projected to occupy for each five-year period between 2020 and 2100 per scenario. We use population projections produced by the United Nations Population Division (UNPD) based on the high-, medium-, and low-fertility scenarios.5 The assumptions in the three fertility scenarios differ by a half-child per woman; that is, compared to the average woman under the medium-fertility scenario, a woman has a half-child fewer under the low-fertility scenario and a half-child more under the high-fertility scenario. The differences in the age structure trajectories across different scenarios therefore reflect the impact of having a half-child more or a half-child less than the medium fertility assumptions made by the UNPD.
Most Priority Countries Will Retain High Child Dependency for Decades
If fertility decline follows the medium fertility scenario—a pattern similar to past transitions—only half of the USAID family planning priority countries will enter the moderate child dependency category by 2050.
Almost all of the countries analyzed—21 out of 24, with Bangladesh, India, and Nepal as the exceptions—were in the high child dependency category in 2020 (see the 2020 map in Figure 1). Under the medium-fertility assumptions, seven of those 21 countries are projected to make the transition from high child dependency to moderate child dependency between 2020 and 2050.6 Twelve more countries are projected to make the transition between 2050 and 2075, and the last two countries, Mozambique and Zambia, are projected to do so between 2075 and 2100. For countries with late transitions, the time spent in the moderate child dependency category is projected to be brief: By 2100, all 24 countries are projected to have transitioned out of the moderate child dependency category and be in the double dependency or high old-age dependency categories.
The projected timing of the transition from high to moderate child dependency varies substantially across and within regions. Some countries in South Asia have already made the transition and the rest are expected to do so by 2045. The transition is projected to take place between 2050 and 2080 for the 10 countries in East Africa and between 2055 and 2075 for the five countries in West Africa according to the medium-fertility scenario.
Figure 1. Age Structure Categories for the 24 USAID Family Planning Priority Countries (Medium Fertility Scenario): 2020, 2050, 2075, and 2100
Variations in the pace of fertility decline can accelerate or stall age structural transitions by over two decades.
The timing of country transitions across each age structure category and each country’s duration within each category also vary substantially under different future fertility scenarios. Under the high-fertility scenario, in which fertility declines slowly, countries are projected to make the transition into the moderate child dependency category 10 to 25 years later compared to the medium-fertility scenario. In contrast, countries could make the transition five to 20 years earlier under the low-fertility scenario with accelerated fertility decline. Youthful, high-fertility countries, such as those in sub-Saharan Africa, are also projected to spend five to 20 years longer in the moderate child dependency category under the low-fertility scenario compared to the medium-fertility scenario. Extending the duration spent in the moderate child dependency category would give countries more time to invest in the health and education of children and young people and to implement policies for economic growth that are key ingredients for attaining a demographic dividend.
Kenya provides an example of the range of possible transitions from high child dependency to moderate child dependency: Kenya could enter the moderate child dependency category around 2035, 2050, or 2065 under the low-, medium-, and high-fertility scenarios, respectively (see Figure 2). Likewise, Kenya could remain in the moderate child dependency category for as long as 25 years in the low-fertility scenario, compared to just five years in the high-fertility scenario. Our analysis indicates that by accelerating the pace of fertility decline, Kenya could enter the optimal moderate child dependency category 15 years earlier and stay in the category for a decade longer. On the other hand, if fertility declines more slowly than assumed in the medium-fertility scenario, Kenya is projected to enter the moderate child dependency category around 15 years later and spend approximately 10 fewer years in the category.
Figure 2. Age Structure Trajectories for 2020-2100 Under High-, Medium-, and Low-Fertility Scenarios for the 24 USAID Family Planning Priority Countries
Nigeria, which has a higher current fertility rate than Kenya, is projected to enter the moderate child dependency category around 2075 under the medium-fertility scenario but would not reach this category until around 2095 under the high-fertility scenario (see the Nigeria graph in Figure 2). In the low-fertility scenario, Nigeria would enter the moderate child dependency category much earlier, around 2060. Nigeria’s time in the optimal moderate child dependency category could be as short as around 10 years under the high-fertility scenario, or as long as around 30 years under the low-fertility scenario. By accelerating fertility decline to the low-fertility scenario level, Nigeria could enter the moderate child dependency category 15 years earlier and spend five additional years in the category compared to the medium-fertility scenario.
Sound Policy Investments Can Extend the Window of Opportunity
Our findings underscore the need for countries to intentionally plan and allocate resources based on the realities of age structure in their contexts and when they will enter the window of opportunity. Forward-looking planning is essential given the time-limited nature of the window of opportunity. Further, our analysis shows that high-fertility countries that experience faster fertility decline will benefit from a longer-lasting favorable age structure, while slow and gradual fertility decline will compress the window of opportunity and hasten the transition to double dependency burden. As countries anticipate the window of opportunity, the likely duration of that window could influence their policy choices and help policymakers prioritize certain investments.
Countries with a youthful age structure, where a large share of the population is under age 15, should prioritize efforts to expand access to and use of voluntary family planning and reproductive health services. In addition to the benefits of family planning to women and couples, these investments may accelerate the pace of fertility decline and entry into the moderate child dependency category. Investments in family planning programs, as well as efforts to create an enabling environment for young entrepreneurs and job-seekers and ensure an open and stable economy—such as building reliable financial and legal institutions—should continue during the window of opportunity.7 These efforts should go hand-in-hand with investing in developing youth’s human capital, addressing barriers to women’s participation in the formal labor force, and ensuring services and opportunities reach vulnerable, neglected populations. Finally, countries should prepare for the transition to the doubled dependency and high old-age dependency age structures by addressing the spectrum of gender, cultural, and economic barriers that lead to tradeoffs between women’s workforce participation and attaining their desired family size. Further research is warranted on policy priorities that may have the greatest impact in countries projected to experience a comparatively short window of opportunity.
These findings demonstrate how current and future trends in fertility can significantly shift the opening of demographic window of opportunity. The pace of fertility decline in a high-fertility country can impact not only the timing of when the window of opportunity opens, but also the duration the window will stay open. With investments that increase access to and use of voluntary family planning and improve educational attainment for women and girls, countries may be able to open the demographic window of opportunity earlier than projected and have more time to position themselves to achieve the greatest possible benefits from the demographic dividend.
Annex: USAID Family Planning Priority Countries
USAID currently prioritizes 24 countries across Africa, Asia, and Latin America and the Caribbean with support for voluntary family planning and related health services to enable women and couples to have the number of children they want when they want them.
Africa
West Africa
Ghana
Liberia
Mali
Nigeria
Senegal
East Africa
Ethiopia
Kenya
Madagascar
Malawi
Mozambique
Rwanda
South Sudan
Tanzania
Uganda
Zambia
Middle Africa
Democratic Republic of Congo
Latin America and the Caribbean
The Caribbean
Haiti
Asia
Western Asia
Yemen
South Asia
Afghanistan
Bangladesh
India
Nepal
Pakistan
Southeast Asia
Philippines
PRB would like to acknowledge Automata Studios for their development of the charts and visuals in this web article.
- Kaitlyn Patierno, Smita Gaith, and Elizabeth Leahy Madsen, “Which Policies Promote a Demographic Dividend? An Evidence Review,” 2019, www.prb.org/resources/which-policies-promote-a-demographic-dividend-an-evidence-review/.
- Both the low overall dependency and high overall dependency categories are rare and occur more often in countries with unique fertility and migration patterns.
- The impact of any errors in the assumptions underlying population projections compounds over time, so the longer the projection period, the greater the chance the projection results will not hold. However, the long-term projections up to 2100 allows us to explore how different fertility scenarios result in remarkably different age structures for countries.
- United Nations (UN), Department of Economic and Social Affairs, World Population to 2300 (New York: UN, 2004); Richard Cincotta, “Opening the Demographic Window: Age Structure in Sub-Saharan Africa,” New Security Beat, 2017, www.newsecuritybeat.org/2017/10/opening-demographic-window-age-structure-sub-saharan-africa/.
- UN, Department of Economic and Social Affairs, World Population Prospects: The 2019 Revision (New York: UN, 2019).
- We assume age structure transitions take place in the middle of the given five-year period.
- Patierno, Gaith, and Madsen, “Which Policies Promote a Demographic Dividend?”
Related Posts
Webinar: Bridging Research and Policies: Enhancing Budgeting Processes for Africa's Demographic Dividend
PRB hosted a high-level webinar with budget experts, parliamentarians, and national directors to discuss the importance of the Demographic Dividend Sensitive Budgeting approach in enhancing budgeting processes across Africa.

Family Planning and the Gendered Impacts of Crises on Women: An Effective Tool Across Sectors to Support Women’s Empowerment and Build Resilience to Shocks
Holistic integrated solutions are key to address the interlinkages of the gendered impacts of crises.
Lesson Plans on Human Population and Demographic Studies
Find out the answers to these questions and more. The sections listed below explore eight elements of population dynamics.

Health Sector Reform: How It Affects Reproductive Health
(June 2003) Many less developed countries are reforming their health systems in an effort to achieve public health goals more affordably and effectively.
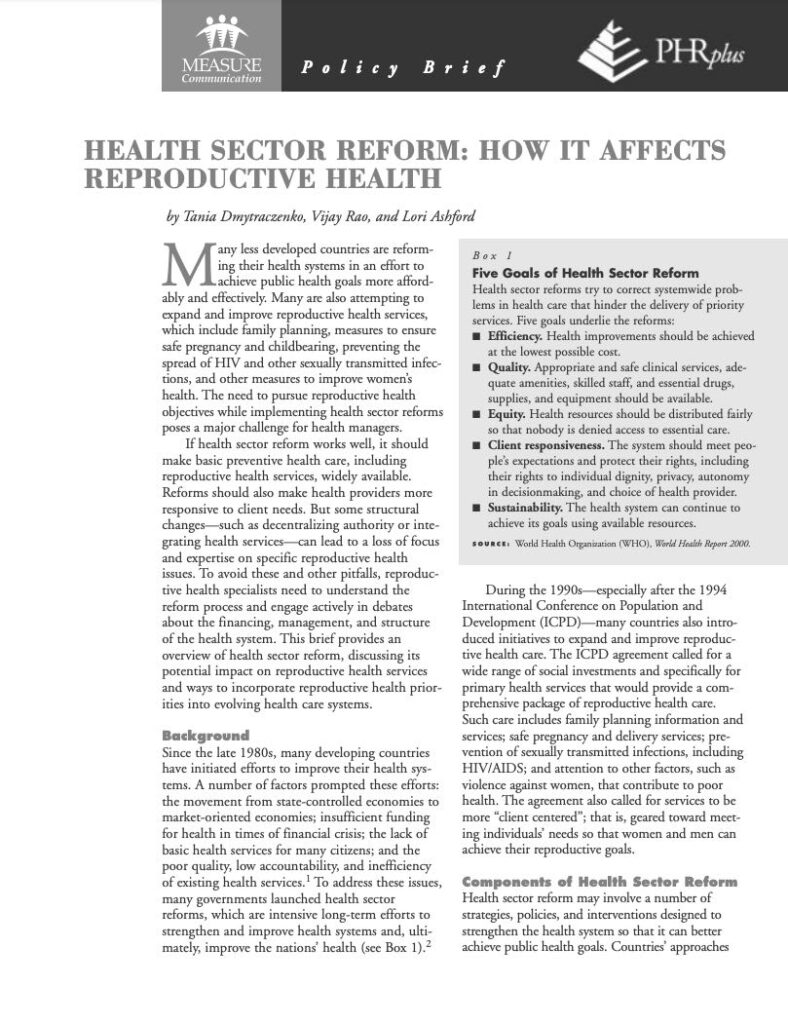
Report. Health Sector Reform: How It Affects Reproductive Health
This report also in French and Spanish. (June 2003) Many less developed countries are reforming their health systems in an effort to achieve public health goals more affordably and effectively.