U.S. Homeownership Rates Fall Among Young Adults, African Americans
The benefits of owning a home in the United States are well documented. Homes can create wealth for their owners that in turn can benefit families for generations. Homeownership can also reduce economic risk by protecting families from rising rent prices. Owning a home has also been associated with better psychological health and greater stability for homeowners’ children.1 Decennial census data can be used to monitor trends in homeownership and differences across geographic areas. The 2017 American Community Survey data provide a preview of patterns in the 2020 decennial housing data.
At the beginning of the 20th century, the homeownership rate, or the share of owner-occupied households, was 47 percent. That rate dropped to 44 percent in 1940 following the Great Depression, and then increased sharply between 1940 and 1950, from 44 percent to 55 percent. The post-World War II housing boom was fueled by low-interest loans for newly constructed homes, a provision of the G.I. Bill.2 The homeownership rate reached a peak in 2000 at 66 percent. Since the subprime mortgage crisis of 2007-2010, the rate has slowly declined, dropping to 64 percent by 2017.
Most age groups experienced a decline in homeownership rates after the subprime mortgage crisis, which ended in 2010. Between 2010 and 2017, only adults ages 65 and older experienced an increase (1 percentage point), while the rates dropped for adults ages 20 to 34 and 35 to 64 (3 percentage points each) (see Figure 1). Historically, young adult householders (ages 20 to 34) have had lower homeownership rates compared with older householders (ages 65 and older), and the gap between these two groups has increased over time—from a 25 percentage-point difference in 1960 to a 44 percentage-point gap in 2017. For adults ages 35 to 64, the homeownership rate has returned to the same level it was nearly six decades ago (67 percent).
FIGURE 1. Homeownership Rates Have Dropped Sharply Among Households Headed by Young Adults
U.S. Homeownership Rate (%) by Age of Householder, 1960 to 2017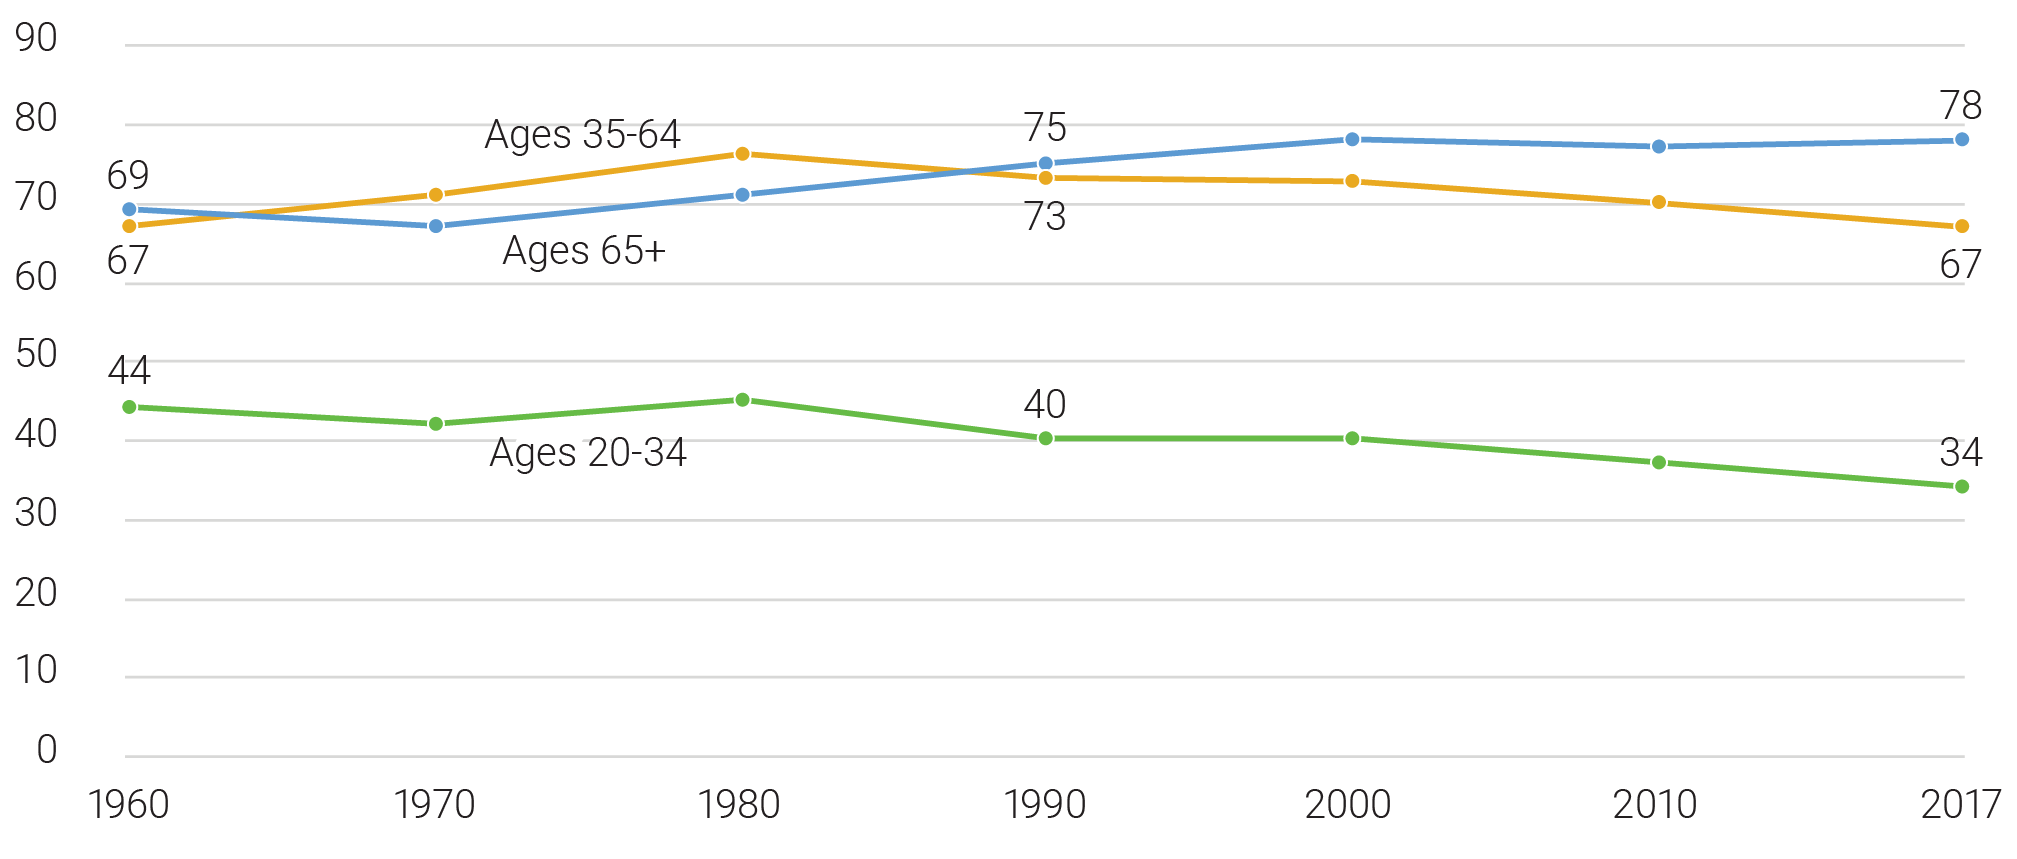
Source: Integrated Public Use Microdata Series (IPUMS), U.S. Census and American Community Survey: Version 8.0.
Between 1960 and 2017, the young adult homeownership rate dropped 10 percentage points, representing a shift from owning to renting. Although this trend suggests a change in housing preferences, more than two-thirds (67 percent) of renters report that they would buy a home if they had the financial resources to do so.3 The decline has also been linked to lower rates of marriage and household formation among young adults.4 The share of young adults ages 18 to 34 living with a spouse dropped from 26 percent in 2010 to 23 percent in 2017.
Homeownership rates also differ between urban and rural areas. In 2017, rural areas had a homeownership rate of 81 percent, compared with 60 percent in urban areas.5 This rural-urban gap is consistent across the country’s four regions but is widest in the Northeast, where the homeownership rate in rural areas (84 percent) was 26 percentage points higher than the rate in urban areas (58 percent).6 After each decennial census, the Census Bureau redefines urban and rural areas based on criteria related to population thresholds, density, distance and land use.7
The White-Black Gap in Homeownership Is Large and Growing
Leading up to the late 1960s, various race-based housing practices, such as redlining (denying loans to people in certain neighborhoods) and mortgage discrimination, led to extremely high levels of black residential segregation and housing inequality.8 As part of the civil rights movement and following the death of Martin Luther King, Jr., Congress passed the Fair Housing Act of 1968. The act made it illegal to refuse to sell or rent to any person based on race, religion, national origin, or sex. Policymakers use data from the decennial census to enforce the act by examining rental and homeownership trends.
Despite these efforts, gaps in homeownership persist across different racial and ethnic groups. Historically, white householders have had the highest homeownership rates—a pattern that continues today9 (see Figure 2). In 2017, the white homeownership rate was 72 percent, compared with a national rate of 64 percent.
FIGURE 2. The Homeownership Gap Between Whites and Other Racial/Ethnic Groups Persists
U.S. Homeownership Rate (%) by Race/Ethnicity of Householder, 2000 to 2017
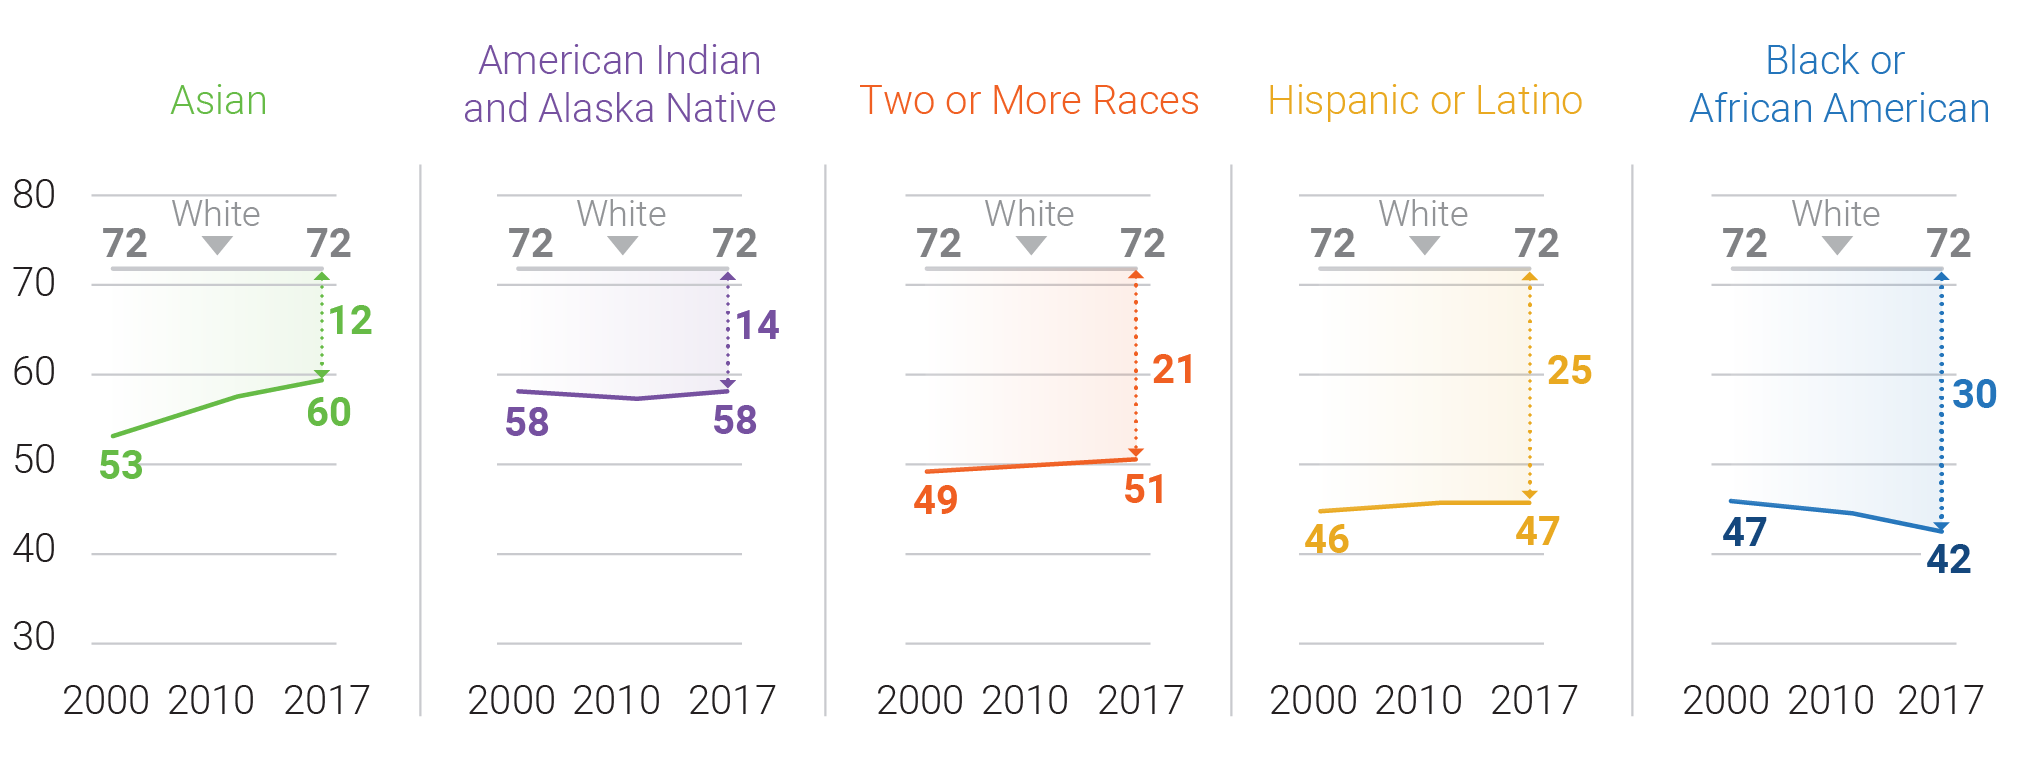
Notes: “Other living arrangements” include householders living alone, with an unmarried partner, with other relatives, or with nonrelatives. Percentages may not sum to 100 due to rounding.
Source: U.S. Census Bureau, 2010 and 2017 American Community Survey PUMS.
Asian American and American Indian/Alaska Native householders had rates 12 and 14 percentage points lower than whites, respectively. The homeownership rate was lowest among black householders (42 percent—30 percentage points lower than the rate for whites). The size of the white-black gap in homeownership varies widely across geographic areas, with larger gaps in northeastern and midwestern cities and smaller gaps in cities in the South and West.10 Data from the 2020 Census will allow researchers to analyze homeownership rates at the region-, state-, county-, census tract-, and block group-level and ascertain whether the gaps between groups are shrinking or growing.
The overall homeownership rate dropped two percentage points between 2000 and 2017. This decline can be explained in part by changes in the racial and ethnic composition of householders. Whites have a high homeownership rate relative to other racial/ethnic groups, so as the white share of householders declined between 2000 and 2017, the homeownership rate also declined.
Recovery from the subprime mortgage crisis has been uneven. Both African American and American Indian/Alaska Native householders experienced declines in homeownership between 2000 and 2010. However, the American Indian/Alaska Native homeownership rate dropped just one percentage point between 2000 to 2010 and then rebounded by 2017, while the rate for African Americans continued to fall, declining 5 percentage points from 2000 to 2017. Predatory lenders targeted black and Latino communities prior to the mortgage crisis, resulting in high foreclosure rates when home values started to fall.11 Since 2010, homeownership rates for most racial/ethnic groups held steady or increased, but the rate for blacks continued to drop, especially among young adults. With higher incomes, white families are able to purchase homes an average of eight years earlier compared with black families, generating more equity and potential for growth in assets.12
The Asian American homeownership rate increased by nearly 7 percentage points between 2000 and 2017—more than any other group. The precise reasons behind this increase are unclear, but a high median income among Asian Americans, combined with a below-average homeownership rate, has positioned them for substantial gains in homeownership in the coming years.
This article is excerpted from Mark Mather et al., “What the 2020 Census Will Tell Us About a Changing America,” Population Bulletin 74, no. 1 (2019).
Related Posts
American Community Survey Resources, Shortcuts, and Tools Workshop
Expert data users from PRB, the U.S.

Research Identifies New Strategies to Reduce Undercount of Young Children in U.S. 2020 Census
PRB identifies factors predicting where children under age 5 are more likely to be missed in the 2020 Census and develops a new undercount risk measure for young children.