572 Search Results Found For : "affordable meds https://simplemedrx.top"


Maps. 12 County Maps with Captions for Undercount Risk for Children Under Age 5

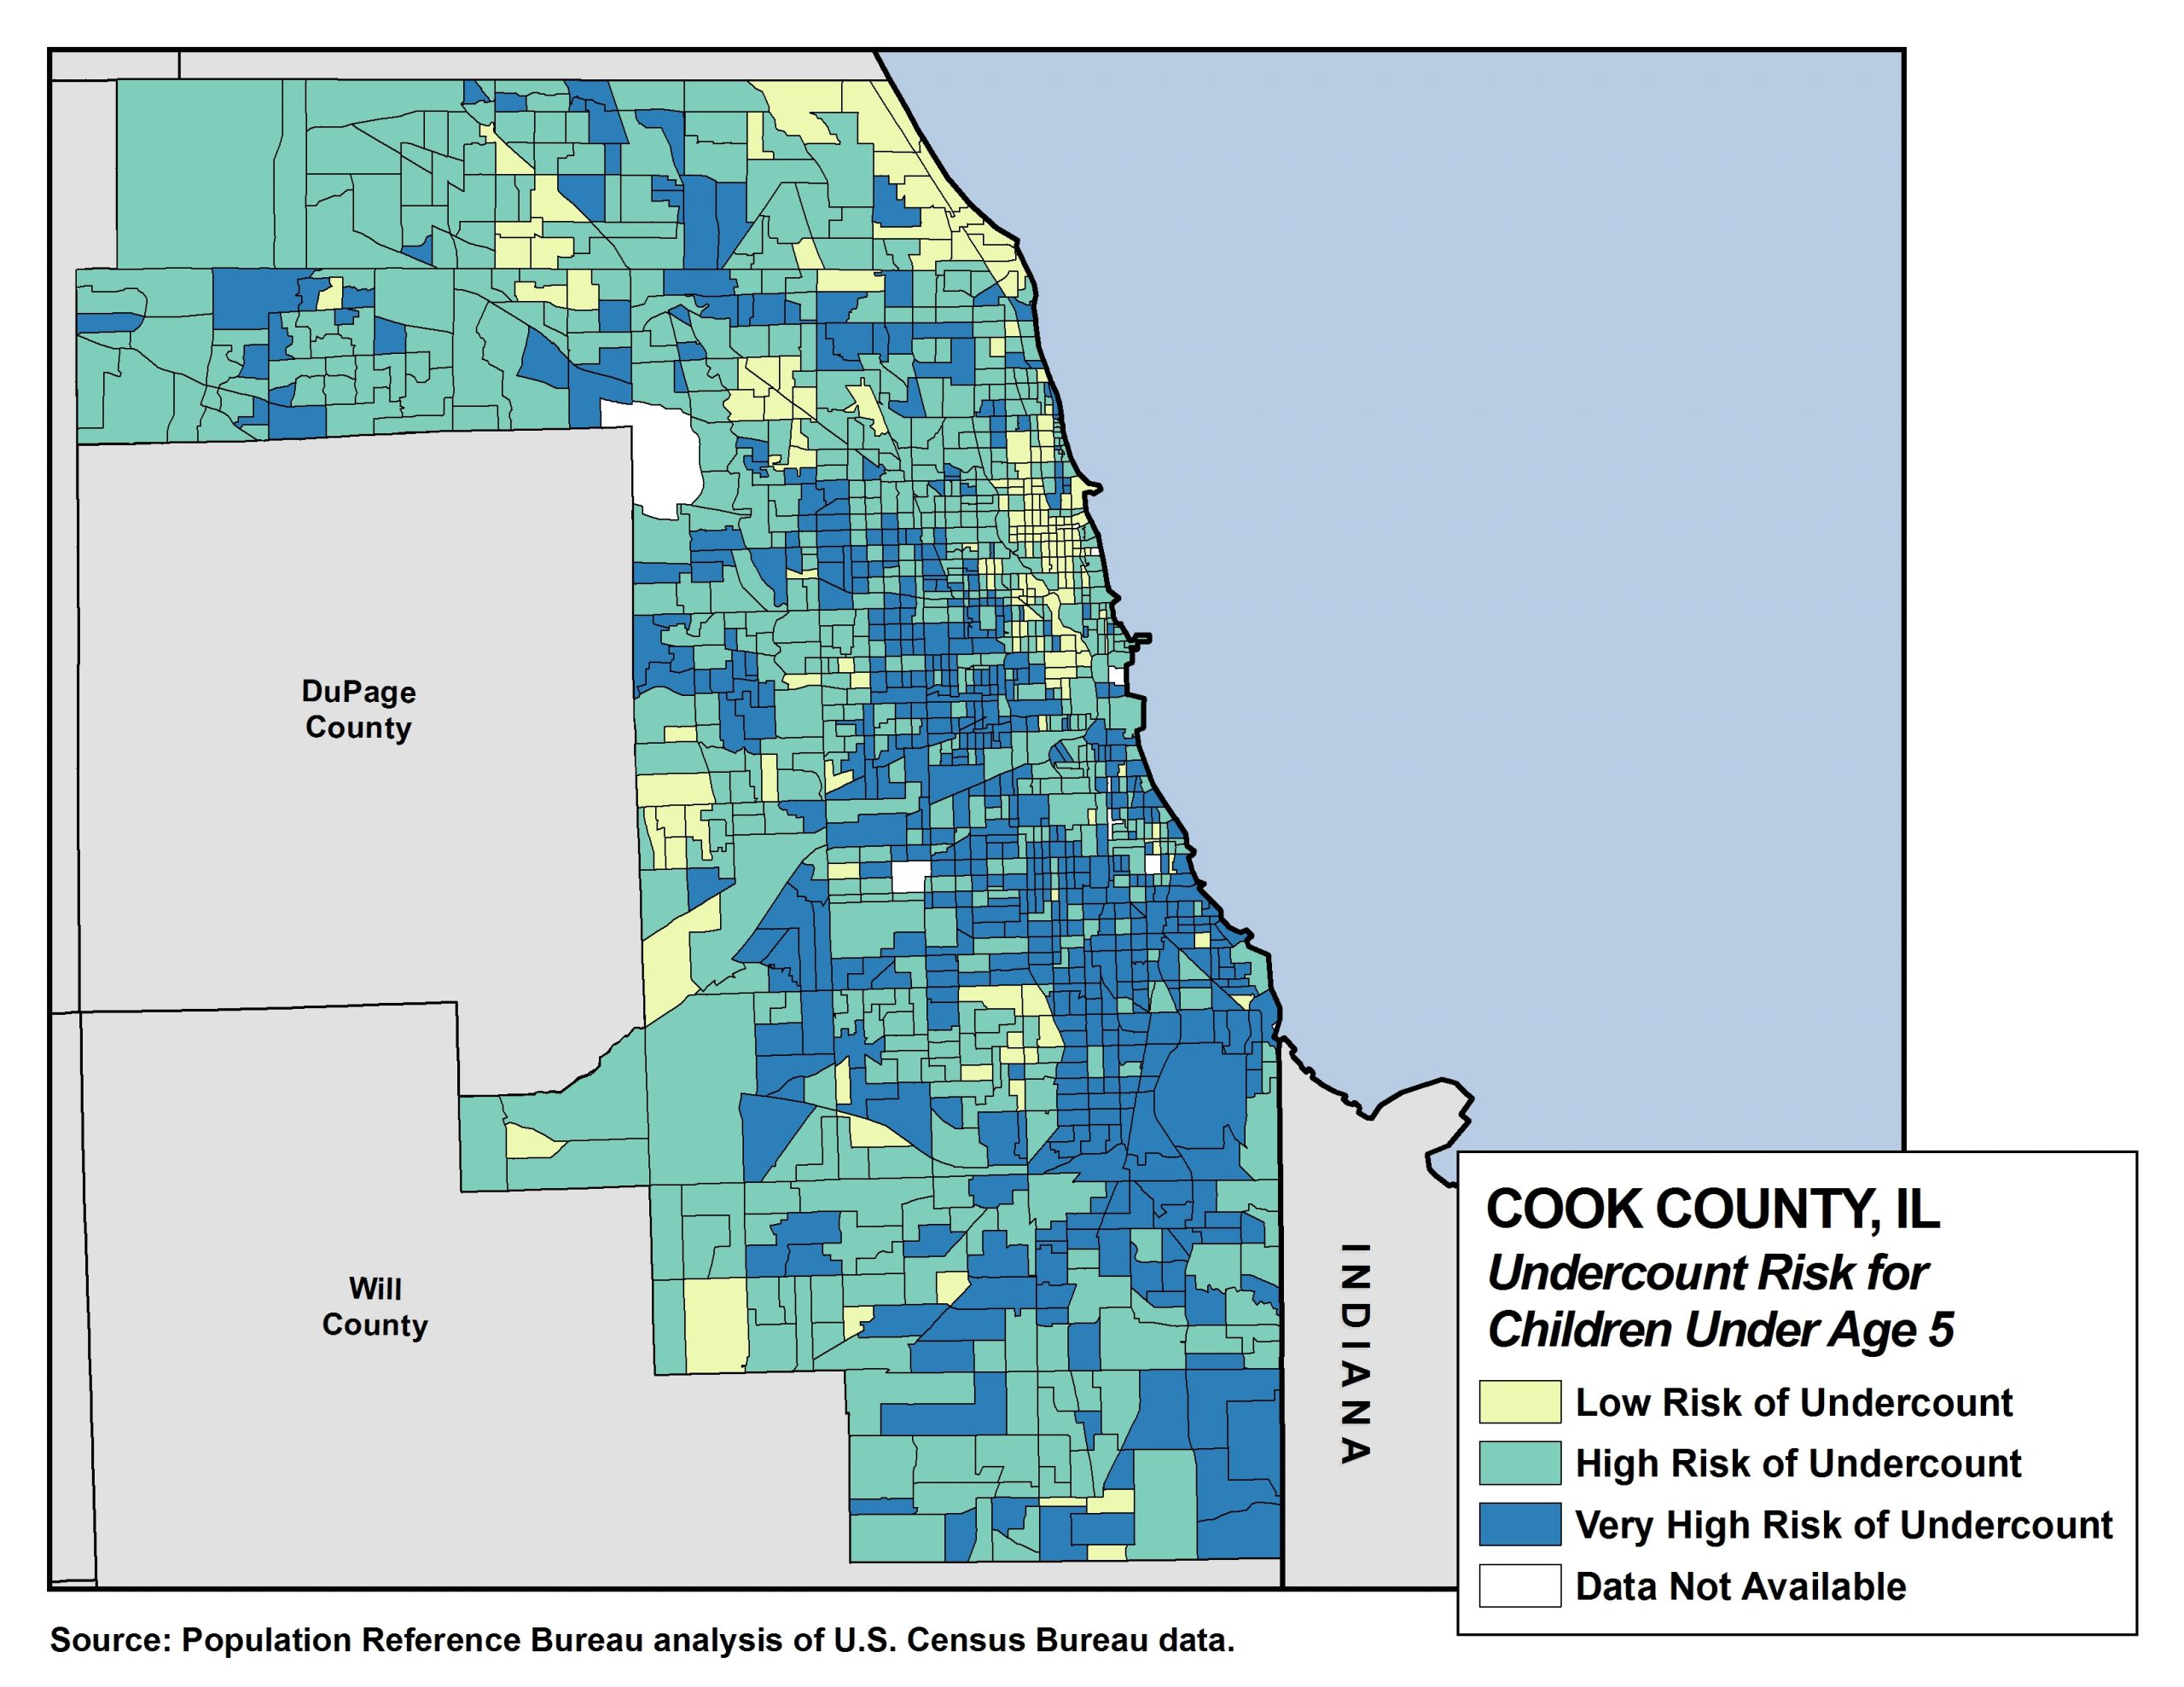
Our analysis focuses on the factors that are most closely associated with the net undercount of children in the census, based on the Census Bureau’s Revised 2018 Experimental Demographic Analysis Estimates.

View Details

What Are the Challenges to Conducting Abortion-Related Research in the United States? 

Two years after the Dobbs decision, researchers are using innovative methods to answer questions about women’s reproductive health.

View Details

Project: Demography and Economics of Aging and Alzheimer’s Disease

Interactive. Declines in Adult Death Rates Lag in the U.S. South

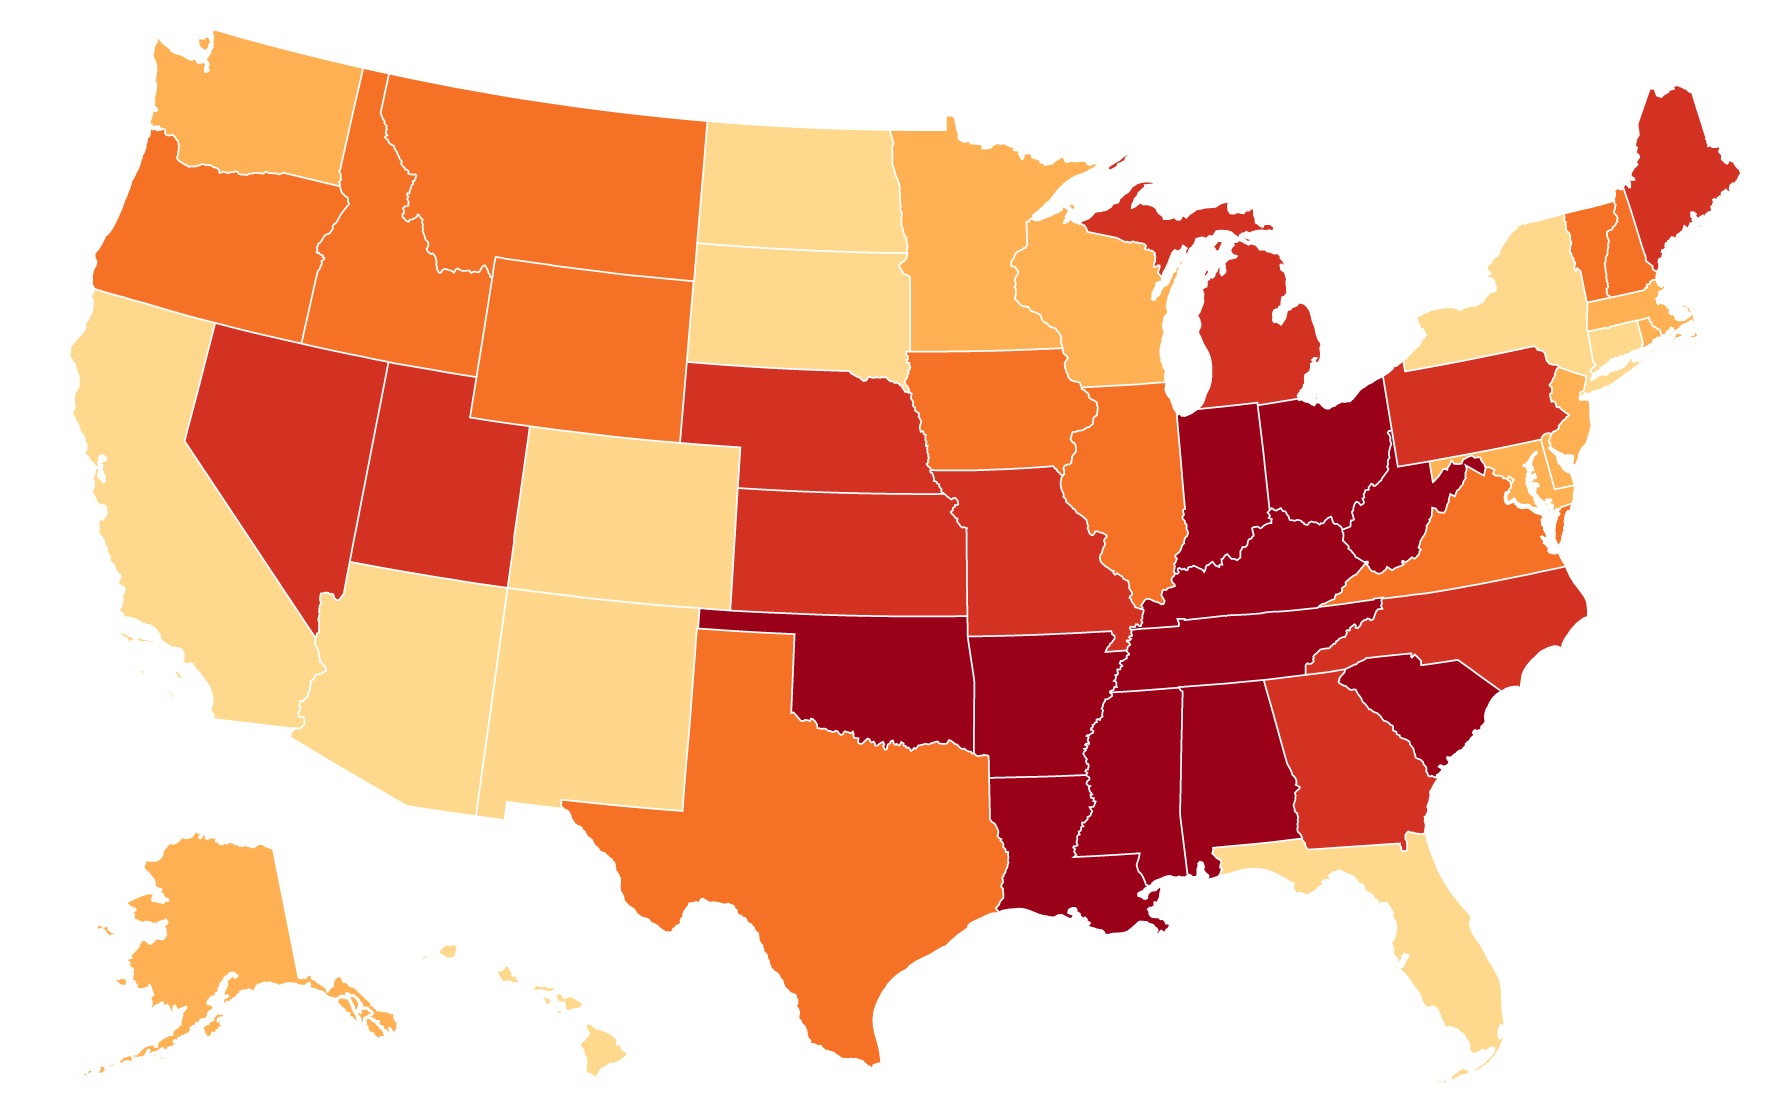
Americans are now living longer but declines in adult death rates have not been evenly distributed across states. Between 1980 and 2015, states with the highest death rates among adults ages 55 and older became increasingly concentrated in the South.

View Details

Project: Research Technical Assistance Center (RTAC)

GridWatch: A Low-Cost Approach to Measuring the Reliability of Power Systems

This fact sheet shares how companies can use GridWatch data to identify, track, and respond to outages more rapidly.

View Details

Milestones and Moments in Global Census History

What information does a census collect? The answer depends on when and where in time the census was taken.

View Details

Project: Empowering Evidence-Driven Advocacy

Infographic. Spotlight on Simiyu

Simiyu has a higher rate of teenage pregnancy than Tanzania as a whole

View Details Array ( [ID] => 11632 [id] => 11632 [title] => Tanzania-Simiyu [filename] => Tanzania-Simiyu.pdf [filesize] => 754796 [url] => https://www.prb.org/wp-content/uploads/2018/05/Tanzania-Simiyu.pdf [link] => https://www.prb.org/resources/accelerating-family-planning-progress-in-tanzania/tanzania-simiyu-2/ [alt] => [author] => 15 [description] => [caption] => [name] => tanzania-simiyu-2 [status] => inherit [uploaded_to] => 11620 [date] => 2021-01-10 00:58:24 [modified] => 2021-01-10 00:58:24 [menu_order] => 0 [mime_type] => application/pdf [type] => application [subtype] => pdf [icon] => https://www.prb.org/wp-includes/images/media/document.png ) Download (0.7 MB)

Webinar: 2011 World Population Data Sheet

(2011) Global population will reach 7 billion later in 2011, just 12 years after reaching 6 billion in 1999.

View Details Array ( [ID] => 14963 [id] => 14963 [title] => wpds-2011-world-population-data-sheet-presentation [filename] => wpds-2011-world-population-data-sheet-presentation.pdf [filesize] => 418336 [url] => https://www.prb.org/wp-content/uploads/2011/07/wpds-2011-world-population-data-sheet-presentation.pdf [link] => https://www.prb.org/resources/2011-world-population-data-sheet/wpds-2011-world-population-data-sheet-presentation/ [alt] => [author] => 15 [description] => [caption] => [name] => wpds-2011-world-population-data-sheet-presentation [status] => inherit [uploaded_to] => 5384 [date] => 2021-01-30 21:15:40 [modified] => 2021-01-30 21:15:40 [menu_order] => 0 [mime_type] => application/pdf [type] => application [subtype] => pdf [icon] => https://www.prb.org/wp-includes/images/media/document.png ) Download (0.4 MB)

Project: PACE: Policy, Advocacy, and Communication Enhanced for Population and Reproductive Health
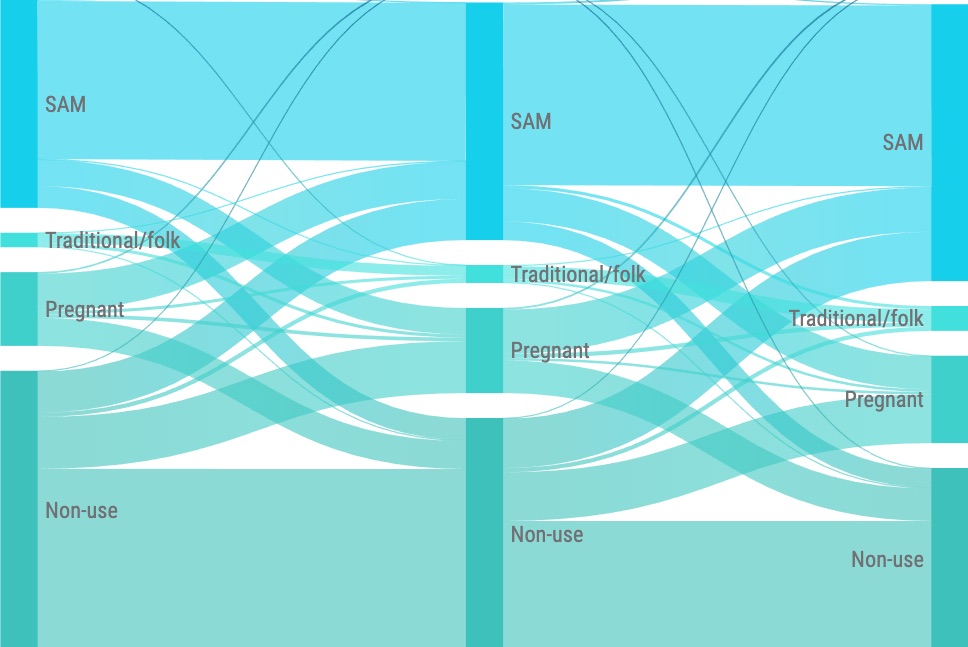
Interactive. World Population Digital Visualization 2014

PRB's Digital Visualization highlights key global demographic trends. Explore current and projected population by region and country. And look at changes in total fertility, infant mortality, and life expectancy since 1970. A U.S. "What-If" scenario focuses on the effects of race and ethnicity on child poverty, child obesity, and college degrees.

View Details