Understanding Population Projections Infographic
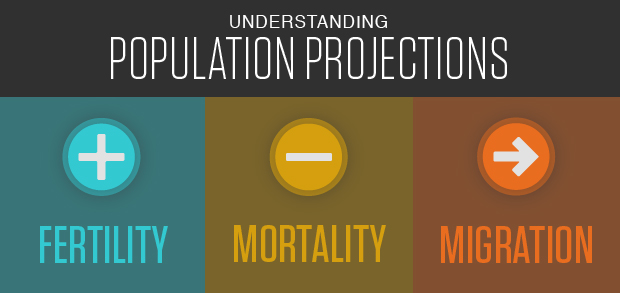
(2014) This infographic uses three main projections produced by the UN Population Division to illustrate how assumptions can produce significantly different results over time.
(2014) This infographic uses three main projections produced by the UN Population Division to illustrate how assumptions can produce significantly different results over time.
(2020) With the number of coronavirus infections surging, school districts across the United States are grappling with decisions about whether and how to re-open this fall.
Project: Research Technical Assistance Center (RTAC)
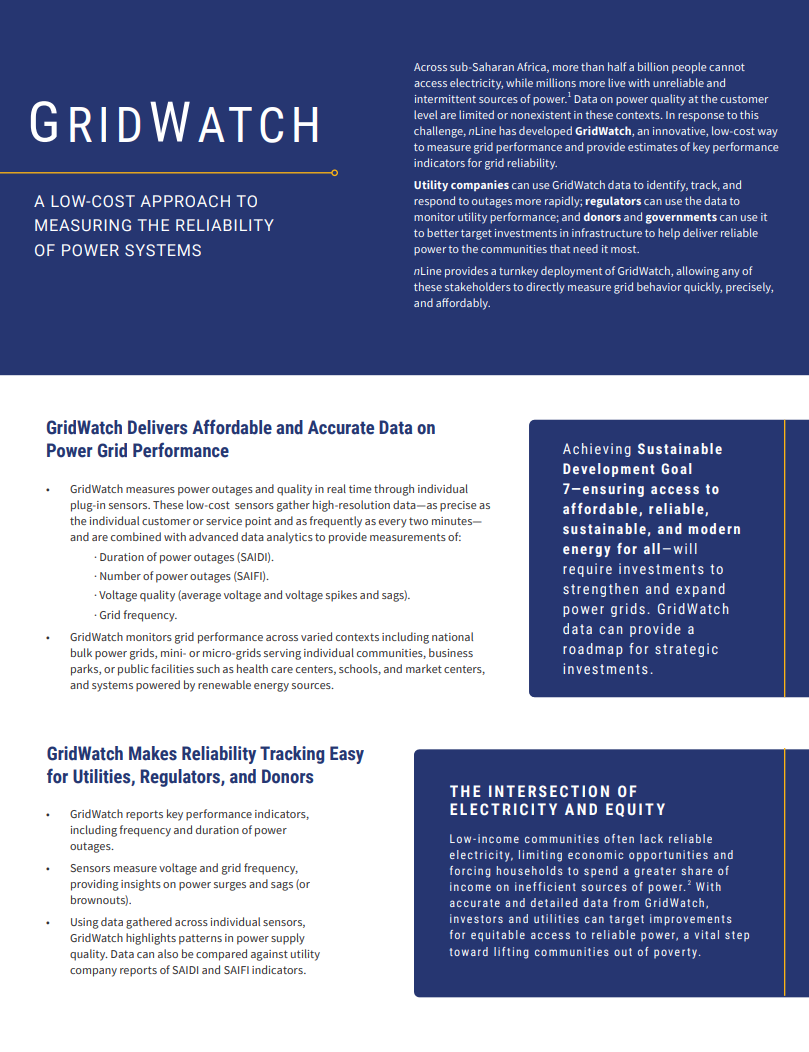
This fact sheet shares how companies can use GridWatch data to identify, track, and respond to outages more rapidly.
Project: Empowering Evidence-Driven Advocacy
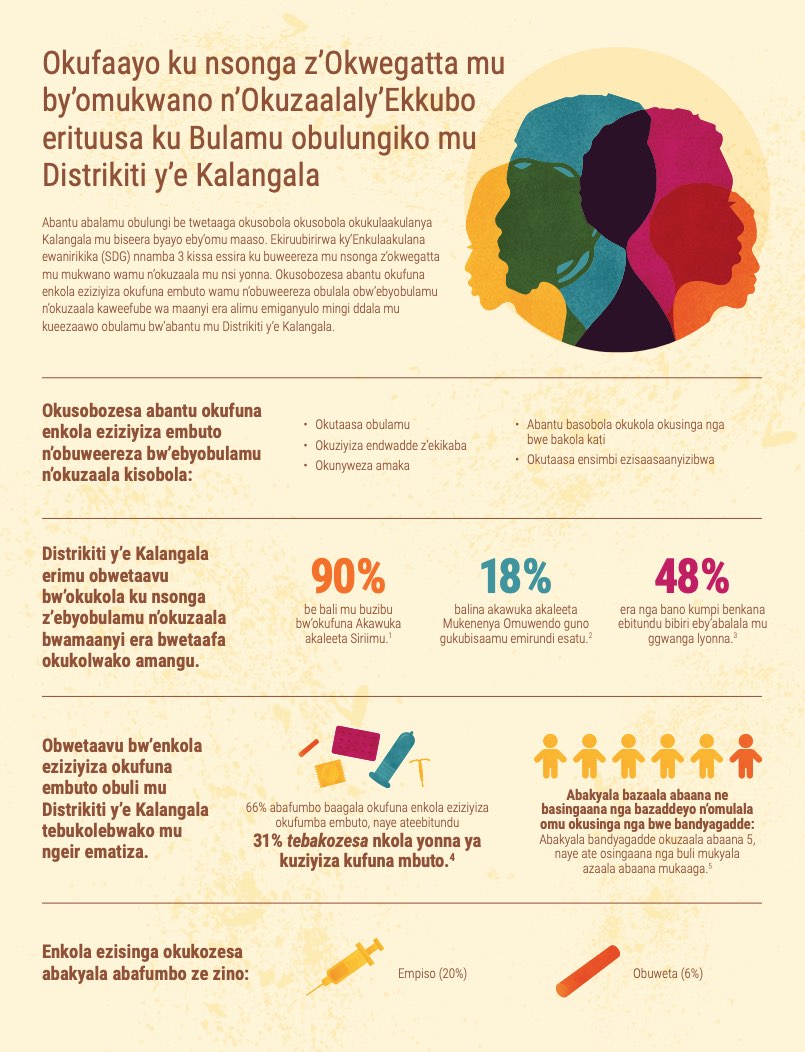
(2018) Abantu abalamu obulungi be twetaaga okusobola okusobola okukulaakulanya Kalangala mu biseera byayo eby’omu maaso.

Explaining why a behavior is wrong is the least harmful form of discipline for a young child’s development, new analysis suggests

Disability rates are down among older Americans, and more are managing daily life on their own with devices.

PRB is assessing the favorability of the policy environment for contraceptive access nationally and within each U.S. state so that state policies and programming can be easily interpreted and compared.
Project: Center for Public Information on Population Research (CPIPR)
The United States has more than 2 million people behind bars, and 45 percent were living with their children before they were imprisoned. U.S. children of incarcerated parents are an extremely vulnerable group, and much more likely to have behavioral problems and physical and mental health conditions than their peers.
Video Series: When a country's birth rate reaches roughly two children per woman, then ultimately the population growth stops.