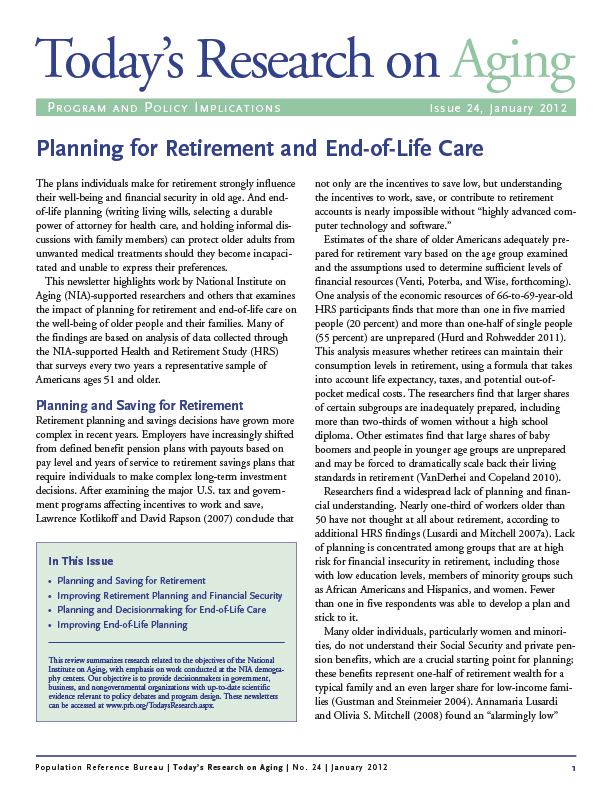
Infographic: How Are U.S. Baby Boomers Getting Along?
(2015) The U.S. baby-boom generation (people born from 1946 to 1964) is the biggest generation in U.S. history, making up close to 25 percent of the total population in 2013. This infographic illustrates data on how these baby boomers are faring as they age into retirement.
View Details
Array
(
[ID] => 13809
[id] => 13809
[title] => infographic-baby-boomers
[filename] => infographic-baby-boomers.png
[filesize] => 518521
[url] => https://www.prb.org/wp-content/uploads/2015/01/infographic-baby-boomers.png
[link] => https://www.prb.org/resources/infographic-how-are-u-s-baby-boomers-getting-along/infographic-baby-boomers/
[alt] =>
[author] => 15
[description] =>
[caption] =>
[name] => infographic-baby-boomers
[status] => inherit
[uploaded_to] => 13802
[date] => 2021-01-24 23:04:59
[modified] => 2021-01-24 23:04:59
[menu_order] => 0
[mime_type] => image/png
[type] => image
[subtype] => png
[icon] => https://www.prb.org/wp-includes/images/media/default.png
[width] => 670
[height] => 2436
[sizes] => Array
(
[thumbnail] => https://www.prb.org/wp-content/uploads/2015/01/infographic-baby-boomers-580x315.png
[thumbnail-width] => 580
[thumbnail-height] => 315
[medium] => https://www.prb.org/wp-content/uploads/2015/01/infographic-baby-boomers.png
[medium-width] => 83
[medium-height] => 300
[medium_large] => https://www.prb.org/wp-content/uploads/2015/01/infographic-baby-boomers.png
[medium_large-width] => 670
[medium_large-height] => 2436
[large] => https://www.prb.org/wp-content/uploads/2015/01/infographic-baby-boomers.png
[large-width] => 282
[large-height] => 1024
[1536x1536] => https://www.prb.org/wp-content/uploads/2015/01/infographic-baby-boomers-422x1536.png
[1536x1536-width] => 422
[1536x1536-height] => 1536
[2048x2048] => https://www.prb.org/wp-content/uploads/2015/01/infographic-baby-boomers-563x2048.png
[2048x2048-width] => 563
[2048x2048-height] => 2048
[huge] => https://www.prb.org/wp-content/uploads/2015/01/infographic-baby-boomers.png
[huge-width] => 670
[huge-height] => 2436
[small] => https://www.prb.org/wp-content/uploads/2015/01/infographic-baby-boomers.png
[small-width] => 670
[small-height] => 2436
[tiny] => https://www.prb.org/wp-content/uploads/2015/01/infographic-baby-boomers.png
[tiny-width] => 670
[tiny-height] => 2436
[smaller] => https://www.prb.org/wp-content/uploads/2015/01/infographic-baby-boomers.png
[smaller-width] => 670
[smaller-height] => 2436
[smallest] => https://www.prb.org/wp-content/uploads/2015/01/infographic-baby-boomers-416x1513.png
[smallest-width] => 416
[smallest-height] => 1513
[blurry] => https://www.prb.org/wp-content/uploads/2015/01/infographic-baby-boomers-204x742.png
[blurry-width] => 204
[blurry-height] => 742
[banner_img] => https://www.prb.org/wp-content/uploads/2015/01/infographic-baby-boomers-670x690.png
[banner_img-width] => 670
[banner_img-height] => 690
[news_thumb] => https://www.prb.org/wp-content/uploads/2015/01/infographic-baby-boomers-360x240.png
[news_thumb-width] => 360
[news_thumb-height] => 240
[media_thumb] => https://www.prb.org/wp-content/uploads/2015/01/infographic-baby-boomers-87x315.png
[media_thumb-width] => 87
[media_thumb-height] => 315
[pullquote_thumb] => https://www.prb.org/wp-content/uploads/2015/01/infographic-baby-boomers-335x300.png
[pullquote_thumb-width] => 335
[pullquote_thumb-height] => 300
[team_thumb] => https://www.prb.org/wp-content/uploads/2015/01/infographic-baby-boomers-265x270.png
[team_thumb-width] => 265
[team_thumb-height] => 270
[team_small] => https://www.prb.org/wp-content/uploads/2015/01/infographic-baby-boomers-360x360.png
[team_small-width] => 360
[team_small-height] => 360
[pdf] => https://www.prb.org/wp-content/uploads/2015/01/infographic-baby-boomers-170x245.png
[pdf-width] => 170
[pdf-height] => 245
[gform-image-choice-sm] => https://www.prb.org/wp-content/uploads/2015/01/infographic-baby-boomers.png
[gform-image-choice-sm-width] => 83
[gform-image-choice-sm-height] => 300
[gform-image-choice-md] => https://www.prb.org/wp-content/uploads/2015/01/infographic-baby-boomers.png
[gform-image-choice-md-width] => 110
[gform-image-choice-md-height] => 400
[gform-image-choice-lg] => https://www.prb.org/wp-content/uploads/2015/01/infographic-baby-boomers.png
[gform-image-choice-lg-width] => 165
[gform-image-choice-lg-height] => 600
)
)
Download
(0.5 MB)