496 Search Results Found For : "population"


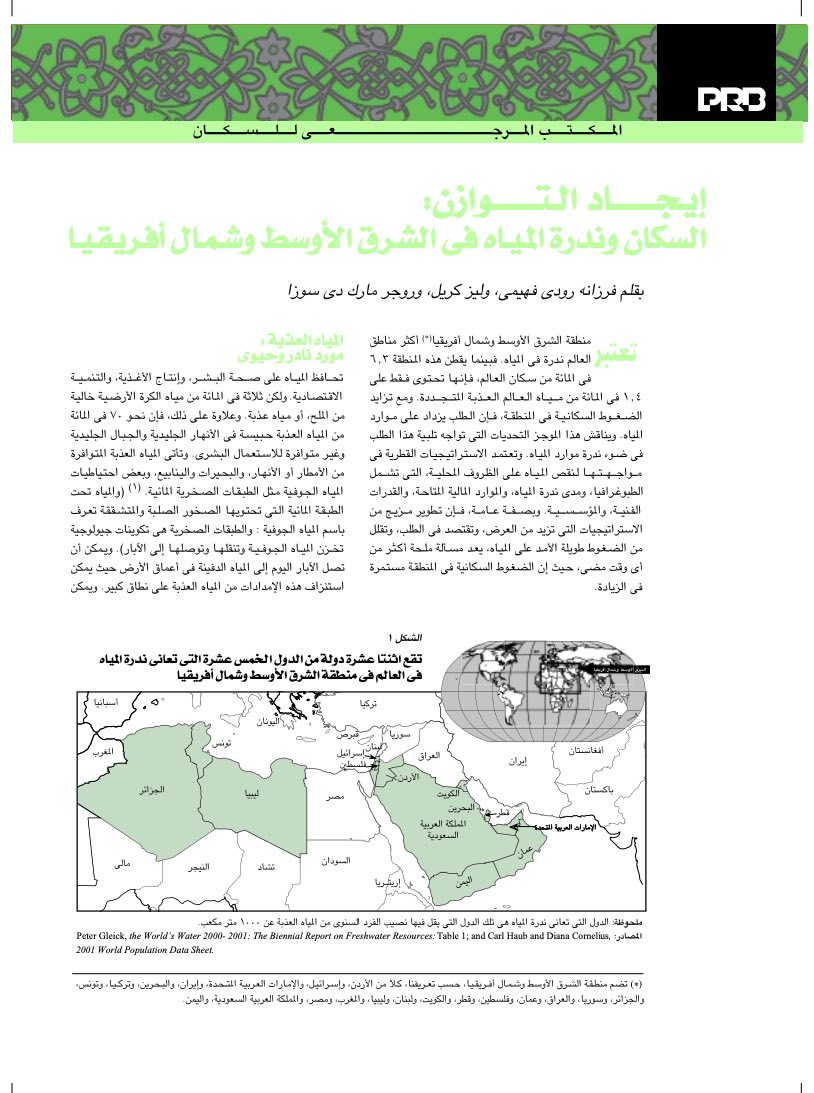
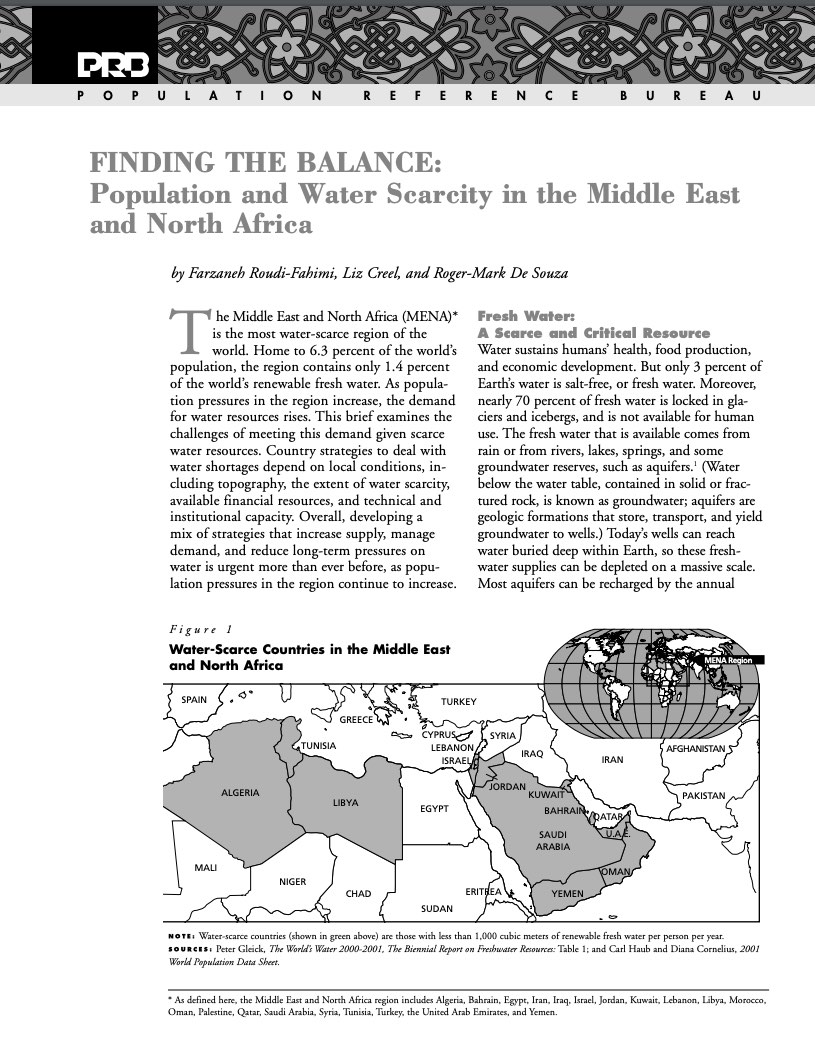
Report. Population and Water Scarcity in the Middle East and North Africa (Arabic)

(2002) The Middle East and North Africa (MENA)* is the most water-scarce region of the world. Home to 6.3 percent of the world's population, the region contains only 1.4 percent of the world's renewable fresh water.

View Details Array ( [ID] => 11899 [id] => 11899 [title] => FindingTheBalance_Arabic [filename] => FindingTheBalance_Arabic.pdf [filesize] => 1159342 [url] => https://www.prb.org/wp-content/uploads/2021/01/FindingTheBalance_Arabic.pdf [link] => https://www.prb.org/resources/report-population-and-water-scarcity-in-the-middle-east-and-north-africa/findingthebalance_arabic-2/ [alt] => [author] => 15 [description] => Population and Water Scarcity in the Middle East and North Africa [caption] => [name] => findingthebalance_arabic-2 [status] => inherit [uploaded_to] => 11894 [date] => 2021-01-12 04:02:08 [modified] => 2021-01-12 04:07:01 [menu_order] => 0 [mime_type] => application/pdf [type] => application [subtype] => pdf [icon] => https://www.prb.org/wp-includes/images/media/document.png ) Download (1.1 MB)

Finding the Balance: Population and Water Scarcity in the Middle East and North Africa

(2002) The Middle East and North Africa (MENA)* is the most water-scarce region of the world. Home to 6.3 percent of the world's population, the region contains only 1.4 percent of the world's renewable fresh water.

View Details

Understanding Population Projections: Assumptions Behind the Numbers

View Details Array ( [ID] => 15551 [id] => 15551 [title] => understanding-population-projections-2014 [filename] => understanding-population-projections-2014.pdf [filesize] => 599322 [url] => https://www.prb.org/wp-content/uploads/2014/07/understanding-population-projections-2014.pdf [link] => https://www.prb.org/resources/understanding-population-projections-assumptions-behind-the-numbers/understanding-population-projections-2014-2/ [alt] => [author] => 15 [description] => [caption] => [name] => understanding-population-projections-2014-2 [status] => inherit [uploaded_to] => 5136 [date] => 2021-02-01 20:02:53 [modified] => 2021-02-01 20:02:53 [menu_order] => 0 [mime_type] => application/pdf [type] => application [subtype] => pdf [icon] => https://www.prb.org/wp-includes/images/media/document.png ) Download (0.6 MB)

Policy Brief. Understanding Population Projections: Assumptions Behind the Numbers (2014)

Policymakers and program planners rely on population projections to assess future demand for resources such as food, water, and energy, as well as services such as health and education.

View Details Array ( [ID] => 15551 [id] => 15551 [title] => understanding-population-projections-2014 [filename] => understanding-population-projections-2014.pdf [filesize] => 599322 [url] => https://www.prb.org/wp-content/uploads/2014/07/understanding-population-projections-2014.pdf [link] => https://www.prb.org/resources/understanding-population-projections-assumptions-behind-the-numbers/understanding-population-projections-2014-2/ [alt] => [author] => 15 [description] => [caption] => [name] => understanding-population-projections-2014-2 [status] => inherit [uploaded_to] => 5136 [date] => 2021-02-01 20:02:53 [modified] => 2021-02-01 20:02:53 [menu_order] => 0 [mime_type] => application/pdf [type] => application [subtype] => pdf [icon] => https://www.prb.org/wp-includes/images/media/document.png ) Download (0.6 MB)

Ripple Effects: Population and Coastal Regions

(2003) Coastal regions, areas that are home to a large and growing proportion of the world's population, are undergoing environmental decline.

View Details Array ( [ID] => 9847 [id] => 9847 [title] => RippleEffects_Eng [filename] => RippleEffects_Eng.pdf [filesize] => 269196 [url] => https://www.prb.org/wp-content/uploads/2020/12/RippleEffects_Eng.pdf [link] => https://www.prb.org/resources/report-ripple-effects-population-and-coastal-regions/rippleeffects_eng-2/ [alt] => [author] => 15 [description] => Brief: Ripple Effects: Population and Coastal Regions, 2003 [caption] => [name] => rippleeffects_eng-2 [status] => inherit [uploaded_to] => 9845 [date] => 2020-12-26 23:26:48 [modified] => 2020-12-26 23:29:27 [menu_order] => 0 [mime_type] => application/pdf [type] => application [subtype] => pdf [icon] => https://www.prb.org/wp-includes/images/media/document.png ) Download (0.3 MB)

Report. Ripple Effects: Population and Coastal Regions

(2003) Coastal regions, areas that are home to a large and growing proportion of the world's population, are undergoing environmental decline.

View Details Array ( [ID] => 9847 [id] => 9847 [title] => RippleEffects_Eng [filename] => RippleEffects_Eng.pdf [filesize] => 269196 [url] => https://www.prb.org/wp-content/uploads/2020/12/RippleEffects_Eng.pdf [link] => https://www.prb.org/resources/report-ripple-effects-population-and-coastal-regions/rippleeffects_eng-2/ [alt] => [author] => 15 [description] => Brief: Ripple Effects: Population and Coastal Regions, 2003 [caption] => [name] => rippleeffects_eng-2 [status] => inherit [uploaded_to] => 9845 [date] => 2020-12-26 23:26:48 [modified] => 2020-12-26 23:29:27 [menu_order] => 0 [mime_type] => application/pdf [type] => application [subtype] => pdf [icon] => https://www.prb.org/wp-includes/images/media/document.png ) Download (0.3 MB)

An Overview of Population and Development in Vietnam

At the time of the April 1, 1999 Census, the population of Vietnam stood at just over 76 million, making it the 13th largest country in the world. From 1979 to 1999, nearly 24 million people were added to the country's population.

View Details

The U.S. Population Is Growing at the Slowest Rate Since the 1930s

The pace of U.S. population growth is slowing, according to the Census Bureau’s 2018 estimates and 2020 projections, which provide a preview of 2020 Census results.

View Details