Kelvin Pollard
Former Senior Demographer

The pace of U.S. population growth is slowing, according to the Census Bureau’s 2018 estimates and 2020 projections, which provide a preview of 2020 Census results.
The U.S. population has increased each decade since the first census was conducted in 1790, surpassing 50 million by 1880, 100 million by 1920, and 200 million by 1970. The 2010 Census was the first head count in which the U.S. population exceeded 300 million. However, the rate of population growth from one decade to the next has declined since 2000 (see Figure 1).
The U.S. population increased by 10 percent between 2000 and 2010 and is projected to increase by 8 percent between 2010 and 2020, from 309 million to 333 million. An 8 percent gain would be the smallest percentage increase in the U.S. population between censuses since the 1930s; the projected numerical increase of 24 million people would be the smallest gain since the 1980s. Yet, between 2010 and 2018, the U.S. population only increased by 6 percent. Unless the rate of population growth increases over the next two years, the United States may not reach the Census Bureau’s projected population size in 2020.
U.S. Population and Percentage Increase in Population Between Census Years, 1790 to 2060
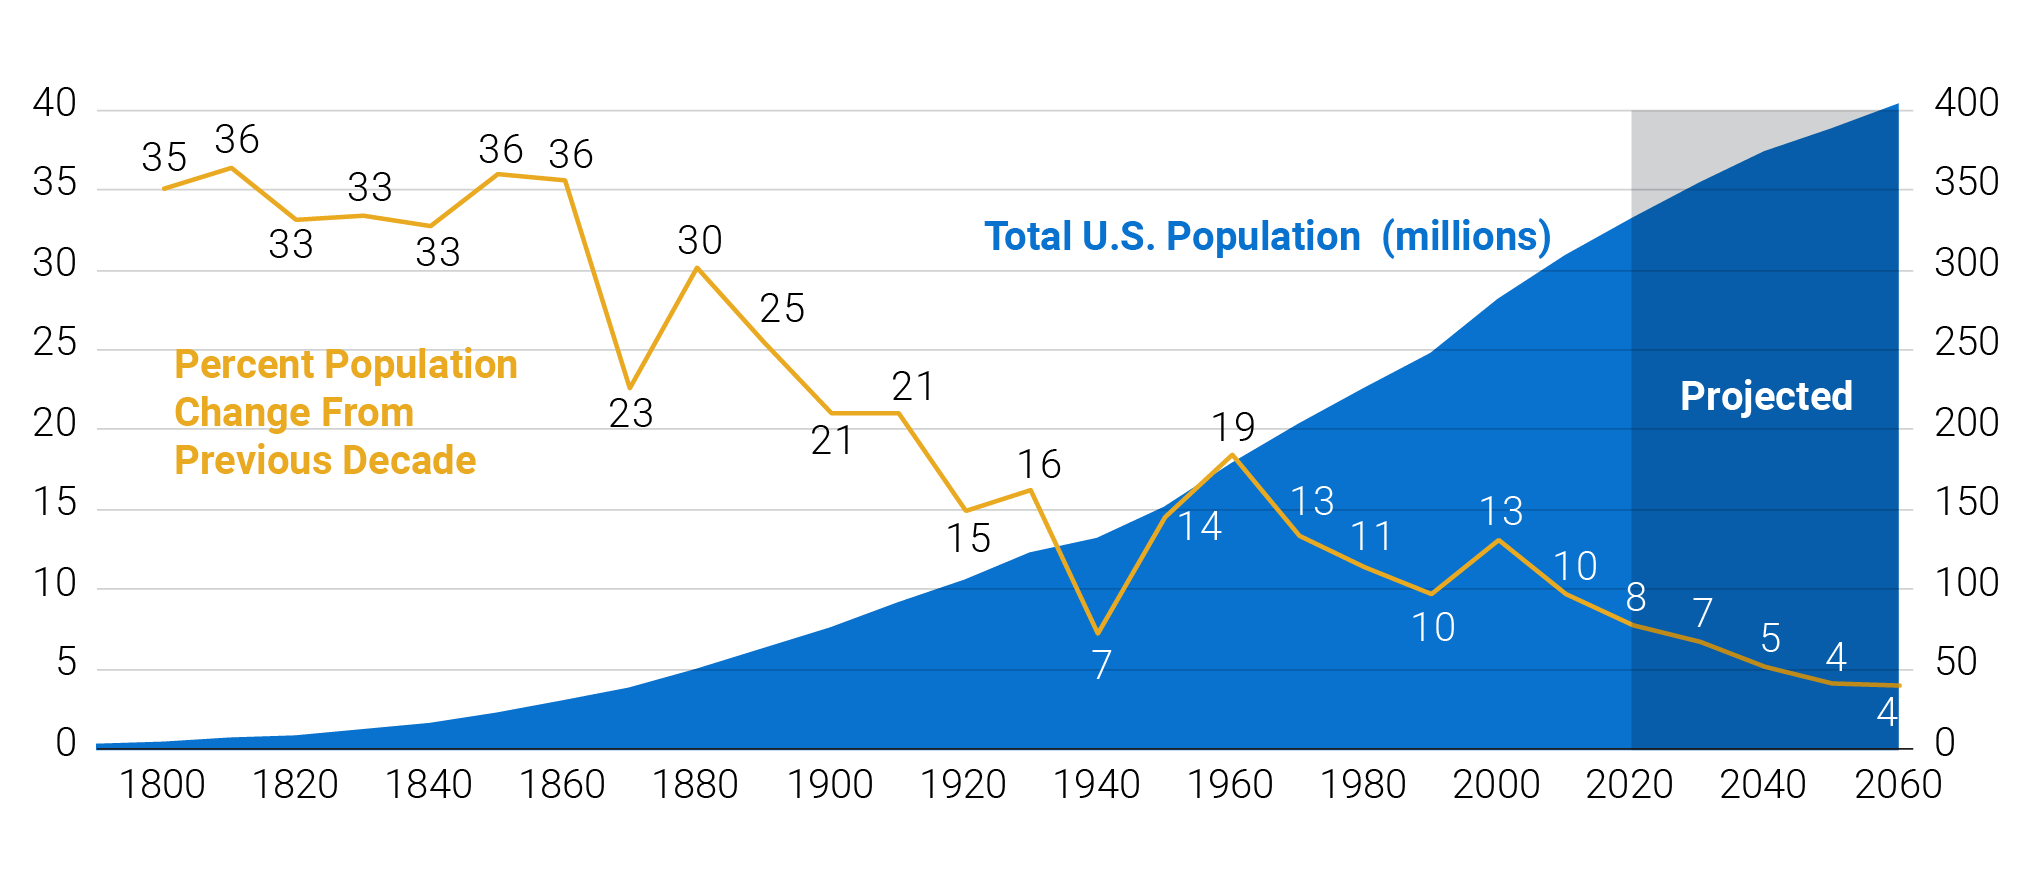
Source: U.S. Census Bureau, decennial censuses, and vintage 2018 population estimates
Growth in the number of households has also slowed, and population growth is on track to outpace household growth this decade for the first time since the 1930s. Between 2000 and 2010, the number of households increased by 11 percent, but household growth rates declined during the Great Recession of 2007 to 2009 and the slow economic recovery that followed. Between 2010 and 2017, the number of households increased by only 3 percent. For the household growth rate to equal the Census Bureau’s projected population growth rate of 8 percent, the number of households would have to increase by almost 6 million between 2017 and 2020. This level of growth seems unlikely given that the number of households only increased by 3.3 million over the seven-year period from 2010 to 2017. If the number of households continues to increase at the current average annual rate until 2020, the total increase for the decade is more likely to be around 4.8 million, representing a growth rate of only 4 percent—less than half the rate for the 2000 to 2010 period.
In the long term, slower population and household growth could negatively affect the future U.S. economy by reducing the supply of workers, the tax base, and the demand for goods and services. This slowdown could also reduce demand for new home construction and lead to declines in home values.
Although U.S. population growth has slowed, the rate of growth has been uneven across regions and states. The most recent estimates show that the South’s population grew 9 percent between 2010 and 2018, with the West right behind at 8 percent. Conversely, the population grew just 2 percent in the Midwest and 1 percent in the Northeast. Regional and state population trends are important not only from a demographic and economic perspective, but also because they affect the balance of political power in Congress. State population totals from the 2020 Census will determine how many congressional seats each state will have over the next decade, starting in January 2023 when the 118th Congress takes office.
Florida, with an estimated 21.3 million residents, has surpassed New York (population 19.5 million) as the nation’s third-largest state behind California and Texas. Between 2010 and 2018, 19 states (plus the District of Columbia) grew faster than the national average, and all but two (North Dakota and South Dakota) were in the South and West. In nine of those states and the District, the resident population increased by more than 10 percent.
Among the states, Utah, Texas, Florida, Colorado, and North Dakota grew the fastest between 2010 and 2018. North Dakota’s rapid population gains are linked to the oil boom earlier in this decade.1 The boom, however, has shown signs of slowing in recent years: Between 2016 and 2018, the state’s population growth rate was just under 1 percent—slightly below the national average (1.3 percent) and well below the 4 percent growth rate of Idaho, Nevada, and Utah.
The population declined in three states between 2010 and 2018: Connecticut, Illinois, and West Virginia. West Virginia’s population has declined every year since 2013, while the other two states have experienced net population loss each year since 2014. In addition, Alaska, Hawaii, Louisiana, Mississippi, New York, and Wyoming had fewer residents in 2018 than in 2016.
The post-2010 demographic situation is especially bleak in Puerto Rico. Between 2010 and 2018, Puerto Rico lost more than half a million residents, or 14 percent of its 2010 population. The rate of loss in the U.S. territory is nearly six times that of West Virginia, the state with the steepest population loss. Puerto Rico’s population decline is the result of both a financial crisis that first hit the territory in 2006 and the devastation wreaked by Hurricane Maria in 2017.2
These divergent population trends since 2010 have been even more pronounced at the county level. Between 2010 and 2018, nearly one-fifth of the nation’s 3,142 counties and county equivalents grew at or above the national rate of 6 percent; 340 of these counties grew 10 percent or more (see Figure 2). In contrast, more than half of U.S. counties (about 1,650) have experienced net population loss over the same period, with roughly 550 counties losing at least 5 percent of their residents. Most of the counties in the latter group started experiencing a net loss of residents as far back as the 1940s, and many have been declining in population since before the Great Depression.
County Population Change, April 1, 2010 to July 1, 2018
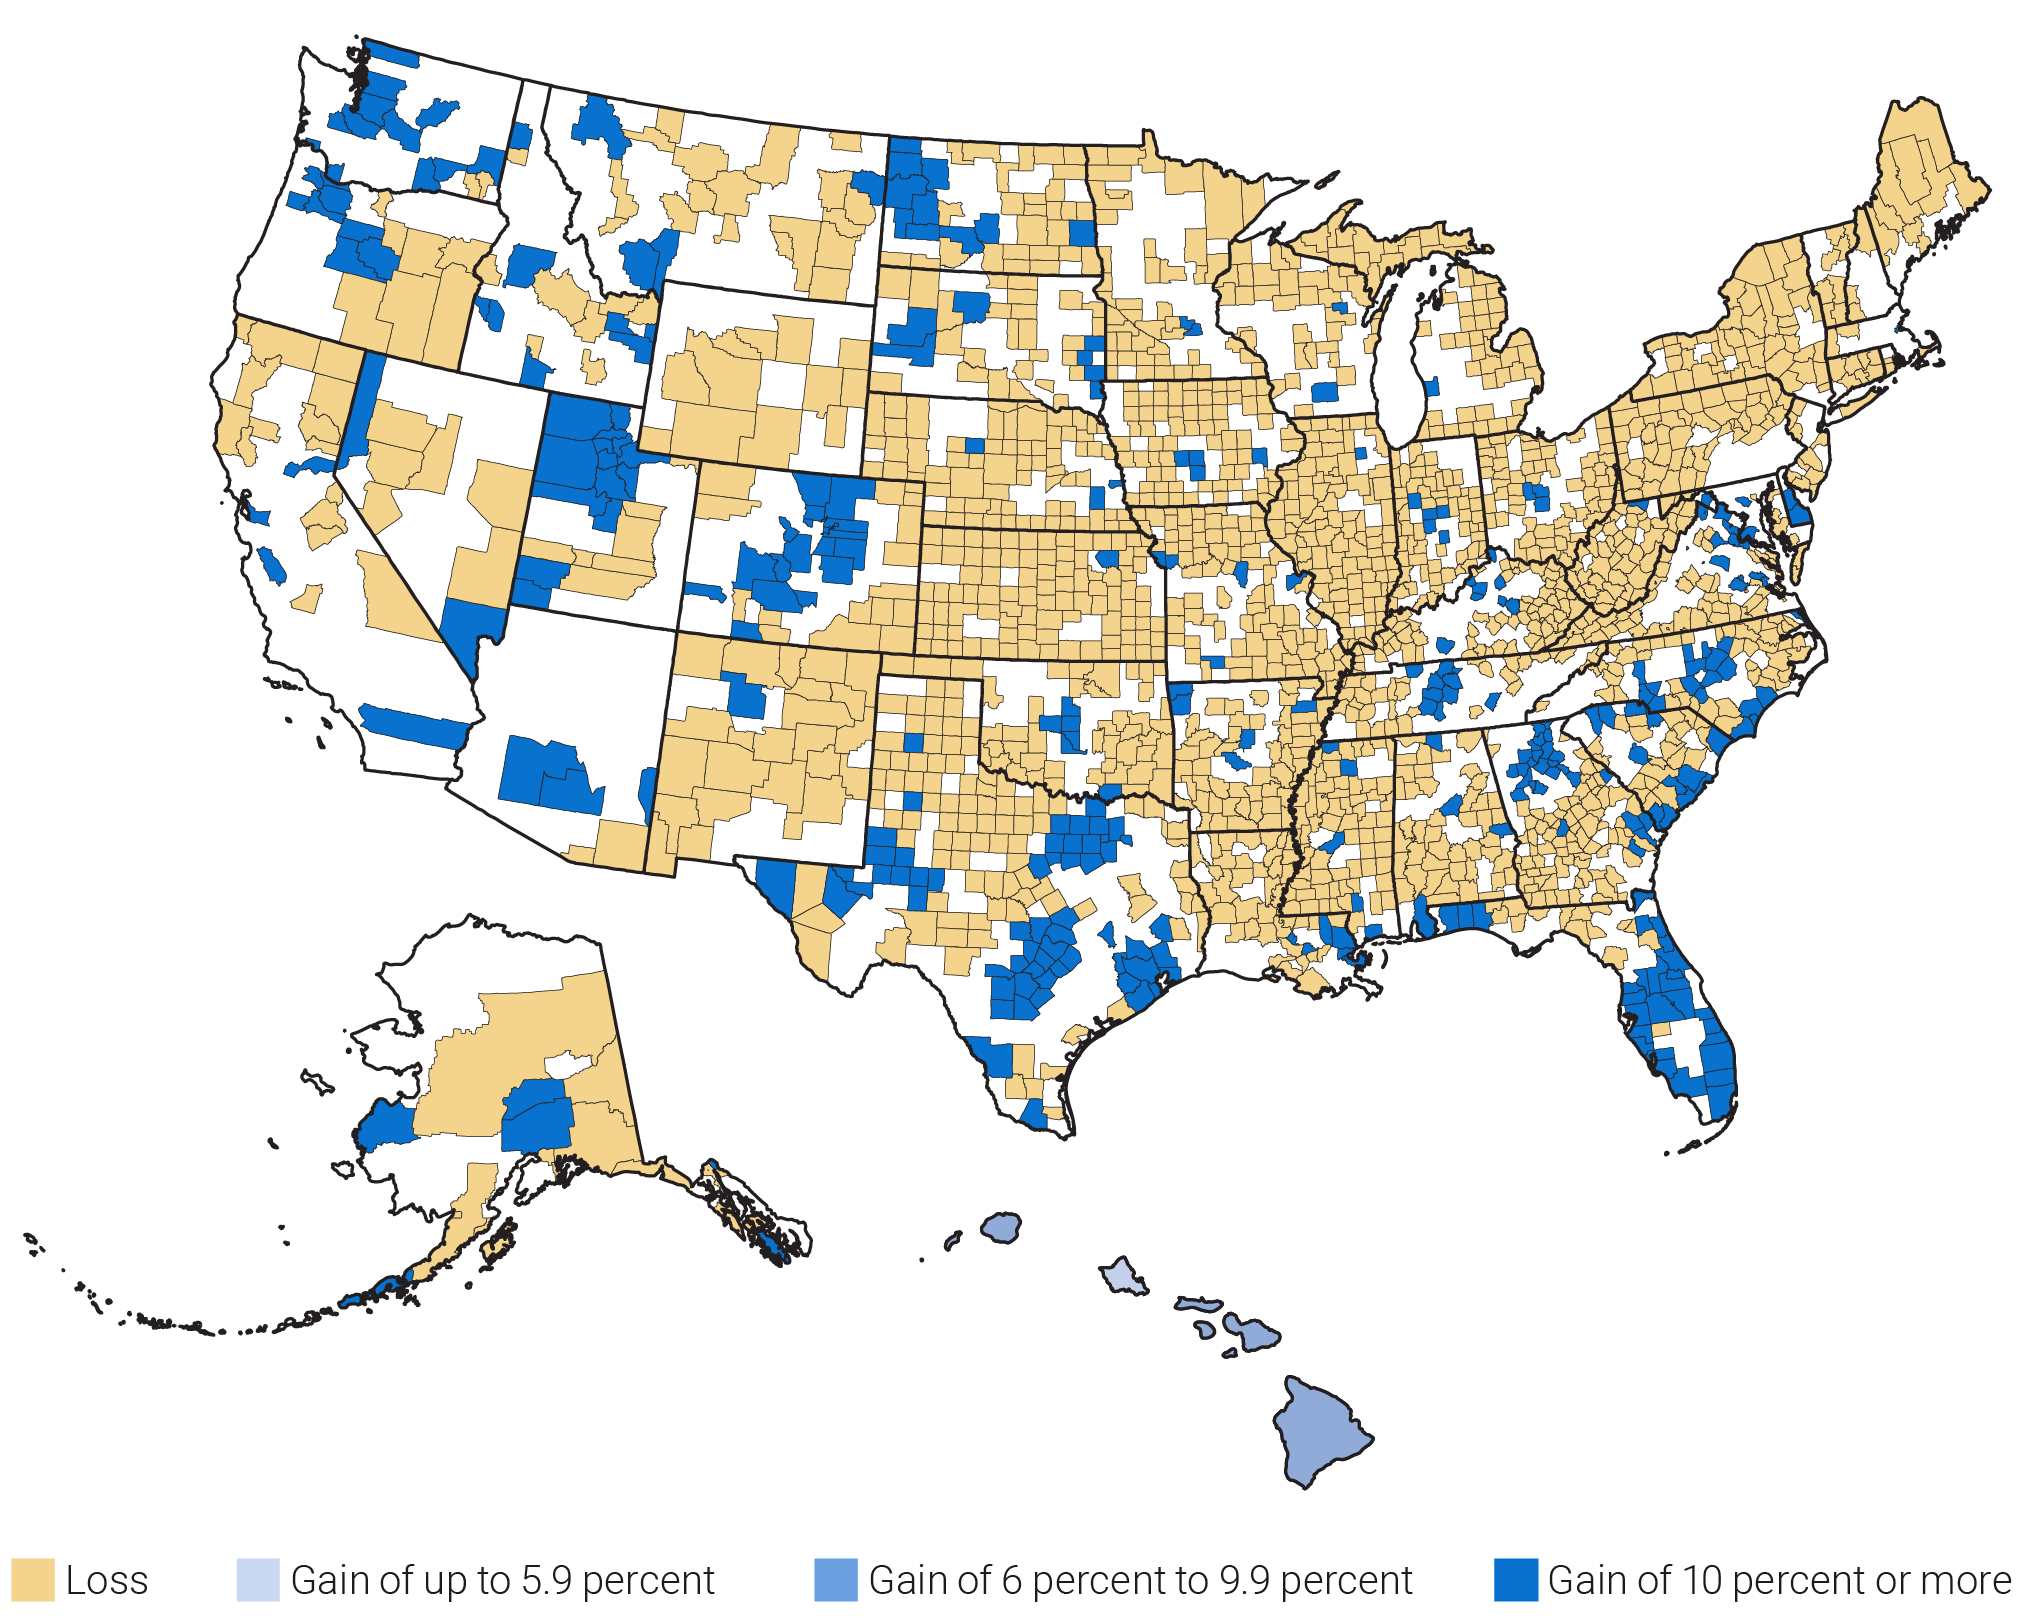
Source: U.S. Census Bureau, vintage 2018 population estimates.
Counties in large metropolitan areas (1 million population or more) saw the largest population gains. As a group, their populations increased 8 percent between 2010 and 2018, and nearly half of them grew faster than the national average.
In contrast, noncore counties—those located outside metropolitan and micropolitan areas—have been the biggest demographic losers since 2010.3 Noncore counties as a group had a net loss of about 2 percent of their population between 2010 and 2018. While noncore counties comprise 42 percent of all U.S. counties, they accounted for 58 percent (967 of 1,656) of the counties that lost population.
Counties with diversified economies and access to recreational activities (entertainment industries or natural amenities) have also fared much better than those dependent on agriculture or manufacturing.
This article is excerpted from Mark Mather et al., “What the 2020 Census Will Tell Us About a Changing America,” Population Bulletin 74, no. 1 (2019).
 ">
">