
5 Counties, 5 Stories of Population Loss
Behind one national trend are very different local realities, and very different paths forward

Key Takeaways
- Population decline is not one story. Communities can shrink because of out-migration, high mortality, low birth rates, or a combination of these forces.
- Who is leaving, and why, matters. The loss of younger adults and families can reshape a community’s age structure and influence its population for years to come.
- Different causes call for different responses. Depending on what is driving decline locally, communities may focus on retaining residents and attracting newcomers by improving health and strengthening the economy or adapting to a smaller population.
Introduction
Population loss is reshaping communities across the United States. News coverage often focuses on shrinking rural areas and falling birth rates, but population loss is not exclusive to rural America and does not always have the same causes. Understanding the unique factors underlying population decline, and distinct contexts it occurs in, is vital for local decision-making.
Fundamentally, population size changes through three mechanisms: births, deaths, and migration. The balance among them determines whether a place’s population grows or shrinks, and that balance varies widely from county to county. In one community, decline may be driven mainly by young adults leaving in search of jobs and opportunity; in another, it may be driven by deaths increasingly outnumbering births. These forces may also offset each other, as when immigration counterbalances loss from other sources. Knowing which processes are at work can help explain why a county is changing and which policy responses will best serve its residents.
Topline population numbers often mask these dynamics. A county may be losing residents overall while still attracting newcomers from abroad, or seeing its population fall because young families are leaving, even as older residents stay. The effect shows up in everyday community life: a school district with fewer students, a grocery store struggling to stay open, a local business that can’t find workers.
Each of the five counties profiled below has lost population in recent years. Together, their stories show why the drivers behind population change matter.
How Populations Change
The following processes interact to produce population growth, stability, or decline:
- Births: A population’s natural source of growth.When births exceed deaths, the population experiences natural increase.
- Deaths: A population’s natural source of decline. When deaths exceed births, the population experiences natural decrease.
- Net migration: The number of people moving into a county (in-migrants) minus the number of people moving out (out-migrants), reflecting both how well a place keeps its existing residents and how well it attracts new ones. Net domestic migration counts moves between a county and other places within the United States, while net international migration counts moves between a county and other countries. Overall net migration combines both domestic and international migration.
Source: U.S. Census Bureau County-Level Components of Change, Vintages 2020 and 2025.
Note: Data reflects population change measured as of July 1st of the prior year (e.g., 2011 data reflects the period from July 1, 2010 to July 1, 2011).
Sharkey County, Mississippi: A Cycle of Leaving, Aging, and Loss
Among U.S. counties with at least 1,000 residents, Sharkey County, Mississippi, saw the second-largest percentage population decline from 2020 to 2025, losing 18.5% of its residents in just five years.1 Two forces worked together: unusually high mortality and a persistent out-migration, particularly among younger residents.234
Falling birth rates are often cited in the media as the cause of population decline, but they do not seem to be driving Sharkey’s recent losses. In fact, the county’s crude birth rate held above the national average from 2020 to 2025.56
Deaths, however, were exceptionally high. Over the same period, Sharkey’s average death rate was 22.8 deaths per 1,000 population, over twice the national average of 9.6 per 1,000.7 The county also had the second highest female mortality rate of deaths from accidents and adverse effects, including accidental drug and alcohol poisonings, of any U.S. county, pointing to an important local source of excess deaths.89
Migration has added to these losses. Every year from 2000 to 2023, more people moved out of Sharkey County than moved in, and those losses were concentrated among people ages 24 and under.10 Incarceration may also play a role in this out-migration. In 2015, Sharkey had the third-highest jail admission rate among Mississippi’s 82 counties. The relationship between incarceration and demographic change may warrant further study, as incarceration may contribute to changes to the remaining age structure of a community through relocation of recently incarcerated individuals to facilities outside their county of origin.
As younger residents have left, the population has grown older.11 Sharkey’s median age rose every year between 2018 and 2025, reaching 44.7 years, about five years older than the national median of 39.4.12 An older population naturally experiences more deaths, though Sharkey’s high mortality reflects factors beyond age, including those discussed above.
The result is a self-reinforcing cycle: Young people leaving makes the population older, an older population experiences more deaths, and those deaths further shrink and age the population that remains. In Sharkey County, population aging is both a consequence of decline and a driver of it.
Source: U.S. Census Bureau County-Level Components of Change, Vintages 2020 and 2025.
Note: Data reflects population change measured as of July 1st of the prior year (e.g., 2011 data reflects the period from July 1, 2010 to July 1, 2011).
Napa County, California: Priced Out of Wine Country
Napa County’s decline began taking shape in the mid-2010s, when net migration turned negative in 2015.13 Since then, more residents have moved out than moved in, and migration has become a growing driver of population loss. From 2020 to 2025, the county lost 3.3% of its population.
This shift has coincided with growing pressures on an economy heavily dependent on wine. In recent years, Napa’s wine industry has faced declining demand, an oversupply of grapes, and falling grape prices. At the same time, local wages have not kept pace with housing costs. Workers are finding it increasingly hard to afford to live in the county, which likely encourages some to leave in search of cheaper places.14
Immigrant residents have been hit hard by these changes. The county’s wine-related manufacturing and farm economies have long relied on immigrant workers, and as of 2019–2023, most of Napa’s foreign-born residents had lived in the county for decades. 15 Yet in most sectors, immigrant workers in Napa earn less than their U.S.-born counterparts. Industry headwinds, high housing costs, and low wages likely help explain why Napa’s immigrant population fell 7% between 2006–2010 and 2019–2023, even as new arrivals from abroad have offset some of the county’s recent losses.
Source: U.S. Census Bureau County-Level Components of Change, Vintages 2020 and 2025.
Note: Data reflects population change measured as of July 1st of the prior year (e.g., 2011 data reflects the period from July 1, 2010 to July 1, 2011).
Wayne County, Michigan: A 75-Year Exodus Shows Signs of Turning
Wayne County, home to Detroit, offers a different version of migration-driven decline. Napa’s shift to negative net migration is relatively recent and can be tied to present-day economic pressures. Wayne County, by contrast, has seen persistent out-migration since at least the 1950s.16 Its population fell 1.4% from 2020 to 2025 and about 3% since 2010. That modest decline was driven overwhelmingly by a long-established pattern of people leaving.17
That pattern centers largely on movement away from the city of Detroit, and its causes are complex. They include:
- The region’s reliance on the auto industry and the loss of manufacturing jobs
- Suburbanization
- Racial discrimination and associated housing policies that fueled “white flight” and residential segregation in the mid-twentieth century
As people have left, the city’s tax base shrank. That brought infrastructural and financial problems that lowered the quality of life for those who remained and likely led more people to leave.
Unlike many shrinking counties, Wayne is not losing residents because of aging or high mortality. Births have outnumbered deaths nearly every year since 2010, and at 38.3 years the county’s median age is below the national median.18 In fact, without out-migration, Wayne’s population would have grown between 2010 and 2025.
Yet, the county also stands out for a recent break from its long pattern of loss. From 2023 to 2025, Wayne recorded positive single-year net migration for the first time since at least 2000.19 Domestic out-migration slowed enough that international migration, long a source of newcomers to the county, pushed overall net migration into positive territory. Efforts to revitalize Detroit’s housing, infrastructure, neighborhoods, and downtown may have also helped attract new residents, encouraged existing residents to stay, or a combination of both, slowing outmigration.
Source: U.S. Census Bureau County-Level Components of Change, Vintages 2020 and 2025.
Note: Data reflects population change measured as of July 1st of the prior year (e.g., 2011 data reflects the period from July 1, 2010 to July 1, 2011).
McDowell County, West Virginia: The Decline of Coal Meets a Health Crisis
McDowell County has experienced one of the most dramatic population declines in the United States over the past several decades, losing a whopping 82% of its population since 1950. Even in the relatively short period from 2020 to 2025, its population fell 11.7%, the most pronounced drop in West Virginia.
McDowell is a rural county in the coal fields of southern Appalachian, where mining and government account for a large share of local jobs.20 As the coal industry declined and economic opportunities shrank, residents steadily left. In recent decades, young adults ages 24 and under have left at the highest rates. For decades, this out-migration was the main driver of population loss.
In recent years, however, a second force has grown. Deaths have stayed high as births have fallen, so that deaths increasingly outnumber births.21 McDowell has the lowest life expectancy in West Virginia, reflecting decades of economic hardship and poor health outcomes.22 From 2019 to 2023, its age-adjusted death rate (14.6 deaths per 1,000) was nearly twice the national average (just under 8 deaths per 1,000). Deaths from accidents and adverse effects, including accidental drug and alcohol poisonings, were more than three times the U.S. average.23
Births, meanwhile, have fallen. Limited public data makes it impossible to tell whether the county’s age-adjusted birth rate has changed. Falling births may partly reflect the loss of younger residents, including women of childbearing age, through decades of out-migration.
McDowell County shows how the drivers of population decline can shift over time. Out-migration has long been central to its story. But the widening gap between deaths and births, shaped by health as much as economics, has become an increasingly important source of loss.
Source: U.S. Census Bureau County-Level Components of Change, Vintages 2020 and 2025.
Note: Data reflects population change measured as of July 1st of the prior year (e.g., 2011 data reflects the period from July 1, 2010 to July 1, 2011).
Newport County, Rhode Island: A Modest Decline Hides a Shrinking Generation
Newport County, Rhode Island, adds yet more nuance to the story of population loss. From 2020 and 2025, this metropolitan county had the fastest population decline among New England counties with at least 1,000 residents, though loss was relatively modest at 3%.24
That topline number hides a much bigger shift that has been occurring over the past few decades in Newport County. Between 1990 and 2020, the number of residents under age 18 fell by 36%. And from 2020 to 2025, the under-18 population fell by 14.5%. Such a pronounced drop in children suggests that population loss may be concentrated among younger residents and families, with implications for the county’s future age structure and population growth.
Housing costs may be part of the explanation. Newport has also been identified as a housing-stressed county, and it had the highest cost of living among Rhode Island counties in 2024. That raises questions about whether housing costs affect the ability of younger adults and families can afford to stay.
Low birth rates are another factor. From mid-2020 Newport County averaged just over 7 births per 1,000 residents,25 well below the national average of 10.8. Its average death rate for the same period, by contrast, was close to the national average (10.1 deaths per 1,000 versus 9.6). In other words, deaths exceed births in Newport mainly because there are so few births, not because mortality is unusually high.26
Domestic out-migration also contributed to population loss, though it has fluctuated since 2010 and slowed in recent years. International migration has also partially offset it, providing an important source of stability in population size.27For example, from 2024 to 2025, domestic migration resulted in a loss of 2.8 residents per 1,000 in the population, while international migration resulted in a gain of 1.3 residents per 1,000. While Newport County still lost residents, the extent of the loss was softened.
Unlike McDowell and Sharkey counties, where high mortality is central, Newport’s decline is driven instead by low birth rates and residents leaving, particularly young people and families, with international migration helping to soften the loss. Newport illustrates how even a modest population decline can signal deeper changes in a community’s age structure—and, in turn, its demographic future.
Conclusion
Topline population numbers tell us how much a community is changing. Understanding what lies behind them can tell us much more about where it is headed and what it may need to prepare for.
Source: U.S. Census Bureau County-Level Components of Change, Vintages 2020 and 2025.
Note: Data reflects population change measured as of July 1st of the prior year (e.g., 2011 data reflects the period from July 1, 2010 to July 1, 2011).
These five counties show that population decline is not one story, but many:
- In Sharkey and McDowell counties, high mortality has become an important part of the demographic picture, even as residents continue to leave.
- In Napa County, strain on the wine industry and high housing costs appear to have accelerated out-migration in recent years.
- In Wayne County, decades of domestic migration have driven decline, but revitalization and international migration may be turning the tide.
- In Newport County, low birth rates and the departure of young families, likely accelerated by high costs of living, are reshaping the population.
Source: U.S. Census Bureau County-Level Components of Change, Vintages 2020 and 2025.
Note: Data reflects population change measured as of July 1st of the prior year (e.g., 2011 data reflects the period from July 1, 2010 to July 1, 2011).
The forces behind these five stories are not unique; they are playing out in different combinations across the country, with consequences that reach well beyond the population count. Who is leaving, and who is arriving? Why are people moving away, and why might others choose not to move in? Are births or deaths changing? And what local conditions—such as jobs, housing, health, or access to services—might be shaping these patterns? Answering these questions can reveal changes that are already reshaping communities and provide a clearer picture of what lies ahead.
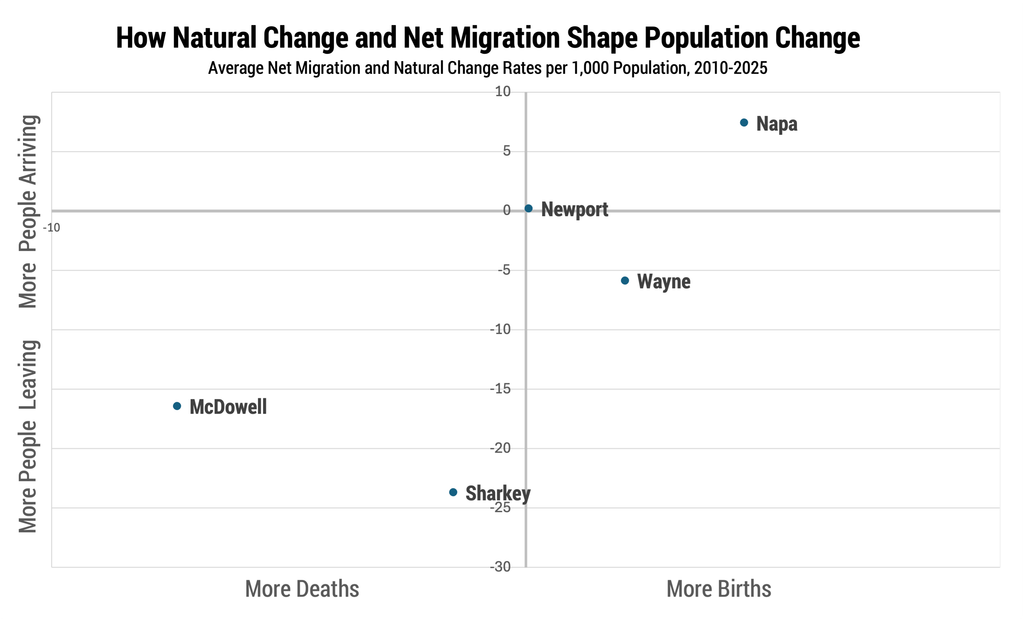
The same outcome—fewer people—can reflect very different underlying realities. These differences matter because there is no single response to population decline, and communities are not impacted by population decline in the same ways. And while population loss may initially strain communities, as the workforce and tax base become leaner, this does not mean that every community should pursue growth at all costs. In some places, reversing long-term decline may be difficult or unrealistic. The more pertinent question may be how communities can adapt to having fewer or older residents while maintaining quality of life and access to essential services, such as education and health care. Understanding what is driving population loss locally is the first step, not only for determining whether decline can be slowed, but also for deciding how communities can respond to the changes already underway.
Footnotes
- [1] Population change from 2020 to 2025 is based on Census Population Estimates for July 1, 2020 and July 1, 2025.
- [2] IRS County-to-County Migration Data 2013-2022.
- [3] U.S. Census Bureau, Population Estimates Components of Change, Vintages 2020 and 2025.
- [4] University of Wisconsin–Madison, 1950-2020 Net Migration Estimates for U.S. Counties
- [5] U.S. Census Bureau, Population Estimates Components of Change, Vintages 2020 and 2025.
- [6] U.S. Department of Health and Human Services, Centers for Disease Control and Prevention, National Center for Health Statistics, Natality Public-Use Data [Natality, 2016-2024 Expanded] using CDC WONDER Online Database. Accessed at https://wonder.cdc.gov/natality.html on August 1, 2026.
- [7] U.S. Census Bureau, Population Estimates Components of Change, Vintages 2020 and 2025.
- [8] National Institute on Minority Health and Health Disparities, HDPulse: An Ecosystem of Health Disparities and Specific Populations Health Resources.
- [9] Data on accidental and adverse effect deaths was not available for males in Sharkey County.
- [10] University of Wisconsin–Madison, 1950-2020 Net Migration Estimates for U.S. Counties
- [11] University of Wisconsin–Madison, 1950-2020 Net Migration Estimates for U.S. Counties
- [12] U.S. Census Bureau, Annual County Resident Population Estimates by Age, Sex, Race, and Hispanic Origin (2010-2020; 2020-2025).
- [13] U.S. Census Bureau, Population Estimates Components of Change, Vintages 2020 and 2025.
- [14] NapaServe, Napa Population 2025.
- [15] Valerie Lacarte, Michael Fix, and Allison Rutland, Rooted in the Valley: Immigrants in Napa Valley’s Communities and Economy, Migration Policy Institute, 2026.
- [16] University of Wisconsin–Madison, 1950-2020 Net Migration Estimates for U.S. Counties.
- [17] U.S. Census Bureau, Population Estimates Components of Change, Vintages 2020 and 2025.
- [18] As of July 1, 2025.
- [19] U.S. Census Bureau, Population Estimates Components of Change, Vintages 2020 and 2025.
- [20] U.S. Department of Agriculture, Economic Research Service, County Typology Codes, 2025 Edition, April 2025.
- [21] U.S. Census Bureau, Population Estimates Components of Change, Vintages 2020 and 2025.
- [22] Sean O’Leary, “A Growing Death Rate Is Outpacing Births and Migration in West Virginia’s Population Trends,” West Virginia Center on Budget and Policy, May 26, 2026.
- [23] National Institute on Minority Health and Health Disparities, HDPulse: An Ecosystem of Health Disparities and Specific Populations Health Resources.
- [24] U.S. Census Bureau, Population Estimates Components of Change, Vintages 2020 and 2025.
- [25] U.S. Department of Health and Human Services, Centers for Disease Control and Prevention, National Center for Health Statistics, Natality Public-Use Data [Natality, 2016-2024 Expanded], using CDC WONDER Online Database. Accessed at https://wonder.cdc.gov/natality.html on August 1, 2026.
- [26] National Institute on Minority Health and Health Disparities, HDPulse: An Ecosystem of Health Disparities and Specific Populations Health Resources.
- [27] U.S. Census Bureau, Population Estimates Components of Change, Vintages 2020 and 2025.
Related Posts
Lesson Plans on Human Population and Demographic Studies
Find out the answers to these questions and more. The sections listed below explore eight elements of population dynamics.

Report. Population Trends and Challenges in the Middle East and North Africa
(2001) The people of the Middle East and North Africa (MENA) have long played an integral, if sometimes volatile, role in the history of human civilization.
Population Trends and Challenges in the Middle East and North Africa
(2001) The people of the Middle East and North Africa (MENA) have long played an integral, if sometimes volatile, role in the history of human civilization.