Shifts, Flips, and Blips: Reflecting on 25 Years of U.S. Population Change
Mark Mather from our U.S. Programs team looks back at key population trends since he joined PRB in 1998

I started work at PRB 25 years ago, on August 3, 1998. A lot has changed since then, and this seemed like an appropriate time to look back at some of the key population trends in the United States over the past quarter century:
Population shifts…
U.S. population growth has slowed dramatically. During the 1990s, the nation’s population increased by an average of 1.3% per year. By 2020, the population was still growing, but at a snail’s pace. The 0.7% percent annual increase between 2010 and 2020 was the second-slowest growth rate between censuses in U.S. history. The growth rate slowed even more in the wake of COVID-related business shutdowns and travel restrictions, to just 0.1% between 2020 and 2021. Higher immigration levels bumped up population growth in 2022 (0.4%), but the rate is still well below the 90s average.
In a related development, the number of older Americans has increased steadily over the past 25 years, and population aging has accelerated since 2011, when the first baby boomers turned 65. Between 1998 and 2022, the share of the U.S. population ages 65 and older increased from 12% to 17%. By 2022, the median age in the country was 38.9, and one-third of states had a median age over 40. Rapid population aging in the United States will contribute to a rise in the number of people living with chronic conditions, including dementia, in the coming decades.
The United States has continued to grow more racially and ethnically diverse. One of the biggest surprises from the 2000 Census results was the rapid growth of the Hispanic/Latino population—from 22 million in 1990 to 35 million by the end of the decade. By 2022, the Latino population had boomed to 63.7 million. The non-Hispanic white population remains the largest racial/ethnic group, but it is shrinking; in 2022, the number of deaths (5.7 million) among this group far outnumbered births (3.8 million).
Population pyramids show the youthfulness of the Latino population relative to non-Hispanic whites. The age structure for the Latino population has a pyramidal shape, with many young people at the base and fewer older adults at the top, while the age distribution of the white population is more cylindrical in shape, with a bulge near the top representing baby boomers.
Figure 1. Younger Latino and Older White Populations Create a Sharp Generational Divide
Age and Sex Distribution of the U.S. Hispanic/Latino and non-Hispanic White Populations (Millions)
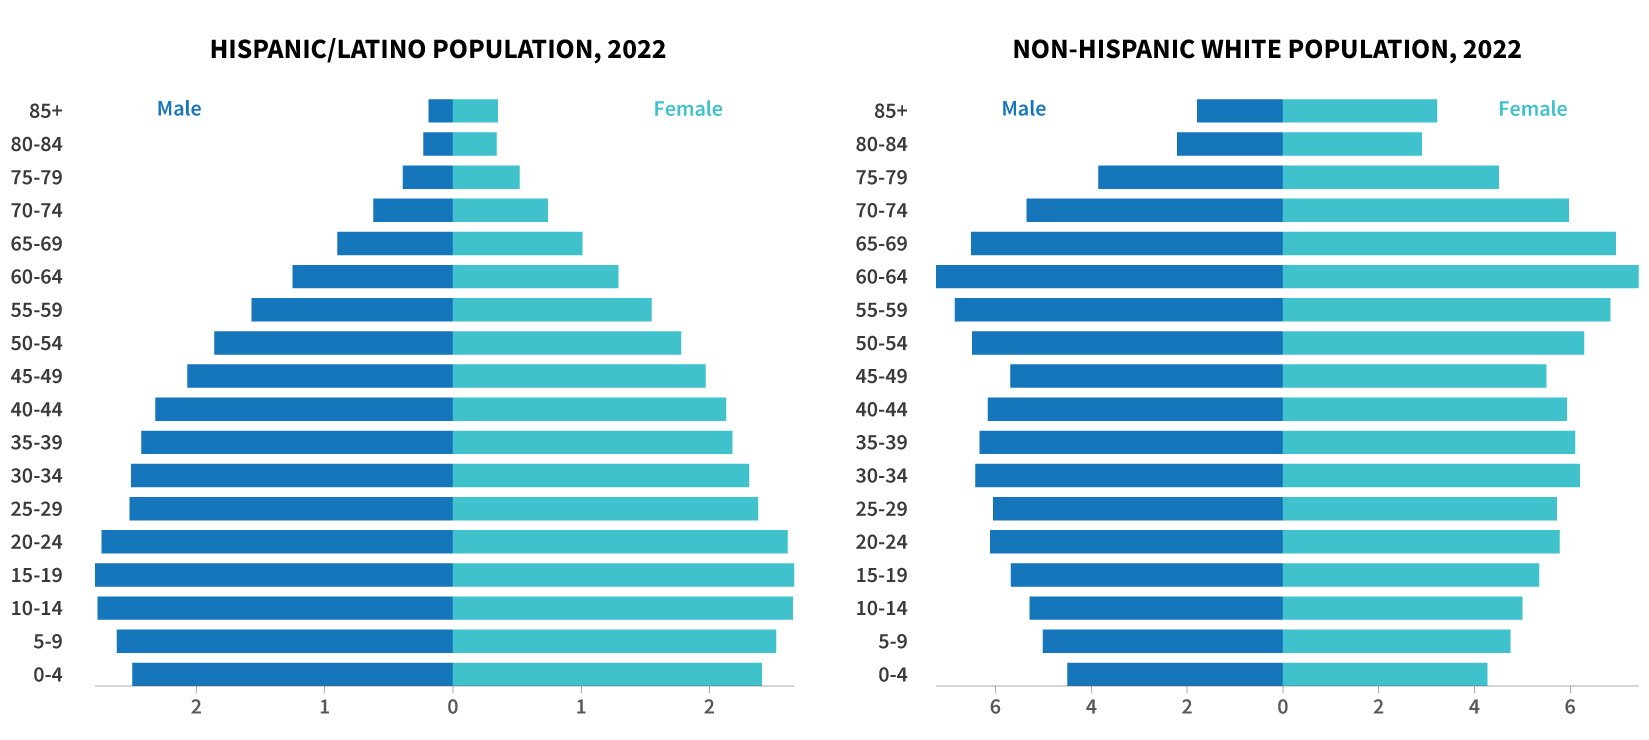
Source: U.S. Census Bureau, Population Estimates Program.
Flips…
COVID-19 contributed to the largest two-year drop in U.S. life expectancy in nearly 100 years, from 78.8 years to 76.1. But life expectancy in the United States was already lagging behind other high-income countries well before the pandemic, partly because of the large number of preventable deaths among America’s children, young adults, and working-age adults.
The U.S. population has also continued to shift South and West over the past quarter century, and Texas has replaced California as the state with the largest population gains. While Texas had a net increase of nearly 800 thousand people between 2020 and 2022, California’s population declined by nearly half a million people during the same period. This is a sharp reversal from patterns 25 years ago; between 1998 and 2000, California had a net gain of 1 million people. Recent population losses in California are linked to a decline in international migration, COVID-19 deaths, and people moving to other states—often for financial reasons, according to researchers at the Public Policy Institute of California. Several other states, including Arizona, Florida, and Georgia, grew rapidly during both periods, and Florida passed New York as the nation’s third-largest state in 2014.
Figure 2. California’s Population Boom Goes Bust
U.S. Population Change in Five States, 1998 to 2000 and 2020 to 2022 (Thousands)
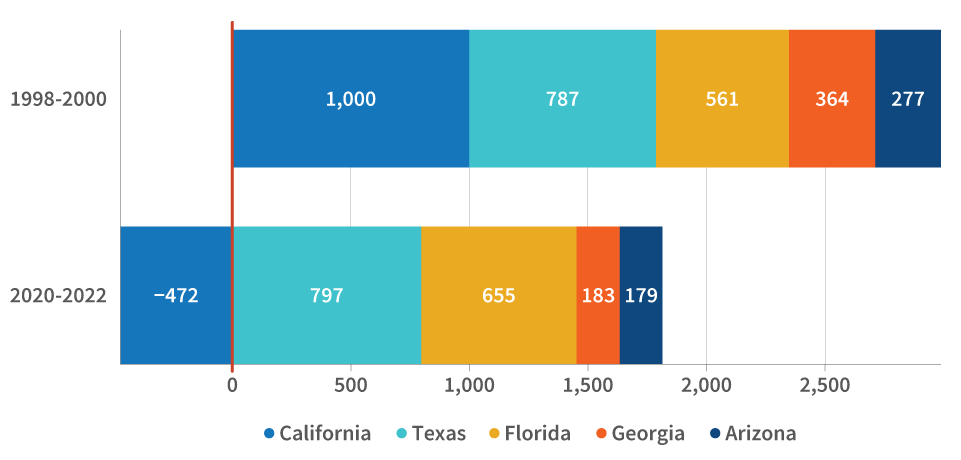
Source: U.S. Census Bureau, Population Estimates Program.
State population rankings are important not just for bragging rights, but also because they affect the distribution of political power across the nation; seats in the U.S. House of Representatives are apportioned based on population size. Since 1998, Texas has gained eight House seats, Florida has gained five, and New York has lost five.
And Blips…
Some speculated that the coronavirus pandemic would lead to a baby boom, with so many couples stuck at home due to social distancing requirements. But the data suggest otherwise. Fertility rates in the United States have declined during previous economic downturns, and the COVID-19 lockdown was no exception.
The U.S. total fertility rate (TFR), or average number of lifetime births per woman, hovered at around 2 between 1998 and 2006, before it took a downward turn. By 2020, the U.S. TFR had dropped to 1.64, the lowest level ever recorded in the country.
In 2021, the TFR rebounded slightly, to 1.67, and PRB fielded calls from journalists asking if the data signaled a COVID baby boom. Our answer was always either no, or it’s too soon to tell. The reason is that the fertility patterns are shaped by broader social trends in the country, including postponement of marriage and childbearing and long-term increases in women’s educational attainment and labor force participation. By 2016—for the first time in U.S. history—the birth rate among women ages 30 to 34 (103 births per 1,000 women) exceeded that of women ages 25 to 29.
We’ll have to wait and see if the recent baby bump continues in 2022, but another baby boom—like the one from 1946 to 1964 that defined a generation—is unlikely to occur anytime soon.
Looking Ahead to the Next 25 Years
Demographers develop population projections by looking at recent data to make assumptions about future birth, death, and migration patterns. But there are some things, like the COVID-19 pandemic, that we can’t predict and that have implications for population growth.
To illustrate this point, in 2017, the Census Bureau projected the U.S. population would grow to 339.7 million by July 1, 2023. But the actual 2023 U.S. population, according to the Census Bureau’s latest estimates, is 335.0 million.
During the next 25 years, the U.S. population will continue to change in ways we cannot predict. One important factor to watch, though, will be immigration, which slumped during the COVID-19 shutdowns. Immigration recently rebounded to pre-pandemic levels, but may not be robust enough to sustain future population growth. Half of all states and nearly three-fourths of counties had more deaths than births between 2020 and 2021—a pattern indicative of an aging population.
While a declining population is not necessarily bad, policies should address the potential negative impacts, and immigration policies could be a starting point. For example, the slowed growth of America’s working-age population is contributing to labor shortages at the same time that an aging population is demanding more from a shrinking pool of caregivers. Thoughtful immigration policy designed to increase the number of care workers in the United States, even temporarily, could help avert a caregiving crisis in the future.
Thus, we sit at a demographic crossroads. Policymaking may determine the trajectory of the U.S. population in the next 25 years and how successfully we adapt to an unpredictable future of shifts, flips, and blips.
Related Posts
Understanding and Comparing Population Projections in Sub-Saharan Africa
The release of a new set of population projections by the Institute for Health Metrics and Evaluation (IHME) in July 2020 was greeted with extensive coverage in the media and stimulated fresh debate among demographers about calculation and communication of projections.