Linda A. Jacobsen
Senior Fellow

With the number of coronavirus infections surging, school districts across the United States are grappling with decisions about whether and how to re-open this fall. For online learning to be effective, students need access to computers and high-speed internet access, but a new analysis and interactive dashboard by PRB show sharp digital and economic divides among school-age children across states and between racial and ethnic groups.
In 2018, roughly 10% of U.S. children ages 5 to 17 did not have a computer—desktop, laptop, or tablet—at home, and 23% did not have home access to paid high-speed internet.1 Fully one-fourth of all school-age children were lacking either a computer or high-speed internet. Children without computers or high-speed internet at home were already at an educational disadvantage before the COVID-19 pandemic due to the growing need for students to access resources and submit assignments online. Many relied on computers and internet access at school or a local library to complete their work. As the pandemic prompted libraries to close and schools across the country shut down and moved to online instruction, this digital divide has become even more critical.
A racial and ethnic digital divide also persists. Half of all American Indian/Alaska Native children lack either computers or paid high-speed internet access (or both) at home (see Table 1). More than one-third of Black and Latinx children lack computers or high-speed internet at home, compared with only one-fifth of non-Hispanic white children and one in seven Asian/Native Hawaiian and Other Pacific Islander (NHOPI) children.
Economic barriers contribute to the digital divide between racial and ethnic groups. Poverty rates range from 10% among non-Hispanic white children ages 5 to 17 to 31% among Black children. American Indian/Alaska Native and Latinx children also have poverty rates far above the national average of 17%.
Black, American Indian/Alaska Native, and Latinx school-age children are two to three times more likely to live in households receiving Supplemental Nutrition Assistance Program (SNAP) benefits than white or Asian/Native Hawaiian and Other Pacific Islander children. Nearly 40% of Black and 35% of American Indian/Alaska Native school-age children live in households receiving SNAP benefits. Children whose households receive SNAP benefits are automatically eligible to receive free meals at school—which provide an essential source of daily nutrition for many of these children. With schools shut down, children of color whose families live in poverty and receive SNAP benefits are at much greater risk of going hungry and not receiving the nutrition they need during the pandemic.
Digital and Economic Divides of Children Ages 5 to 17 by Race and Ethnicity, 2018
| wdt_ID | Racial or Ethnic Group | Lacks Computer, High-Speed Internet Access, or Both | Family Income Below 100% of Poverty | Household Receives SNAP Benefits |
|---|---|---|---|---|
| 1 | American Indian/Alaska Native | 50 | 30 | 35 |
| 2 | Black | 36 | 31 | 39 |
| 3 | Hispanic or Latino | 34 | 25 | 28 |
| 4 | White | 20 | 10 | 12 |
| 5 | Asian/NHOPI | 14 | 11 | 11 |
| 6 | Two+ Races | 19 | 16 | 23 |
| 7 | All Children | 25 | 17 | 21 |
Nearly half (47%) of school-age children who live in poverty and 43% of those who receive SNAP benefits lack access to either computers or high-speed internet, compared with only 21% of children who do not receive SNAP benefits and whose family incomes are above the poverty line.
Within every racial and ethnic group, the share of school-age children without access to computers or high-speed internet is much higher for those who receive SNAP benefits and those who live in poverty (see Figure 1). While half of all American Indian/Alaska Native children lack access to computers and high-speed internet, this share jumps to 61% for those receiving SNAP benefits and nearly 70% among those living in poverty. Among non-Hispanic white children, the share without access to computers and high-speed internet nearly doubles from 20% to 39% for those receiving SNAP benefits and from 20% to 41% for those in poverty. Lower levels of economic well-being are widening racial and ethnic gaps in access to computers and high-speed internet.
Percent of Children Ages 5 to 17 in Different Racial/Ethnic Groups Lacking Access to Computers or High-Speed Internet by Poverty Status and Receipt of SNAP Benefits, 2018
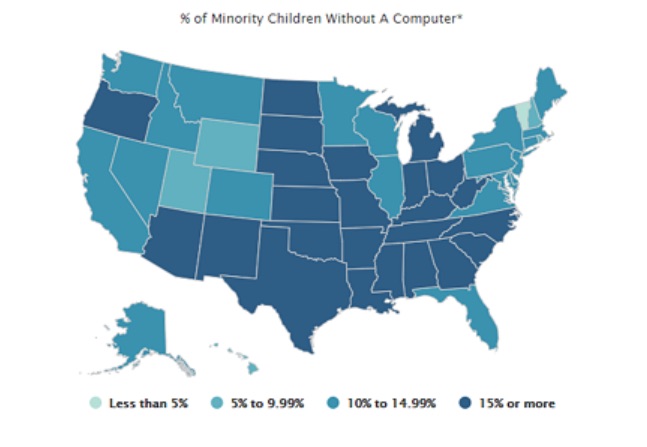
States vary widely in their shares of school-age children without access to computers and high-speed internet, from a low of 13% in New Hampshire to a high of 46% in Mississippi. In eight states—Alabama, Arkansas, Louisiana, Mississippi, New Mexico, Oklahoma, Tennessee, and Texas—more than 30% of children lack either or both computers and internet access, but this count rises to 31 states (including the District of Columbia) for minority children. More than half of school-age minority children in Mississippi, Arkansas, and South Dakota lack access to computers and high-speed internet at home.2
The economic divide is also present in every state. Twelve states (including the District of Columbia) have more than 20% of children ages 5 to 17 living in poverty, and 24 states (including the District of Columbia) have more than 20% of school-age children living in households receiving SNAP benefits. Concentration of poverty and SNAP receipt among school-age minority children is much higher than among non-minority children and is widespread across states. There are only 10 states where the share of minority children living in poverty drops below 20% and only three states (Utah, Vermont, and Wyoming) where the share in households receiving SNAP benefits falls below 20%. Conversely, nine states (Alabama, Arkansas, Louisiana, Mississippi, Ohio, South Carolina, South Dakota, Tennessee, and West Virginia) have one-third or more of minority school-age children living in poverty, and 22 states have more than one-third living in households receiving SNAP benefits.
Digital and economic divides among school-age children are linked to differences in reading and mathematics proficiency levels across states and between racial and ethnic groups. Proficiency in reading by the end of third grade is an important marker of overall educational development but, beginning in fourth grade, it is also essential for learning other subjects and keeping up academically.3 Children who reach fourth grade without being able to read proficiently are more likely to drop out of high school—reducing their earnings potential and chances for success.4 Similarly, proficiency in mathematics fundamentals makes college attendance and completion more likely, which increases earnings potential.5
In 2019, a shocking two-thirds of all fourth graders in the United States scored below the proficient level in reading, as did two-thirds of eighth graders in math. However, these shares are much higher among children in the racial and ethnic groups with the highest levels of poverty and receipt of SNAP benefits, and the least access to computers and high-speed internet (see Figure 2).
Reading and Math Proficiency of Children by Race and Ethnicity, 2019
Among Black and American Indian/Alaska Native students, at least 80% of fourth graders scored below the proficient level in reading, and 85% or more of eighth graders scored below the proficient level in math. More than three-quarters of Latinx fourth graders scored below the proficient level in reading and math in 2019. With higher levels of economic well-being and access to computers and high-speed internet, the shares of non-Hispanic white and Asian/Native Hawaiian and Other Pacific Islander children scoring below the proficient level in reading and math are much lower. These gaps in basic reading and math skills make it hard to envision how today’s children can become tomorrow’s productive workers in a globally competitive economy. In outlining his education policy in 2009, President Barack Obama argued that “The relative decline of American education is untenable for our economy, it’s unsustainable for our democracy, and it’s unacceptable for our children—and we cannot afford to let it continue.”6
States also vary widely in reading and math proficiency levels. For example, the share of fourth graders who scored below the proficient level in reading ranged from a low of 55% in Massachusetts to a high of 76% in New Mexico, while at least seven out of 10 children scored below proficient in reading in eight states. The share of eighth graders who scored below proficient in math ranged from a low of 53% in Massachusetts to a high of 79% in New Mexico, while at least seven out of 10 eighth graders scored below the proficient level in math in 17 states in 2019.
The low levels of proficiency in reading and math among children of color are even more concerning given the fact that minorities make up a growing share of the school-age population. The share of school-age children who are members of a racial or ethnic minority ranges from a low of 7% in Vermont to a high of 80% in the District of Columbia. Among minority students, only two states—Hawaii and Vermont—had fewer than seven out of 10 fourth graders who scored below the proficient level in reading. However, no states had fewer than seven out of 10 minority eighth graders who scored below proficient in math. For example, nearly half (48%) of school-age children in Louisiana belong to a racial or ethnic minority group, and 84% of minority fourth graders scored below proficient in reading while 88% of minority eighth graders scored below proficient in math. Taken together, roughly 40% of all fourth and eighth graders in Louisiana had already fallen behind academically even before the COVID-19 pandemic hit and schools closed.
As schools shut down in spring 2020, some districts like Los Angeles Unified tried to address the digital divide by distributing laptops to all students who needed them. In addition, some districts provided internet access to students without it by distributing hot spots or data plans. However, these solutions were not economically feasible in many districts serving low-income communities of color such as Prince George’s County Public Schools in Maryland. With 10 of the 15 largest school districts already deciding to begin the new school year online as of early August, reducing the digital divide and providing free and reduced-price meals for children who need them has become a daunting challenge across the country.
Unemployment rates remain at record highs, and with the supplemental $600 unemployment payments ending and Congress unable to agree on a new stimulus package, poverty levels and demand for SNAP benefits are both likely to rise this fall. A growing economic divide may further exacerbate the digital divide among school-age children, putting even more students at risk of falling further behind.
 ">
">