New KIDS COUNT Report Introduces State Scores—and Reveals Wide Gaps in Children's Well-Being
Education scores have fallen in 47 states since the pandemic, even as child poverty and teen birth rates decline

The Annie E. Casey Foundation’s annual KIDS COUNT® Data Book has ranked states on child well-being for 37 years. This year, for the first time, it gives them a score—revealing dramatic gaps in progress since before the pandemic.
The new scores show a nearly 600-point spread between the lowest- and highest-performing states, from 271 in Mississippi to 838 in New Hampshire (see Figure 1). They also highlight longstanding geographic disparities: Eleven of the 15 lowest-scoring states are in the South, while five of the seven highest-scoring are in the Northeast.
Figure 1. State Scores for Overall Child Well-Being, 2026
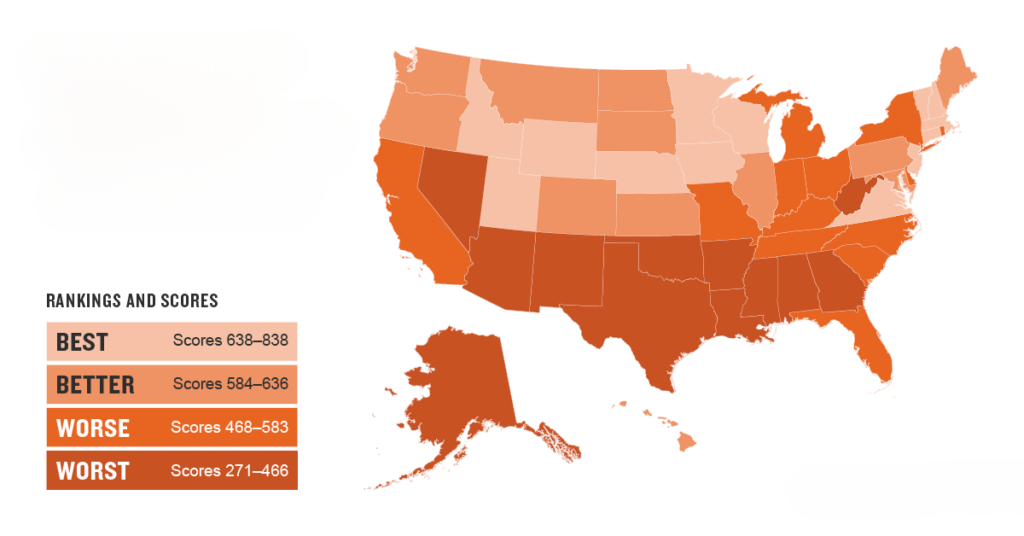
Source: Annie E. Casey Foundation, 2026 KIDS COUNT Data Book: State Trends in Child Well-Being, 2026.
The U.S. earns 547 points overall, holding relatively stable since 2019 and masking significant variation at the state level. In 29 states, children are faring worse, with education losses driving much of that decline. Forty-seven states saw worse education scores, with the steepest drops in North Dakota, Maine, Delaware, Iowa, and Oklahoma (see Figure 2). Only Louisiana and Mississippi saw improvement in this area, a bright spot for two of the lowest-scoring states overall.
Figure 2. State Scores for Education, 2026
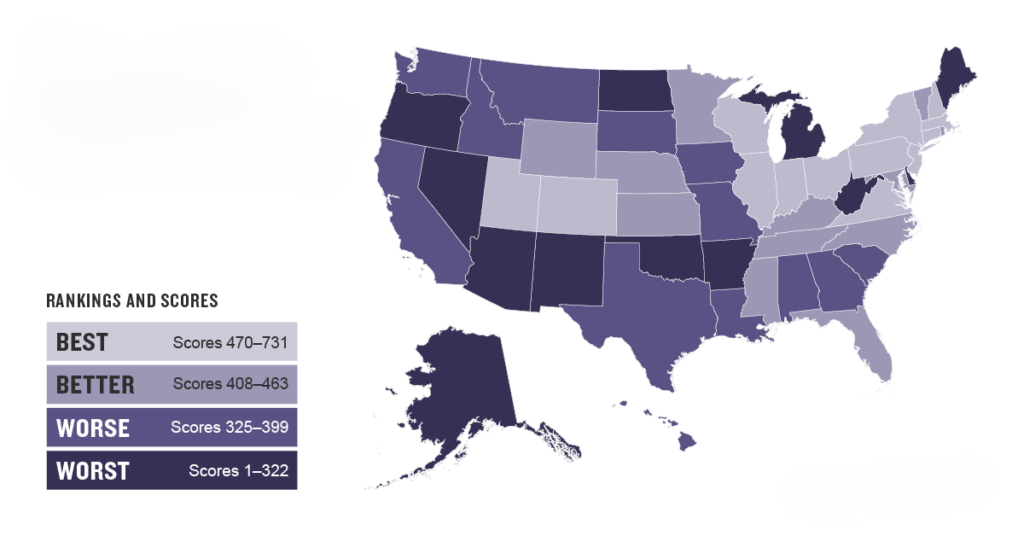
Source: Annie E. Casey Foundation, 2026 KIDS COUNT Data Book: State Trends in Child Well-Being, 2026.
How the Scores Capture Child Well-Being
Working with PRB, the Casey Foundation developed the new 0-to-1,000 scores to complement their longstanding state rankings, using 2019 as a pre-pandemic baseline. The numeric scores allow states to measure whether conditions are actually improving within their borders over time, as well as the size of gaps between states.
The KIDS COUNT index draws on the latest federal data for all 50 states, looking at 16 indicators in health, education, economic well-being, and family and community. Higher scores indicate better outcomes; a score of 1,000 reflects the best performance observed across states in 2019, not a finish line.
Nationally, education fares the worst at 417 points. Family and community leads at 608 and is the clearest bright spot—45 states have improved and none have declined (see Figure 3). Economic well-being sits at 557, with 29 states improving and 13 declining. Health, at 607, is also trending downward.
Figure 3. State Scores for Family and Community, 2026
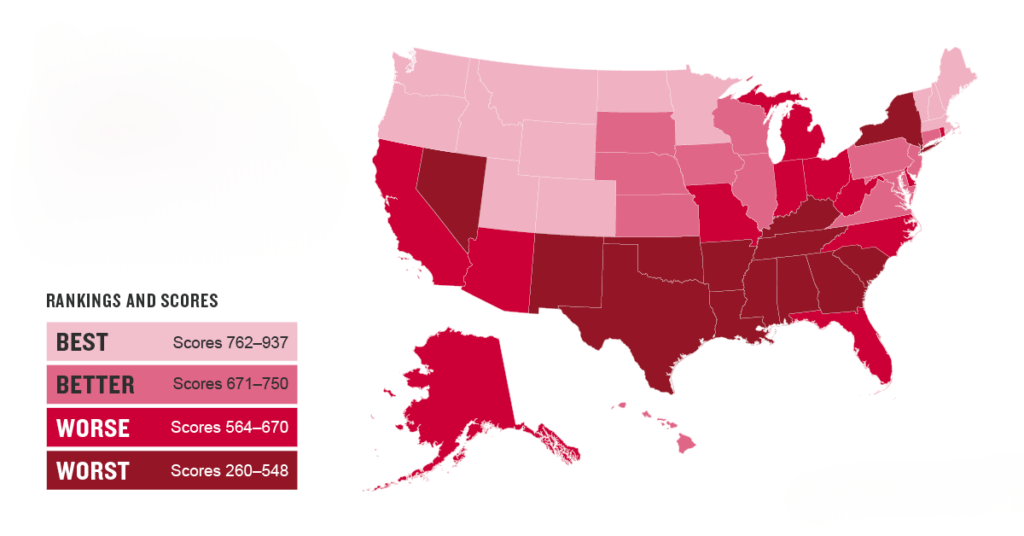
Source: Annie E. Casey Foundation, 2026 KIDS COUNT Data Book: State Trends in Child Well-Being, 2026.
A Mixed Picture Beyond the Scores
Some national trends are genuinely encouraging. Teen birth rates have fallen 24% since 2019 and are down nearly 80% since 1990. Child poverty has declined to 15%, and about 1.3 million fewer children are living in high-poverty neighborhoods than five years ago. More children are living with securely employed parents and with household heads who have at least a high school diploma.
But progress has been uneven, and data disaggregation shows enduring disparities by race and ethnicity. Black children and American Indian or Alaska Native children face poverty rates roughly twice the national average. American Indian or Alaska Native children are doing worse than average on 15 of 16 indicators. Poverty rates for Asian and Pacific Islander children range from 5% for Asian Indian children to 28% for Burmese children.
The Importance of Federal Data
All 16 indicators in the KIDS COUNT index are drawn from federal sources, including the U.S. Census Bureau, the Centers for Disease Control and Prevention, and the U.S. Department of Education. The 2026 Data Book highlights how cuts to data collection, staffing, and funding at federal agencies put this infrastructure at risk, endangering both the report and the policy decisions it informs.
PRB staff have contributed to the KIDS COUNT Data Book since its launch in 1990, providing expertise in index design, data collection, and analysis. This year, PRB’s Alicia VanOrman, Nathan Porter, and Nurfadila Khairunnisa led development of the updated scoring methodology.
Download the full report here. Explore state profiles and additional indicators through the KIDS COUNT Data Center and read more about the new methodology.
Related Posts
As Dementia Rises, More Older Americans Are Getting Care at Home. It's Not Without Challenges.
Families face the financial burden of paying out-of-pocket for care not covered by Medicare and Medicaid and the emotional toll of day-to-day caregiving.

Webinar: How Women Became America’s Safety Net (PRB Book Talk)
A conversation with author Jessica Calarco on her new book, Holding It Together

The Demography of Dementia and Dementia Caregiving
Dementia is one of the nation’s most expensive old-age health conditions and the most time consuming for family caregivers.

Family Caregiving for Older People
(2016) In the United States, the vast majority of care that allows older people to live in their own homes is provided by family members who do not receive pay for their services.