2014 World Population Data Sheet
This year’s data sheet provides detailed information on 16 population, health, and environment indicators for more than 200 countries, and has a special focus on “Progress and Challenges.”
Explore Data Visualizations and Data Sheet
For three of the indicators—infant mortality, total fertility rate, and life expectancy—we have included data from 1970 and 2013 to show trends over time. The environment indicator—carbon emissions—shows data from 1990 and 2012.
We have updated world population by region and country (see Regional Highlights below). We have highlighted examples of the incredible achievements over the last several decades: the proportion of people living in poverty has declined, infant mortality has dropped remarkably, and fewer mothers are dying in childbirth. But progress has been uneven. Pockets of high infant and maternal mortality persist within many countries, and there are still more than 1 billion people living in extreme poverty.
This summer, the United Nations community is discussing the “post-2015 Development Agenda,” a global framework setting goals on sustainable development and poverty eradication that will replace the Millennium Development Goals. See progress thus far on a few of these goals.
World Population
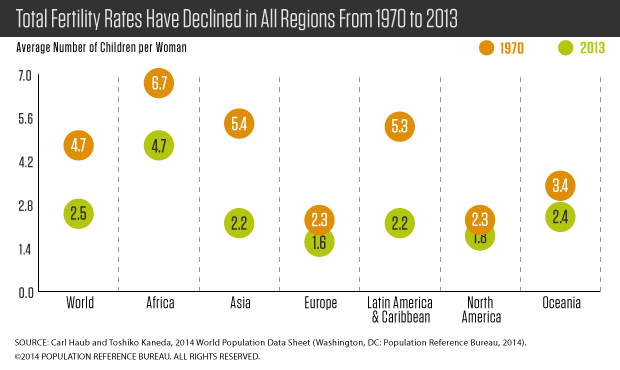
In much of the developing world, demographic change has contributed to economic growth and reductions in poverty. Over the last 40 years, women are having fewer children, from 4.7 children per woman in 1970 to an average of 2.5 children today. Total fertility rates (TFRs) range from 1.1 in Taiwan to 7.4 in Niger.
In 1970, just under one-half (48 percent) of the world’s population was younger than 20, a nearly equal percentage was ages 20 to 64, and only 5 percent was 65 and older. Today, as a result of lower fertility rates and longer life expectancy, the share of global population under age 20 has dropped to about 35 percent, the population between ages 20 and 64 represent 58 percent, and ages 65 and older represent 7 percent. Asia, Latin America, and Oceania all have population age structures similar to the global averages. In 1970, Europe and North America were similar to the world average today, and their slower growth has resulted in a current population much older than the global average. Africa’s population is at the other end of the age spectrum—Africa’s current youthful age structure is much like the global average in 1970.
World population is expected to rise from 7.2 billion today to 9.7 billion by 2050, and virtually all this future growth will be concentrated in the world’s less-developed countries, especially in Africa.
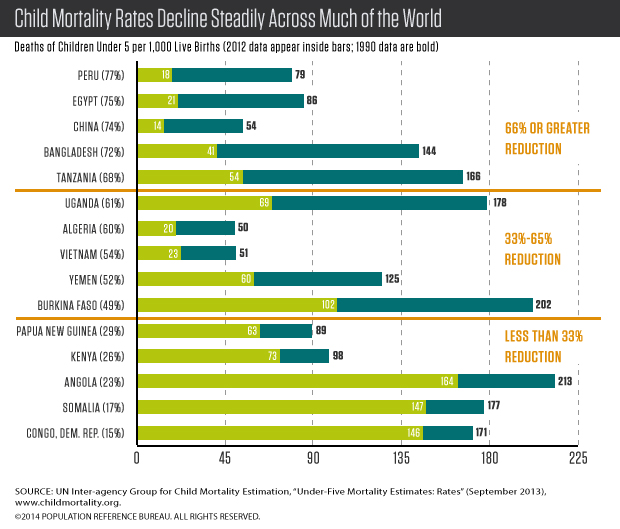
Child Mortality
The child mortality rate is the number of deaths of children under 5 per 1,000 live births. The United Nations set a target for Millennium Development Goal 4: to reduce by two-thirds, between 1990 and 2015, the under-5 mortality rate. Across the globe, many countries have made significant progress in reducing child mortality. For example, child mortality in Bangladesh declined from 144 child deaths per 1,000 live births to 41, a reduction of 72 percent. The global rate in 2012 was almost one-half its 1990 rate, declining from 90 deaths per 1,000 live births to 48 in 2012. Despite these gains, many countries will fall short of the MDG target, and further progress is needed across much of sub-Saharan Africa and South Asia.
Maternal Mortality
The maternal mortality ratio is the number of maternal deaths per 100,000 live births. Globally this ratio dropped from 380 deaths to 210 deaths per 100,000 live births between 1990 and 2013. Some countries have made remarkable progress. For example, maternal mortality in Rwanda declined from 1,400 maternal deaths per 100,000 live births to 320, a reduction of 77 percent. Even with these drops, many countries have not yet met the UN target for Millennium Development Goal 5: to reduce, by three-quarters, between 1990 and 2015, the number of maternal deaths. While the ratio has declined rapidly in some countries, many others have made insufficient progress. The ratio for all developing countries is 14 times higher than for developed countries: 230 maternal deaths per 100,000 live births vs. 16, and further efforts are needed to end these preventable maternal deaths.

Environment
Creating sustainable economic development to meet human needs without sacrificing the environment is challenging. The great strides made over the last 40 years have come at a cost to the environment. Many indicators of the planet’s health have continued to decline, with further losses of biodiversity and little progress in reducing emissions and slowing climate change.
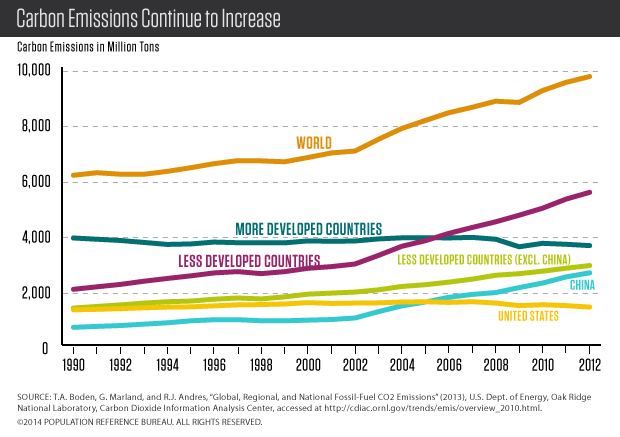
Carbon emissions continue to increase for the world. Since 1990, global carbon emissions increased more than 50 percent. Emissions in the United States and other developed countries remain very high. The growth in emissions in China and the less developed countries is particularly striking and has been one of the unfortunate consequences of the incredible economic and human development progress.
Regional Highlights
Africa
By 2050, Africa is projected to increase to 2.4 billion from 1.1 billion today, making it the region with the largest population growth. But this projection should be treated very cautiously, because it assumes that birth rates will decline smoothly in all African countries in much the same way as birth rates declined in other regions. And that assumption, in turn, assumes that the effective use of family planning will spread in Africa. In most countries, declines in birth rates have been very slow or even nonexistent. And even with declining birth rates, sub-Saharan Africa’s population will continue to grow at a fairly rapid pace after 2050 as it will still be quite youthful.
Asia
Asia is home to 60 percent of global population. China and India account for more than half of Asia’s total population. China’s total fertility rate is a very low 1.6 children per woman. It is hard to predict how much impact the relaxing of its strict “one-child” policy in 2013 will have on China’s population. In India, the TFR has fallen from about 5.5 children in 1970 to 2.4 today. But doubts about the future course of the birth rate in India’s heavily populated and impoverished northern states make projections challenging. Nonetheless, India is projected to pass China in population size in about 15 years, becoming the world’s most populous country, about 1.5 billion people.
Latin America/Caribbean
Population growth has been in slow decline in this region, largely due to a lower birth rate in Brazil and Mexico, the two countries that account for more than half of the region’s population. In Brazil, women average 1.8 children, while in Mexico the average is about 2.2. Among developing regions, Latin America/Caribbean has the highest prevalence of family planning at 73 percent for all methods and 67 percent for modern methods among married women. The region’s population is projected to increase from 618 million today to 773 million in 2050. Approximately three-quarters of a million people (on a net basis) leave the region for North America and Europe each year.
North America
The United States and Canada have rather low TFRs: Canada at 1.6 and the United States at 1.9. In the United States, fertility declined during the recent economic recession, a decline that was especially sharp among Hispanics. Immigration is a significant engine of population growth in both countries.
Europe
Europe’s birth rate has plummeted to an unexpectedly low level in the past few decades. Europe’s population of 740 million is projected to decrease to 726 million by 2050, but even that lower number depends on whether immigration helps to stall a more-rapid decline. Today, women in Europe average only 1.6 children, compared to 2.3 in 1970. This low fertility has created unprecedented aging. In Europe, only 16 percent of the population is below age 15. Compare that to 41 percent in Africa and 25 percent in Asia. Europe’s population ages 65 and older is projected to rise to 27 percent by 2050.
Oceania
In Australia and New Zealand, continued growth from higher birth rates and immigration is expected. Australia’s TFR is 1.9; New Zealand’s, 2.0. Australia’s population of 24 million is expected to increase to 36 million by 2050; New Zealand’s population will increase from 4.3 million to 5.5 million.
Related Posts
Family Planning and the Gendered Impacts of Crises on Women: An Effective Tool Across Sectors to Support Women’s Empowerment and Build Resilience to Shocks
Holistic integrated solutions are key to address the interlinkages of the gendered impacts of crises.
Research Identifies New Strategies to Reduce Undercount of Young Children in U.S. 2020 Census
PRB identifies factors predicting where children under age 5 are more likely to be missed in the 2020 Census and develops a new undercount risk measure for young children.

Lesson Plans on Human Population and Demographic Studies
Find out the answers to these questions and more. The sections listed below explore eight elements of population dynamics.

Health Sector Reform: How It Affects Reproductive Health
(June 2003) Many less developed countries are reforming their health systems in an effort to achieve public health goals more affordably and effectively.
Report. Health Sector Reform: How It Affects Reproductive Health
This report also in French and Spanish. (June 2003) Many less developed countries are reforming their health systems in an effort to achieve public health goals more affordably and effectively.