Growth and Migration in the American Southwest: A Tale of Two States
5 takeaways from population data in Arizona and New Mexico

5 takeaways from population data in Arizona and New Mexico
(2012) Between 2010 and 2011, the U.S. population increased by 0.7 percent, after averaging 0.9 percent growth each year from 2000 through 2010.1 The United States added just 2.3 million people from 2010 to 2011, compared with 2.9 million from 2005 to 2006, just five years earlier.
When the World Health Organization declared COVID-19 a pandemic on March 11, 2020, few sub-Saharan African countries had reported a single case of the disease, caused by the novel coronavirus SARS-CoV-2.
Project: Demography and Economics of Aging and Alzheimer’s Disease
This report summarizes recent research conducted by National Institute on Aging-supported researchers and others who have studied the effects of the recession on the health and well-being of older Americans.
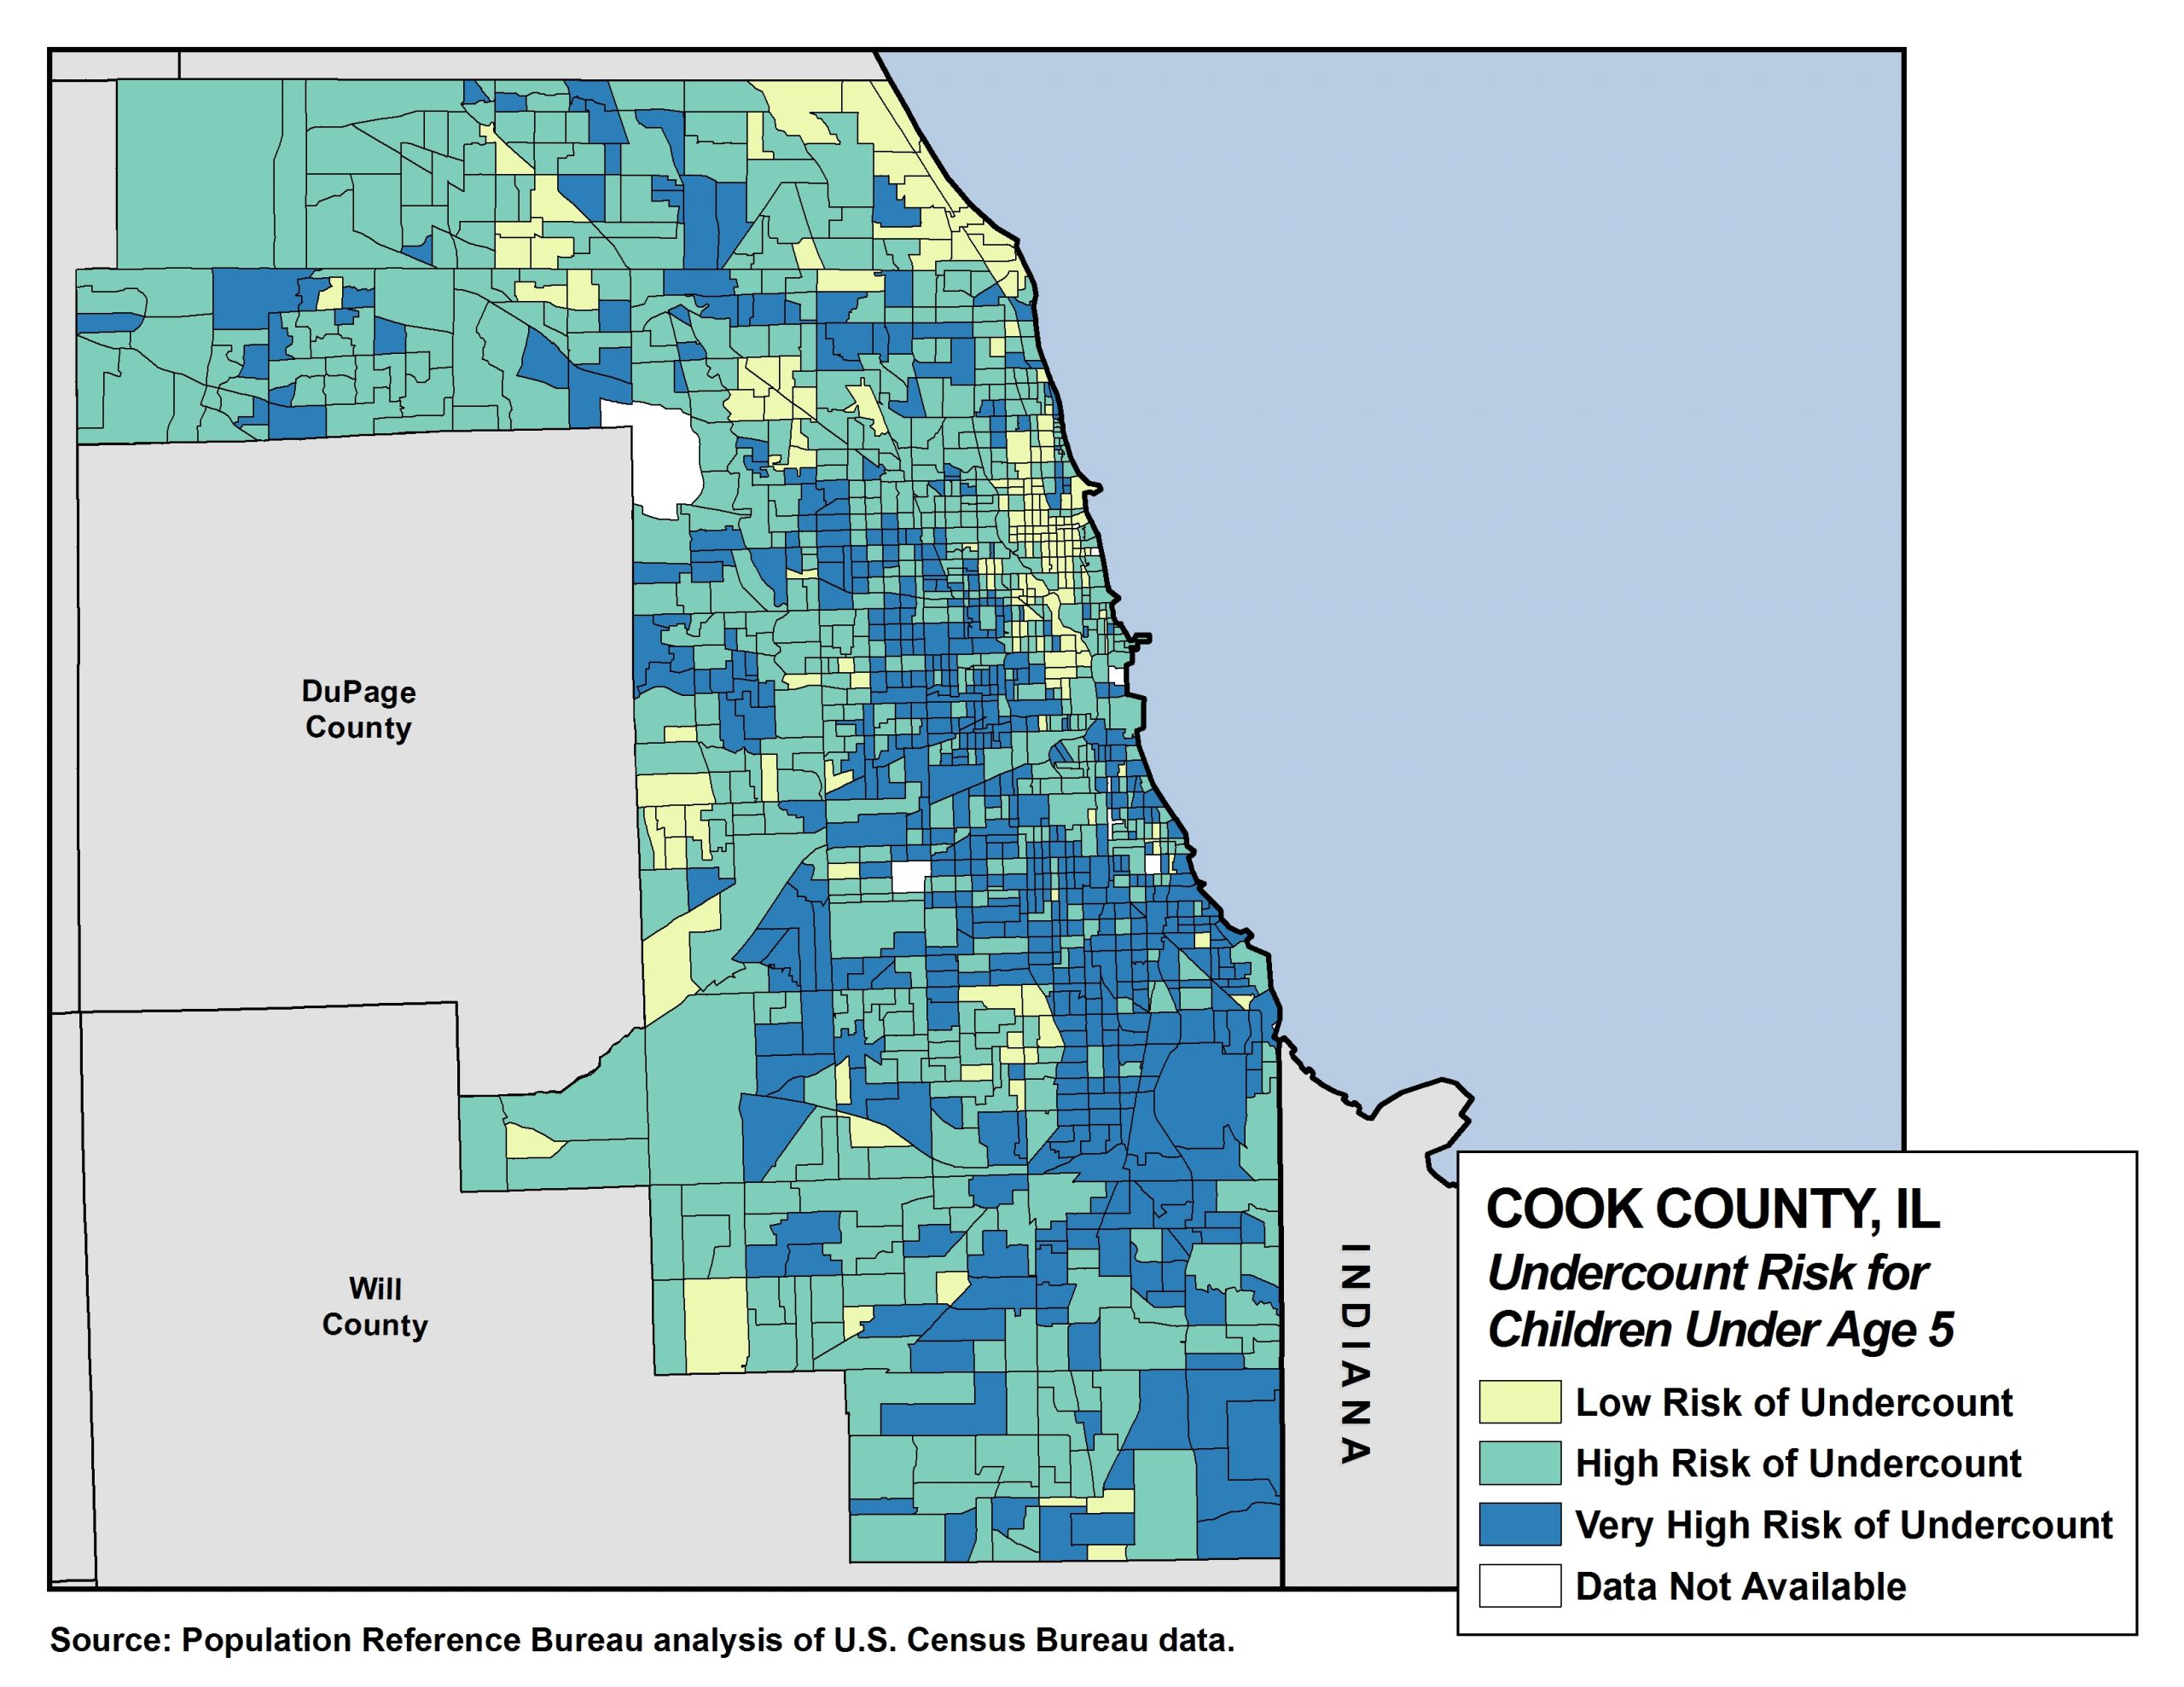
Our analysis focuses on the factors that are most closely associated with the net undercount of children in the census, based on the Census Bureau’s Revised 2018 Experimental Demographic Analysis Estimates.
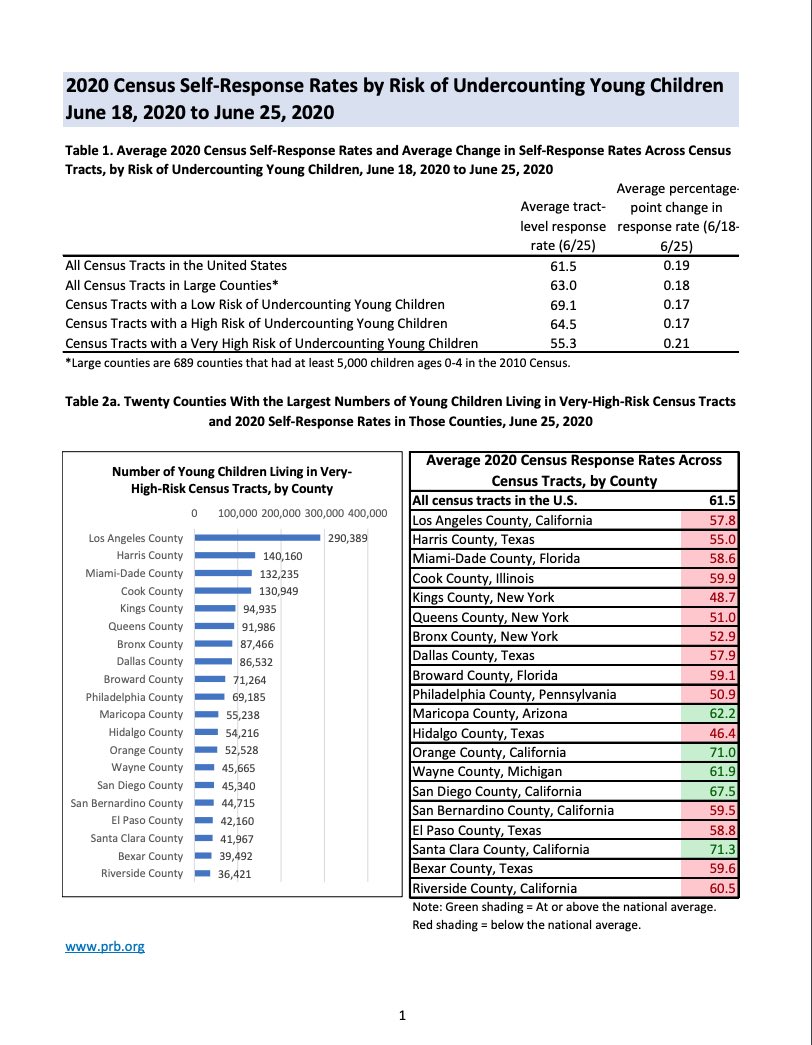
Self-response rates are lowest in neighborhoods with high concentrations of racial and ethnic minorities in the young child population, which could mean fewer dollars for communities that need funds the most.
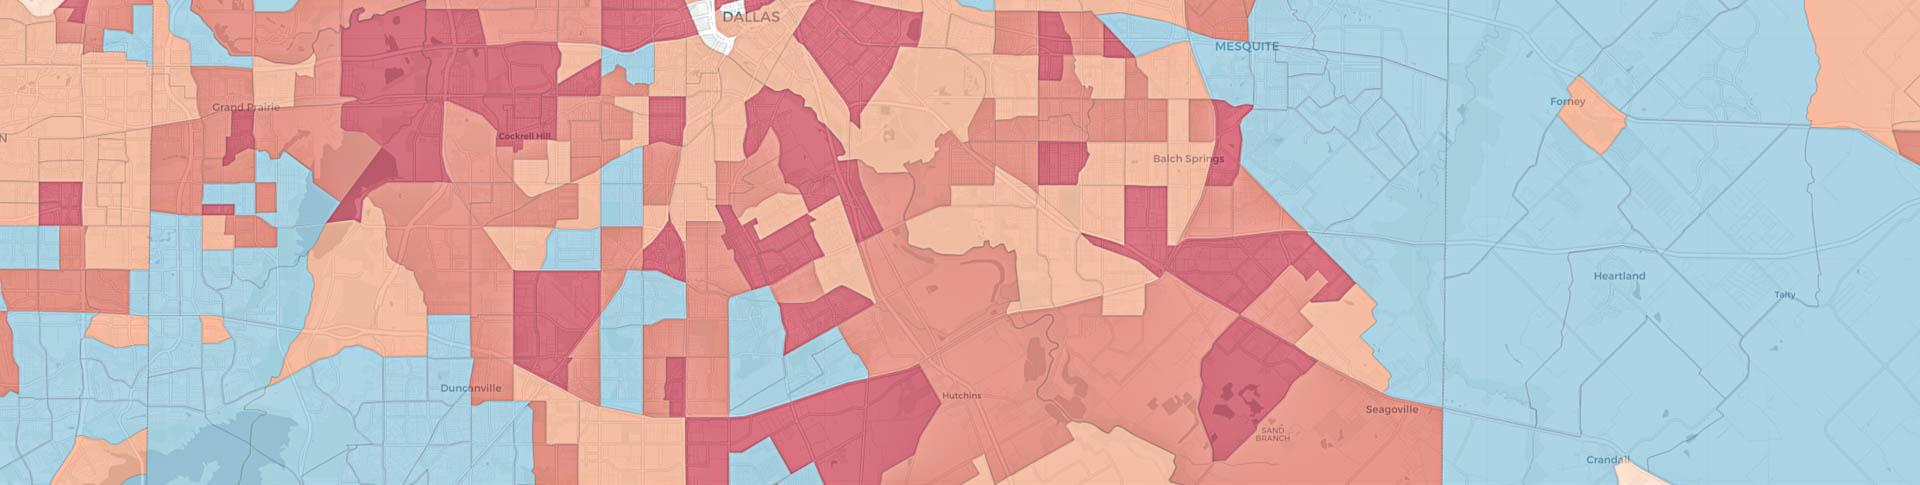
Self-response rates are lowest in neighborhoods with high concentrations of racial and ethnic minorities in the young child population, which could mean fewer dollars for communities that need funds the most.
(2001) As Americans wait for the detailed results of the 2000 U.S. census, Canadians are preparing for their twice-a-decade head count.
(2010) Latinos are increasingly shaping the demographic makeup of the United States.