Today’s Research on Aging 45: Aging Unequally
Two decades of research on health, disability, and care in the United States
The United States is aging at an unprecedented pace. The number of Americans ages 65 and older has nearly doubled since 2000—reaching 61 million in 2024, or more than 1 in 6 Americans—and is projected to climb to 82 million by 2050. The oldest Americans, those ages 85 and older, are the fastest-growing age group and most likely to need extensive support and care.
Living longer is a profound achievement. But longer lives do not automatically mean healthier, more secure, or more equal ones. Across two decades of research, a consistent picture has emerged: The experience of aging in the United States differs enormously—and those differences are not random. They are shaped by education, income, geography, racial disparities, and early-life experiences long before people reach older adulthood.
Health and economic gaps between older Americans are large and, in some cases, widening. Black and Hispanic/Latino older adults are more likely than white older adults to develop dementia, experience disability, and go without needed care. Women outlive men but spend more of those added years with chronic illness and disability. Rural communities are aging the fastest while losing the health workers and services needed to care for their older populations. And for millions of older adults, the combination of chronic disease, inadequate care access, and social isolation creates a quiet crisis largely invisible in national statistics.
Understanding these patterns and what drives them is essential to closing the gaps. Over the past two decades, studies supported by the National Institute on Aging (NIA) made it possible to track how health, disability, caregiving, and inequality evolve across the life course, and identify which policies and conditions make the greatest difference. This brief summarizes what that research has taught us.
Key Findings
- Americans ages 65 and older now number 61 million—18% of the population—and are projected to reach 82 million by 2050, straining caregiving systems, retirement programs, and health care.
- U.S. life expectancy reached a record high of 79 years in 2024 but remains nearly four years shorter than the average among comparable wealthy nations, and racial and educational gaps within the United States are large and persistent.
- Dementia prevalence declined among older Americans between 2000 and 2015, driven largely by rising education, but the trend may be slowing. Roughly 7.4 million Americans ages 65 and older now live with dementia, and the number is projected to approach 14 million by 2060.
- Aging is shaped by social conditions: Black Americans show biomarkers of aging nine biological years older on average than white Americans of the same chronological age, with chronic stress and socioeconomic inequality explaining a large share of the gap.
- The unpaid caregiving provided by family members—valued at $600 billion annually—is the foundation of the U.S. long-term care system, yet the pool of potential family caregivers under age 55 has declined in recent years, while the share of people ages 65 and older has increased.
- More than 600,000 older Americans are on waiting lists for Medicaid home-care services, and nursing home care costs 40% to 60% more than home-based care—a structural policy imbalance with direct consequences for quality of life.
- Social isolation affects roughly 1 in 4 older Americans and is associated with faster biological aging, higher dementia risk, and mortality rates comparable to smoking. It falls most heavily on those who are already disadvantaged by income, race, and disability.
- State policy environments independently shape how long Americans live: Connecticut residents now live approximately five years longer than Oklahoma residents, a gap that did not exist in 1959 and reflects diverging policy choices over decades.
The Studies Behind the Science
Many of the findings presented in this brief were derived from three long-running national longitudinal studies supported by the NIA, meaning they follow the same individuals over time, enabling researchers to observe how health, inequality, and caregiving evolve across decades rather than capturing a single moment.
Living Longer—But How Well?
Americans are living longer than previous generations, but many are entering older age with higher rates of chronic disease, obesity, and disability than the cohorts before them. Two decades of NIA-supported longitudinal research made it possible to track not only how long Americans live, but how much of that life is lived in good health.
In 1900, life expectancy at birth in the United States was 47 years. By 2024, it had reached a record high of 79 years, rebounding from pandemic-related lows that pulled it as far down as 76.4 years in 2021. Americans reaching age 65 can now expect to live an additional 19.5 years on average.1 That increase ranks among the great achievements of public health and medicine.
But progress has stalled relative to peer nations. Average life expectancy among comparable wealthy countries was 82.7 years in 2024—nearly four years longer than in the United States—a gap that has persisted despite the United States spending far more per capita on healthcare than any comparable country.2 Researchers attribute the gap to obesity, the long-term effects of smoking, large socioeconomic inequalities in health, and a fragmented care system.
Health Gains Are Uneven
The central question is no longer simply whether Americans are living longer, but whether those added years are healthy and independent.
Among adults ages 65 and older, gains in disability-free life expectancy have exceeded gains in years lived with disability over the past four decades, a pattern known as compression of morbidity. But those gains have not extended evenly. Among younger adults (ages 20 to 64), the proportion of life spent with disability increased between 1980 and 2010.3 Disability rates among adults ages 55 to 64 also rose during the 2000s, just as the oldest baby boomers entered those ages.4
The baby boom generation was expected to experience healthier aging than previous cohorts because of its higher educational attainment. Instead, many boomers entered older adulthood with elevated rates of chronic disease. Adults ages 51 to 61 in 2004-2010 had higher rates of six out of eight major chronic conditions than adults of the same ages in 1992-1998. Diabetes prevalence alone was 37% higher.5
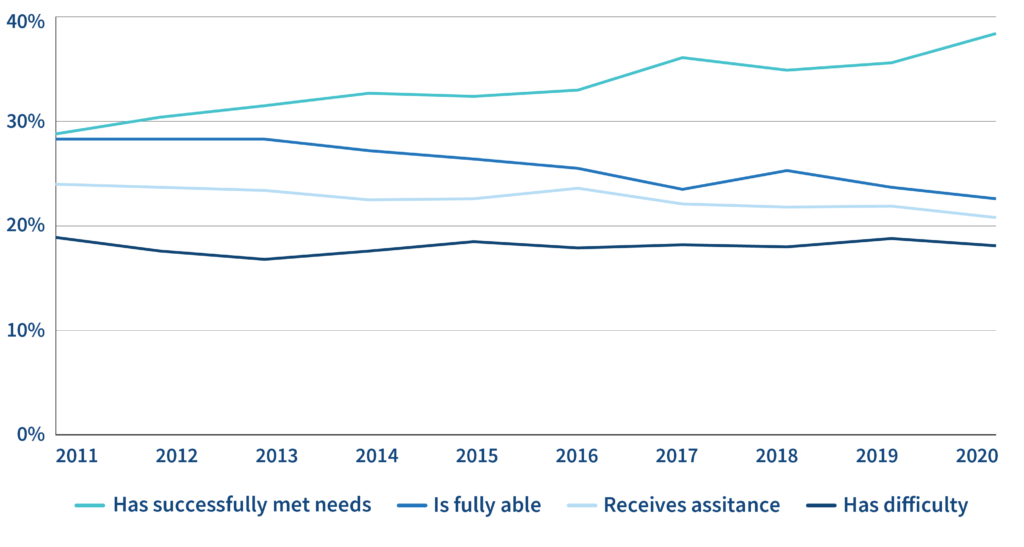
More recent NHATS data through 2020 show an encouraging pattern of adaptation: Nearly 40% of adults ages 70 and older meet self-care and mobility needs with walkers, bath seats, and similar devices (see Figure 1). More than 70% have bathing-related home modifications. The share living in nursing homes or assisted living fell from about 11% in 2011 to about 7% in 2020.6
Figure 1. Nearly 40% of Older Adults Meet Their Self-Care and Mobility Needs With Devices
U.S. Adults Ages 70 and Older, Including Nursing Home Residents, 2011 to 2020
Source: Vicki A. Freedman, Jennifer C. Cornman, and Judith D. Kasper, National Health and Aging Trends Study: Trends Dashboards, 2021.
But racial and ethnic gaps in these gains persist: Disability declined substantially among older adults who are white and more educated, but older Black adults saw smaller gains and are more likely to go without assistive devices that help manage daily tasks independently.7
The consequences of disability extend beyond medical diagnoses. Studies using time-use surveys found that older adults with disabilities experienced 71 fewer pleasant minutes—time spent doing things they found enjoyable—per day than peers without disabilities. This effect on daily well-being is comparable to, or greater than, the effect of marital strain.8
Obesity Trends Threaten Healthy Aging
Obesity has been one of the clearest threats to healthy aging. Obesity accelerates biological aging: Among nonsmokers, people with obesity age more than two biological years faster on average than those with a healthy weight, according to research by Morgan E. Levine and Eileen Crimmins using biomarker data from more than 21,500 Americans.9
“If obesity speeds up the timing of age-related disease and disability,” the researchers write, “medical costs will rise, and more people will live more of their lives in poor health.”
Higher body mass index (BMI) at midlife—not just at older ages—is also strongly predictive of late-life mortality, suggesting the window for prevention begins well before retirement age.10 The U.S. Centers for Disease Control and Prevention (CDC) defines obesity as having a BMI of 30 or higher. The scale of the trend has been striking. Obesity rates among Americans ages 65 to 74 nearly doubled in a single generation, from 26% to 41% between 1988–1994 and 2021–2023, according to the National Health and Nutrition Examination Survey (see Figure 2). In 2021–2023, nearly 46% of adults ages 40 to 59 were classified as obese, raising concern that improvements in healthy aging will not continue into future generations.11
Figure 2. Obesity Rates Among Older Adults in the United States Have Nearly Doubled in a Generation
U.S. Adults Ages 65 and Older With Obesity, by Sex and Age Group, Selected Years, 1988-2023
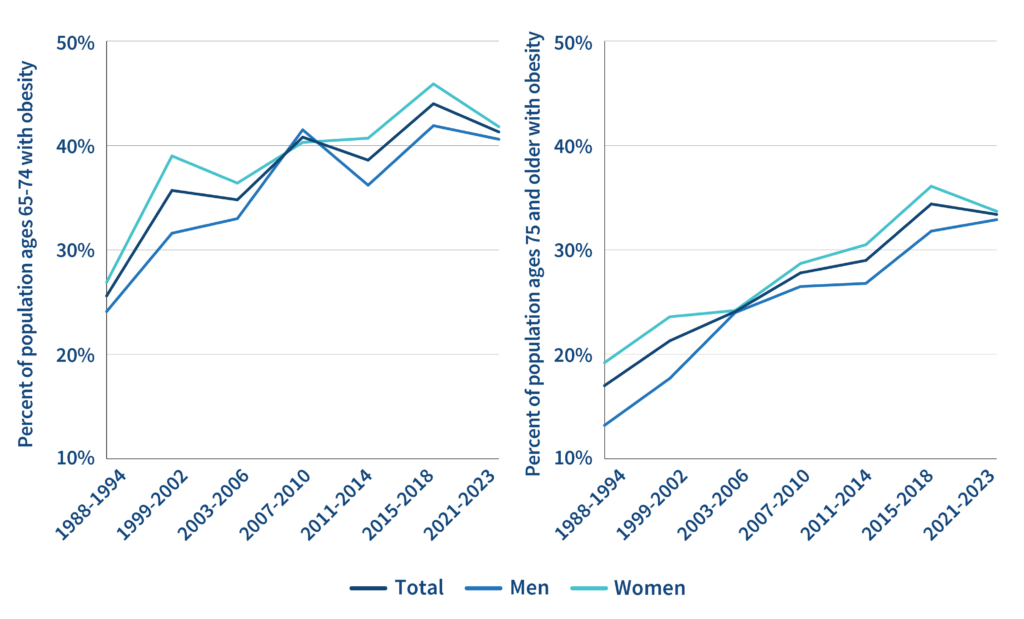
Note: Data are based on measured height and weight. Obese is defined as having a body mass index (BMI) of 30 kilograms per meter squared or greater. Source: Federal Interagency Forum on Aging-Related Statistics, Older Americans 2024: Key Indicators of Well-Being, Table 27; data from the National Center for Health Statistics, National Health and Nutrition Examination Survey.
The trajectory may be shifting. A new class of medications originally developed for diabetes and weight loss (drugs like Ozempic and Wegovy) have shown promise beyond weight loss alone. A landmark clinical trial found that weekly semaglutide injections lowered the risk of heart attack, stroke, or cardiovascular death by 20% among adults with preexisting cardiovascular disease and overweight or obesity but without diabetes, and the benefits did not appear to depend entirely on weight loss.12
Whether these medications will meaningfully alter population health trends over time remains to be seen. Early research suggests they may also slow some aging-related processes, including chronic inflammation, but the evidence is preliminary. And as with most medical advances, the benefits are likely to reach affluent Americans first, raising the possibility that a promising new tool could widen rather than narrow existing health inequalities.
How Inequality Shapes Aging
Chronic disease and obesity do not affect all Americans equally. Who develops these conditions, when they develop them, and how much they shape the aging process depends heavily on the social and economic conditions people live in throughout their lives.
For much of the 20th century, aging research focused primarily on biology—the genetics of disease, the physiology of decline, and the development of medical treatments. NIA-supported research fundamentally broadened that understanding.
But biography shapes aging more than biology. Genetics explain only a modest share of variation in longevity, roughly 15% to 25% by most estimates.13 The remainder reflects differences in education, income, work, neighborhood conditions, stress exposure, and access to resources accumulated over decades.
Childhood Conditions Cast Long Shadows
Rucker Johnson of the University of California, Berkeley and colleagues found that higher childhood socioeconomic status was strongly associated with better adult physical, cognitive, and mental health outcomes, a finding made possible by the HRS, which linked childhood circumstances to health decades later.14 Poor childhood health, exposure to poverty, and limited emotional support can influence health decades later through chronic inflammation, stress hormones, and long-term brain and other organ development.
Research suggests that early disadvantage does not simply predict worse health late in adulthood, it appears to influence the pace of biological aging itself. Adults who experienced socioeconomic disadvantage in childhood show evidence of accelerated biological aging later in life.15
By integrating biomarkers into long-running population studies, researchers could connect biological aging to decades of unequal exposure to stress, discrimination, and neighborhood disadvantage. A large study drawing on 13 datasets representing roughly 13,000 individuals found that accelerated biological aging predicts earlier death even after controlling for smoking, obesity, and disease history.16
Neighborhood conditions also shape health outcomes. Researchers found that living in disadvantaged neighborhoods during young adulthood remained strongly associated with worse health decades later.17
Older adults reporting high stress related to neighborhood safety have shorter telomeres—cellular structures associated with biological aging—while greater neighborhood satisfaction is associated with longer telomeres.18
“Neighborhood conditions appear to get under the skin,” the researchers note.
The Biological Cost of Inequality
Courtney E. Boen of the University of Pennsylvania and colleagues found that Black Americans show biomarkers indicating they are, on average, nine biological years older than white Americans of the same chronological age.19
In a separate study, April D. Thames of the University of Southern California and colleagues found that genes associated with chronic inflammation are expressed more frequently among Black adults reporting high levels of discrimination.20
“Racism-related stress may alter biological processes linked to aging and disease in ways that accumulate invisibly over years,” Thames and colleagues write.
Using HRS data, Uchechi A. Mitchell, Jennifer A. Ailshire, and Eileen M. Crimmins tracked cardiovascular and metabolic risk over four years and found that older Black adults began with a higher number of risk factors than older white or Hispanic adults—and that their risk increased faster, driven by rising blood pressure and blood glucose.21 Even among individuals who had their blood pressure under control at the start of the study, older Black adults were more likely than white adults to lose that control over time.
Race is not the only pathway through which social conditions become biologically embedded. The kind of work people do across their careers also leaves a measurable biological imprint. Theresa Andrasfay of the University of Southern California and colleagues found that among employed adults ages 51 to 60, those in service occupations showed biomarker levels indicating they were 1.65 biological years older than peers in professional and managerial jobs.22
Sleep is another pathway. African Americans who report high levels of discrimination tend to experience poorer sleep quality, while residents of disadvantaged neighborhoods show more fragmented sleep patterns.23 Research drawing on the Midlife in the United States (MIDUS) study finds that racial differences in sleep quality explain more than half of the Black-white gap in cardiovascular disease and diabetes risk.24
Race and gender also interact to produce health burdens that are greater than either factor alone. Black women experience elevated rates of hypertension at younger ages than other groups, research by Liana J. Richardson and Tyson H. Brown using HRS data shows, reflecting not just the effects of race or gender separately but their interaction with class inequality across the life course.25 Black and Mexican American women show elevated risks of poor health beyond what race or gender alone would predict, and the health advantages normally associated with higher education are weaker for Black and Mexican American women than for their white peers.26
State Policies Shape How Long Americans Live
A study tracking life expectancy trends across all 50 states between 1970 and 2014 found that states adopting more conservative policy environments—defined by the researchers as policies favoring lower taxes, less government economic intervention, and fewer protections for marginalized groups—were more likely to experience slowing or reversing gains in life expectancy. Oklahoma and Connecticut had nearly identical life expectancies in 1959; by 2022, Connecticut residents lived more than five years longer on average, 79.7 years compared with 73.9 years in Oklahoma (see Figure 3).27
Figure 3. Life Expectancy Gap Grew From 1959 to 2022 as Oklahoma’s Policies Became More Conservative, Connecticut’s More Liberal
Life Expectancy at Birth by U.S. State, 1959-2022
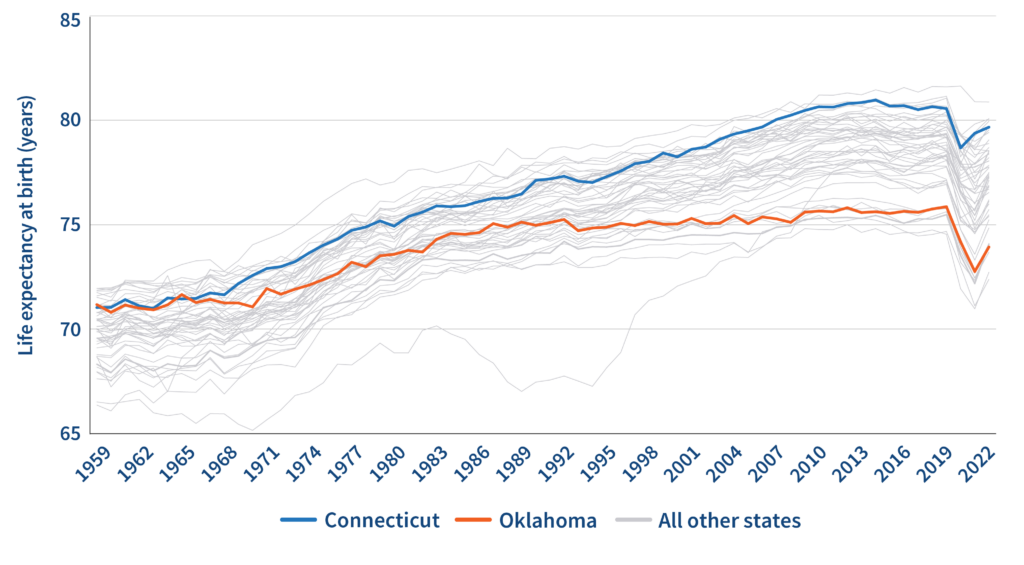
Source: United States Mortality Database (USMDB), University of California, Berkeley and INED, France. Available at usa.mortality.org (accessed June 2026).
Jennifer Karas Montez of Syracuse University, who has led research on state policy and mortality, is direct: “These [policy] decisions have had life and death consequences.” Policies affecting wages, labor protections, tobacco regulation, environmental exposure, and health coverage shape how long Americans live and how well they age.
These patterns of unequal aging extend beyond physical health and life expectancy. Among the most profound challenges facing the growing older population is dementia, a condition shaped by the inequalities that accumulate across a lifetime.
Dementia Burdens Fall Hardest on Those Already Disadvantaged
Dementia has emerged as one of the most consequential consequences of population aging in the United States. It is simultaneously a scientific puzzle, a caregiving challenge, and a growing economic burden for families and public systems.
An Unexpected Decline in Dementia—and Its Limits
One of the most surprising findings in recent aging research was that dementia prevalence among older Americans declined during the early 21st century, even as the older population grew.
HRS data showed that the share of Americans ages 65 and older living with dementia fell from 11.6% in 2000 to 8.8% in 2012, roughly 1 million fewer dementia cases than would have been expected if earlier rates had continued.28 A more recent analysis using NHATS data found a similar decline, from 11.9% to 8.1% among adults ages 72 and older between 2011 and 2022.29
Alzheimer’s disease—the most common cause of dementia—affects an estimated 7.4 million Americans ages 65 and older in 2026, according to the Alzheimer’s Association. The number is projected to rise to nearly 9 million by 2030 and 13.8 million by 2060 absent medical breakthroughs.30 Dementia rates are highest among the oldest old: While roughly 5% of adults ages 65 to 74 have Alzheimer’s, that share rises to nearly one-third of adults ages 85 and older.
Education is a key protective factor. Older adults with more schooling consistently show lower dementia rates, and average educational attainment among older Americans rose substantially during the period of declining prevalence.31 Research suggests education builds cognitive reserve, the brain’s capacity to maintain function despite age-related changes.32
Research by Elizabeth A. Boots of Northwestern University and colleagues suggests that education and mentally stimulating work may build resilience in the brain, helping it maintain function even as age-related changes accumulate.33
They found that older adults with more cognitively complex job histories maintained normal cognitive functioning even when brain imaging showed physical features associated with Alzheimer’s disease.
The decline in dementia prevalence, however, came with important qualifications. It occurred despite rising rates of obesity, diabetes, and hypertension—all risk factors for cognitive decline. Researchers caution that the downward trend may not be sustained, with gains concentrated among more educated adults while rates remain high among Hispanic older adults.34
Dementia Burdens Fall Unequally
Among Medicare beneficiaries ages 72 and older in 2022, only 5% of college graduates were living with dementia, compared with 20% of those with fewer than 12 years of education. Racial disparities are similarly large: 7.0% of non-Hispanic white adults were living with dementia in 2022, compared with 11.1% of non-Hispanic Black older adults and 17.7% of Hispanic older adults.35
Research by Mateo P. Farina and colleagues illustrates how strongly race and education interact. Black adults without a high school diploma at age 65 faced dementia prevalence comparable to that of Black high school graduates at age 75 and white adults with some college education at age 85.36
“Reducing educational inequality,” the researchers conclude, “may be one of the clearest available policy levers for narrowing future racial disparities in dementia risk.”
The same inequalities that shape dementia risk also shape who bears the responsibility of caring for people living with dementia.
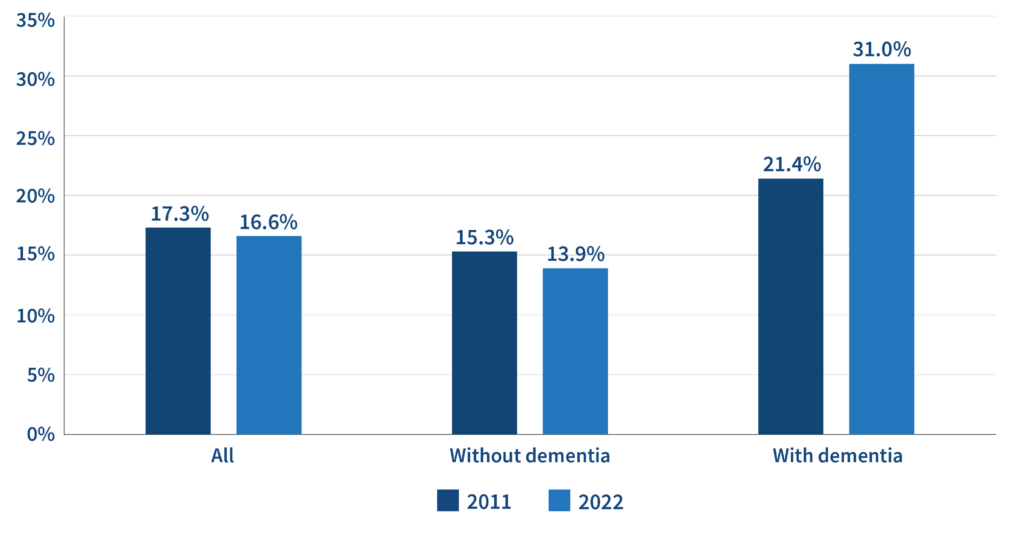
Although older adults with probable dementia represent only about 1 in 10 Americans ages 65 and older, they receive 41% of all unpaid caregiving hours.37 Between 2011 and 2022, the average weekly caregiving hours for family members assisting people with dementia rose from 21 hours to 31 hours (see Figure 4).38
Figure 4. Family Caregivers Are Spending 50% More Time Caring for Older Adults With Dementia
Average Weekly Family Caregiving Hours, by the Dementia Status of Older Adults (65+), 2011 and 2022
Source: Jennifer L. Wolff, Jennifer C. Cornman, and Vicki A. Freedman, “The Number of Family Caregivers Helping Older US Adults Increased From 18 Million to 24 Million, 2011–22,” Health Affairs 44, no. 2 (2025): 189-95.
The financial consequences are severe. In the final five years of life, out-of-pocket spending for people with dementia averages roughly $62,000—more than 80% higher than for people with heart disease or cancer.39 Among low-income older adults paying for home care out of pocket, dementia-related costs consumed an average of 87% of household income.40
The total economic costs of dementia were estimated at $305 billion in 2020, with projections approaching $1.5 trillion by 2050.41
These costs have intensified the urgency of earlier detection. Researchers are increasingly focused on identifying dementia risk before symptoms become clinically apparent. Using AI models combining MRI brain scans with clinical measures, researchers predicted future cognitive decline among cognitively normal older adults with accuracy rates between 81% and 91%.42 Other research found that unintended weight loss begins years before dementia diagnosis and accelerates in the period immediately preceding symptoms.43
The central challenge ahead is understanding why dementia burdens fall so unequally, shaped not only by biology and medical care but by education, cardiovascular health, economic conditions, and unequal exposure to disadvantage across the life course.
The Hidden Infrastructure of Care
The vast majority of long-term care in the United States is provided not by nursing homes, assisted living facilities, or paid home-care workers, but by family members and friends. As the population ages, this largely invisible workforce has become one of the most important pillars of the nation’s care system, providing support that would otherwise fall to public programs and formal health care providers.
In 2022, an estimated 24 million family members and friends were providing unpaid help to older adults, an increase of nearly 6 million since 2011, according to research by Jennifer Wolff, Jennifer Cornman, and Vicki Freedman drawing on linked NHATS and National Study of Caregiving data.44 AARP has estimated the annual value of this unpaid labor at $600 billion in 2021, exceeding total Medicaid spending that year and representing more than all out-of-pocket U.S. health care costs combined.45
Caregiving responsibilities fall unevenly within families. When older parents begin needing assistance, daughters are significantly more likely than sons to become primary caregivers. Researchers describe this pattern as the primacy of the mother-daughter tie, reflecting enduring social expectations around caregiving.46 Caregivers from racial and ethnic minority groups face particular strain, more often assisting older adults with dementia and incomes below the poverty line.
A Shrinking Supply of Family Caregivers
The number of Americans ages 85 and older—those most likely to need extensive care—is projected to triple by 2050, even as the pool of family caregivers ages. Between 2011 and 2023, the share of family caregivers under age 55 declined substantially, while the share ages 65 and older increased.47
In 2010, there were roughly seven potential family caregivers ages 45 to 64 for every American ages 80 and older. That ratio is projected to fall to four-to-one by 2030 and roughly three-to-one by 2050.48 Older adults with any stepchildren are more than twice as likely to go without care from adult children than those with only biological children, a disparity researchers call the step gap.49
The Human Costs of Caregiving
The financial and emotional costs of caregiving fall heavily on caregivers themselves. Using HRS data, researchers estimated that when women in their mid-50s leave the workforce to care for a parent, the median economic cost over two years approaches $165,000.50 Losses extend beyond wages to missed career advancement, lower future earnings, and reduced retirement savings, often compounding into later life.
The COVID-19 pandemic revealed the depth of these dependencies. Caregivers who increased responsibilities during the pandemic reported substantially higher levels of anxiety, depressive symptoms, and emotional exhaustion.51
Together, these pressures—rising hours, lost wages, shrinking family networks, and inadequate public support—point toward a long-term care system increasingly dependent on a fragile infrastructure.
Access to Formal Care Depends on Where You Live and What You Can Pay
The experience of aging in the United States is shaped not only by health and income but also by the institutions that determine access to care, housing, transportation, and disability support. As Americans live longer with chronic illness and disability, state policy, local infrastructure, and caregiving systems increasingly determine who receives support and who does not.
Place, Access, and the Geography of Care
Rural communities are aging faster than urban areas while losing the workers, providers, and tax base needed to support an older population. Rural areas have higher concentrations of older residents, elevated mortality risks, fewer healthcare providers, and more limited transportation infrastructure than urban areas.52 In roughly 40% of U.S. counties, the old-age support ratio has fallen below three working-age adults per person ages 65 and older.53
About half of older Americans who need daily help at home are not getting it.54 Among those who go without assistance, roughly 1 in 3 experience adverse consequences in a given month, including missed medication, soiled clothing, or skipped meals.55 In higher-poverty neighborhoods, nearly 43% of older residents report such adverse consequences, compared with 34% in lower-poverty communities.56
Hispanic older adults face a particular gap—they are consistently 1.5 times more likely than older white adults to go without needed care support.57 Receiving paid care does not guarantee adequate support: Older adults receiving paid care at home experience substantially higher rates of persistent unmet need than those in residential care, often because care hours are insufficient or poorly coordinated.58
The Paid Workforce Behind the Unpaid One
The unpaid caregiving system depends on a chronically understaffed and underpaid direct-care workforce. Rural areas have substantially fewer home health aides per older resident than urban communities.59 Direct-care jobs often involve low wages, high injury rates, limited benefits, and high turnover.60When paid caregivers are unavailable, responsibility shifts to families. When family caregivers become overwhelmed, the burden shifts to nursing homes at substantially higher cost.
Much of this inequality reflects how long-term care policy is structured. Federal Medicaid rules require states to cover nursing home care but make home- and community-based services optional. Home-based care with a home health aide costs a national median of roughly $80,000 annually—compared with $115,000 for a semi-private nursing home room and $130,000 for a private room—yet in many states, home-based services remain hard to obtain.61
More than 600,000 Americans were on waiting lists for Medicaid home- and community-based services in 40 states in 2025.62 Only about 1 in 5 older adults meets all eligibility requirements for Medicaid long-term services and supports, and most states limit countable assets to just $2,000 for individuals.63
Work, Health, and the Limits of Working Longer
As Americans live longer, policymakers increasingly encourage older adults to remain in the workforce longer. But research suggests that the ability to delay retirement is shaped less by preference than by health, education, occupation, and inequality across the life course.
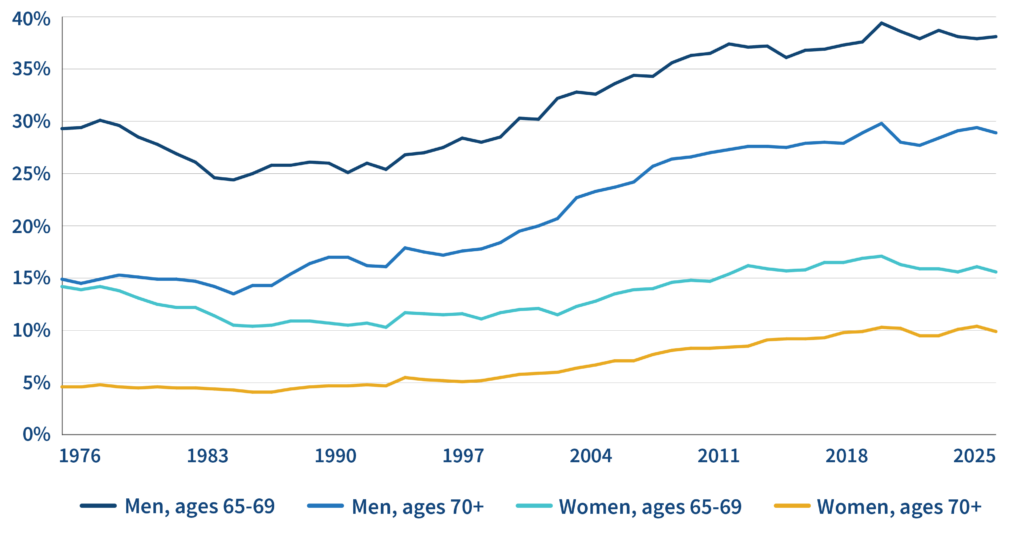
A growing share of Americans now work past age 65. Labor force participation among men ages 65 to 69 rose from 29% in 2004 to 38% in 2025, while women in the same age group saw a comparable increase, from 23% to 29% over the same period (see Figure 5).64 Among adults ages 70 and older, participation also rose, from 13% to 16% among men and from 7% to 10% among women. Researchers attribute the trend to rising life expectancy, changes in pension structures, increased debt near retirement, and Social Security policies that raised the age for full benefits.65
Figure 5. More Older Americans Are Working Past Age 65
Percent of Men and Women Ages 65 and Older in the Labor Force, 1976-2025
Note: Data are annual averages; not seasonally adjusted.
Source: U.S. Bureau of Labor Statistics, Current Population Survey.
Health Divides Who Can Actually Work Past Age 65
Research using a 27-variable health index found that many older Americans retain the physical capacity to work additional years beyond traditional retirement ages, but that capacity is distributed unevenly. Among adults born between 1943 and 1954 without a high school diploma, roughly one-quarter reported health-related work limitations in their mid-50s. Among college graduates of the same cohort, only about 7% reported those limitations.66
The workers most financially dependent on continued employment are often those least physically able to remain employed.
Whether continued employment improves or harms health depends heavily on the kind of work performed. A study of French workers found that retiring at older ages was associated with lower rates of dementia than early retirement.67 At the same time, retirement may improve health for workers in physically demanding or stressful jobs by reducing strain and allowing more time for exercise, sleep, and recovery.68
Delayed retirement is fundamentally a question of equity. Black and Hispanic adults are more likely than non-Hispanic white adults to become disabled before reaching age 65, often arriving at retirement already in compromised health.69 As Vicki Freedman of the University of Michigan and colleagues note, debates over delayed retirement are therefore “not only fiscal questions about Social Security and labor force participation, but also questions about unequal health, unequal work conditions, and unequal opportunities to age in good health.”
The Social Foundations of Health
Social isolation is often treated as a consequence of aging—the result of widowhood, retirement, or declining mobility. Increasingly, however, research suggests that isolation is itself a significant risk factor for physical and cognitive decline, operating through biological pathways that directly affect health and aging.
Social Connection Affects Health at the Biological Level
The health consequences of isolation are not merely psychological. Loneliness and chronic isolation alter gene expression, suppressing antiviral immune responses while activating the inflammatory pathways associated with cardiovascular disease, cancer, and dementia.70
Using DNA data from the HRS, researchers found that older adults with stronger social relationships showed slower biological aging than socially isolated peers, even after accounting for smoking, alcohol use, and other health behaviors.71 The pace of such aging is important: Rapid epigenetic aging at younger chronological ages can contribute to the early onset of chronic disease and disability and premature death.
“Both social connection and health matter for mortality, but the combination of being well-connected and healthy is particularly powerful,” write Linda Waite and Yiang Li of the University of Chicago, drawing on NSHAP data.72
The cognitive stakes are equally clear. Among more than 18,000 older adults followed over 18 years, every additional two years of living alone increased dementia risk by roughly 10%.73
Isolation Is Not Equally Distributed
About 1 in 4 older Americans living in the community is socially isolated, meaning they have very limited social connections or participation in activities. Roughly 1 in 25 Americans is severely isolated, lacking nearly all forms of social engagement. Men are four times as likely as women to experience severe isolation.74 Non-Hispanic Black and Hispanic older adults are more likely to experience isolation because of the cumulative effects of discrimination, financial stress, and unequal access to social resources.75
Communities lacking accessible transportation and public gathering spaces may increase the likelihood of isolation regardless of individual motivation. The U.S. Surgeon General’s 2023 advisory on loneliness described the problem as an epidemic and called for investments in transportation, community infrastructure, and policies supporting social connection.76
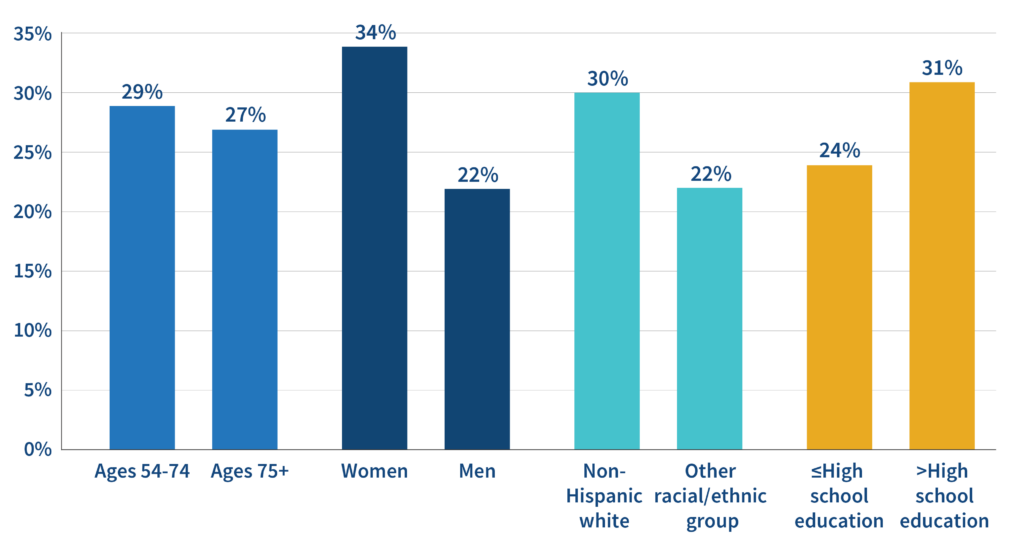
The COVID-19 pandemic provided a large-scale test of whether digital communication could substitute for in-person interaction. Nearly one-third of adults ages 54 to 74 reported feeling lonelier during the pandemic than before it began.77 Studies found that older adults who replaced in-person interaction with increased phone contact were often more likely to experience loneliness, not less (see Figure 6).78
FIGURE 6. Female, White, and Highly Educated Older Adults Were Most Likely to Feel Lonelier During Pandemic
Percent of U.S. Adults Ages 54 and Older Experiencing an Increase in Loneliness in 2020 and 2020, by Characteristic
Source: Eun Young Choi et al., “Changes in Social Lives and Loneliness During COVID-19 Among Older Adults: A Closer Look at the Sociodemographic Differences,” International Psychogeriatrics 35, no. 6 (2023): 305-17.
“Digitally mediated social relations do not appear to substantially offset the absence of in-person/offline social connection,” one research team concluded.79
What the Research Asks of Policy
Two decades of NIA-supported research increasingly suggests that the most important determinants of health in later life are shaped long before later life begins. The following table summarizes the key policy directions the evidence supports.
Table. Key Policy Directions to Support Healthier Aging
Provided file /var/www/prb.org/htdocs/wp-content/uploads/2026/07/TRA_Table-1_v2.xlsx does not exist!
Aging Inequalities in Later Life Can Be Addressed Early
The central lesson of two decades of aging research is that the inequalities visible in later life are rarely created in later life. They emerge from differences that accumulate across decades through education, income, neighborhood conditions, work, healthcare access, and exposure to stress. By the time Americans reach older ages, those advantages and disadvantages have become embedded in individuals’ health, cognition, and economic security, and the availability of care.
This research offers both a warning and a source of optimism. It warns that population aging will magnify existing inequalities if current trends continue, and it demonstrates optimism by showing that the factors that shape aging are not fixed. They are influenced by policies, institutions, and investments that operate across the life course. The strongest evidence from the past two decades suggests that improving aging outcomes requires looking upstream beyond later life to the conditions that determine who arrives there healthy, secure, and able to live independently.
Footnotes
- [1] Shannon L. Murphy et al., “Mortality in the United States, 2023,” NCHS Data Brief No. 521, National Center for Health Statistics, 2024.
- [2] Shameek Rakshit, Lynne Cotter, and Matt McGough, “How Does U.S. Life Expectancy Compare to Other Countries?” Peterson-KFF Health System Tracker, March 31, 2026.
- [3] Eileen M. Crimmins, Yuan Zhang, and Yasuhiko Saito, “Trends Over Four Decades in Disability-Free Life Expectancy in the United States,” American Journal of Public Health 106, no. 7 (2016): 1287-93.
- [4] Vicki Freedman et al., “Trends in Late-Life Activity Limitations in the United States: An Update From Five National Surveys,” Demography 50, no. 2 (2013).
- [5] Hiram Beltrán-Sánchez, Marcia P. Jiménez, and S.V. Subramanian, “Assessing Morbidity Compression in Two Cohorts From the Health and Retirement Study,” Journal of Epidemiology and Community Health 70, no. 10 (2016): 1011–66.
- [6] Reference missing
- [7] Paola Scommegna, “An Improved State of Aging in America,” Population Reference Bureau, June 25, 2021.
- [8] Vicki A. Freedman et al., “Disability, Participation, and Subjective Wellbeing Among Older Couples,” Social Science and Medicine 74, no. 4 (2012): 588-96.
- [9] Morgan E. Levine et al., “An Epigenetic Biomarker of Aging for Lifespan and Healthspan,” Aging 10, no. 4 (2018): 573-91.
- [10] Samuel H. Preston, Yana C. Vierboom, and Andrew Stokes, “The Role of Obesity in Exceptionally Slow U.S. Mortality Improvement,” Proceedings of the National Academy of Sciences 115, no. 5 (2018): 957-61.
- [11] Samuel D. Emmerich et al., “Obesity and Severe Obesity Prevalence in Adults: United States, August 2021–August 2023,” NCHS Data Brief, no. 508 (2024).
- [12] A. Michael Lincoff et al., “Semaglutide and Cardiovascular Outcomes in Obesity Without Diabetes,” The New England Journal of Medicine 389, no. 24 (2023): 2221-32.
- [13] Linda Broer et al., “GWAS of Longevity in CHARGE Consortium Confirms APOE and FOXO3 Candidacy,” Journals of Gerontology, Series A: Biological Sciences and Medical Sciences 70, no. 1 (2015): 110-18.
- [14] Rucker C. Johnson, Robert F. Schoeni, and Jeannette A. Rogowski, “Health Disparities in Mid-to-Late Life: The Role of Earlier Life Family and Neighborhood Socioeconomic Conditions,” Social Science and Medicine 74, no. 4 (2011): 625-36.
- [15] Cecilia Potente et al., “Socioeconomic Inequalities and Molecular Risk for Aging in Young Adulthood,” American Journal of Epidemiology 192, no. 12 (2023): 1981-90; and Lauren L. Schmitz et al., “Associations of Early-Life Adversity With Later-Life Epigenetic Aging Profiles in the Multi-Ethnic Study of Atherosclerosis,” American Journal of Epidemiology 192, no. 12 (2023): 1991-2005.
- [16] Brian H. Chen et al., “DNA Methylation-Based Measures of Biological Age: Meta-Analysis Predicting Time to Death,” Aging 8, no. 9 (2016): 1844-65.
- [17] Johnson, Schoeni, and Rogowski, “Health Disparities in Mid-to-Late Life: The Role of Earlier Life Family and Neighborhood Socioeconomic Conditions.”
- [18] Arline T. Geronimus et al., “Race-Ethnicity, Poverty, Urban Stressors, and Telomere Length in a Detroit Community-Based Sample,” Journal of Health and Social Behavior 56, no. 2 (2015): 199-224.
- [19] Courtney E. Boen et al., “Patterns and Life Course Determinants of Black-White Disparities in Biological Age Acceleration: A Decomposition Analysis,” Demography 60, no. 6 (2023): 1815-41.
- [20] April D. Thames et al., “Experienced Discrimination and Racial Differences in Leukocyte Gene Expression,” Psychoneuroendocrinology 106 (2019): 277-83.
- [21] Uchechi A. Mitchell, Jennifer A. Ailshire, and Eileen M. Crimmins, “Change in Cardiometabolic Risk Among Blacks, Whites, and Hispanics: Findings From the Health and Retirement Study,” Journals of Gerontology, Series A: Biological Sciences and Medical Sciences 74, no. 2 (2019): 240-46.
- [22] Theresa Andrasfay et al., “Aging on the Job? The Association Between Occupational Characteristics and Accelerated Biological Aging,” Journals of Gerontology, Series B 78, no. 7 (2023): 1236-45.
- [23] Sherry L. Owens et al., “Association Between Discrimination and Objective and Subjective Sleep Measures in the Midlife in the United States Study Adult Sample,” Psychosomatic Medicine 79, no. 4 (2016); and Thomas Fuller-Rowell et al., “Racial Disparities in Sleep: The Role of Neighborhood Disadvantage,” Sleep Medicine 27, no. 1 (2016): 1-8.
- [24] David S. Curtis et al., “Habitual Sleep as a Contributor to Racial Differences in Cardiometabolic Risk,” Proceedings of the National Academy of Sciences 114, no. 33 (2017): 8889-94.
- [25] Liana J. Richardson and Tyson H. Brown, “(En)gendering Racial Disparities in Health Trajectories: A Life Course and Intersectional Analysis,” SSM—Population Health 2 (2016): 425-35.
- [26] Tyson H. Brown et al., “Using Multiple-Hierarchy Stratification and Life Course Approaches to Understand Health Inequalities: The Intersecting Consequences of Race, Gender, SES, and Age,” Journal of Health and Social Behavior 57, no. 2 (2016): 200-22.
- [27] Jennifer Karas Montez et al., “U.S. State Policies, Politics, and Life Expectancy,” Milbank Quarterly 98, no. 3 (2020): 668-99.
- [28] Kenneth M. Langa et al., “A Comparison of the Prevalence of Dementia in the United States in 2000 and 2012,” JAMA Internal Medicine 177, no. 1 (2017): 51-58.
- [29] Vicki A. Freedman and Jennifer C. Cornman, National Health and Aging Trends Study Chart Book, 2011-2023, Key Trends, Measures and Detailed Tables, 2026. Note: Estimate excludes nursing home residents.
- [30] Alzheimer’s Association, “Alzheimer’s Disease Facts and Figures,” data as of 2024.
- [31] Kenneth M. Langa et al., “A Comparison of the Prevalence of Dementia in the United States in 2000 and 2012.”
- [32] Yaakov Stern, “Cognitive Reserve in Ageing and Alzheimer’s Disease,” The Lancet Neurology 11, no. 11 (2012): 1006-12.
- [33] Elizabeth A. Boots et al., “Occupational Complexity and Cognitive Reserve in a Middle-Aged Cohort at Risk for Alzheimer’s Disease,” Archives of Clinical Neuropsychology 30, no. 7 (2015): 634-42.
- [34] Kenneth M. Langa et al., “A Comparison of the Prevalence of Dementia in the United States in 2000 and 2012.”
- [35] Vicki A. Freedman and Jennifer C. Cornman, National Health and Aging Trends Study Chart Book, 2011-2023, Key Trends, Measures and Detailed Tables, 2026. Note: Estimate excludes nursing home residents.
- [36] Mateo P. Farina et al., “Racial and Educational Disparities in Dementia and Dementia-Free Life Expectancy,” Journals of Gerontology, Series B 75, no. 7 (2020): e105–e112.
- [37] Judith D. Kasper et al., “The Disproportionate Impact of Dementia on Family and Unpaid Caregiving to Older Adults,” Health Affairs 34, no. 10 (2015): 1642-49.
- [38] Jennifer L. Wolff, Jennifer C. Cornman, and Vicki A. Freedman, “The Number of Family Caregivers Helping Older U.S. Adults Increased From 18 Million to 24 Million, 2011-22,” Health Affairs 44, no. 2 (2025): 189-95.
- [39] Amy S. Kelley et al., “The Burden of Health Care Costs for Patients With Dementia in the Last Five Years of Life,” Annals of Internal Medicine 165, no. 10 (2015): 729-36.
- [40] Karen Shen et al., “Paying for Home Care Out-of-Pocket Is Common and Costly Across the Income Spectrum Among Older Adults,” Health Affairs Scholar 3, no. 1 (2025).
- [41] National Academies of Sciences, Engineering, and Medicine, Reducing the Impact of Dementia in America: A Decadal Survey of the Behavioral and Social Sciences (Washington, DC: National Academies Press, 2021).
- [42] Phoebe Imms et al., “Neuroanatomical and Clinical Factors Predicting Future Cognitive Impairment,” GeroScience 47 (2024): 915-34.
- [43] Yuan S. Zhang and Virginia W. Chang, “Time Path of Weight Status Before and After Incident Dementia,” Journal of Aging and Health 36, no. 1-2 (2024): 98-109.
- [44] Jennifer L. Wolff, Jennifer C. Cornman, and Vicki A. Freedman, “The Number of Family Caregivers Helping Older U.S. Adults Increased From 18 Million to 24 Million, 2011-22,” Health Affairs 44, no. 2 (2025): 189-95.
- [45] Susan C. Reinhard et al., Valuing the Invaluable: 2023 Update (Washington, DC: AARP, 2023).
- [46] Tabea Leopold, Marcel Raab, and Henriette Engelhart, “The Transition to Parent Care: Costs, Commitments, and Caregiver Selection Among Children,” Journal of Marriage and Family 76, no. 2 (2014): 361-73.
- [47] Wolff, Cornman, and Freedman, “The Number of Family Caregivers Helping Older U.S. Adults Increased From 18 Million to 24 Million, 2011-22.”
- [48] Donald Redfoot, Lynn Feinberg, and Ari Houser, The Aging of the Baby Boom and the Growing Care Gap: A Look at Future Declines in the Availability of Family Caregivers, AARP Public Policy Institute, 2013.
- [49] Merril Silverstein and Roseann Giarrusso, “Aging and Family Life: A Decade Review,” Journal of Marriage and Family 72, no. 5 (2010): 1039-58.
- [50] Melinda M. Skira, “Dynamic Wage and Employment Effects of Elder Parent Care,” International Economic Review 56, no. 1 (2015): 63-93.
- [51] Amanda Leggett et al., “The Changing Tides of Caregiving During the COVID-19 Pandemic,” Journals of Gerontology, Series B 77, suppl. 1 (2022): S86-97.
- [52] Diana Elliott and Mark Mather, “Rural America Is Aging—Without Enough Care Workers,” Population Reference Bureau, July 5, 2024.
- [53] Mark Mather et al., “What the 2020 Census Will Tell Us About a Changing America,” Population Bulletin 74, no. 1 (2019).
- [54] Sarah E. Patterson et al., “Care Received and Unmet Care Needs Among Older Parents in Biological and Step Families,” Journals of Gerontology, Series B 77, suppl. 1 (2022): S51-62.
- [55] Brenda C. Spillman et al., Informal Caregiving for Older Americans: An Analysis of the 2011 National Study of Caregiving, U.S. Department of Health and Human Services, Office of the Assistant Secretary for Planning and Evaluation, Office of Disability, Aging and Long-Term Care Policy, 2014.
- [56] Chanee D. Fabius et al., “The Role of Person- and Family-Oriented Long-Term Services and Supports,” Milbank Quarterly 101, no. 4 (2023): 1076-138.
- [57] Jun Li, Jinkyung Ha, and Geoffrey Hoffman, “Unaddressed Functional Difficulty and Care Support Among White, Black, and Hispanic Older Adults in the Last Decade,” Health Affairs Scholar 1, no. 3 (2023).
- [58] Meghan Jenkins Morales and Stephanie A. Robert, “Examining Consequences Related to Unmet Care Needs Across the Long-Term Care Continuum,” Journals of Gerontology, Series B 77, suppl. 1 (2022): S63-73; and Chanee D. Fabius et al., “Associations Between Use of Paid Help and Care Experiences Among Medicare-Medicaid Enrolled Older Adults With and Without Dementia,” The Journals of Gerontology, Series B 77, no. 12 (2022): e216-25.
- [59] Jennifer Dill et al., “Who Will Care for Rural Older Adults? Measuring the Direct Care Workforce in Rural Areas,” Rural Health Research Center Policy Brief, 2022.
- [60] Institute of Medicine, Retooling for an Aging America: Building the Health Care Workforce (Washington, DC: National Academies Press, 2008).
- [61] CareScout, 2025 Cost of Care Survey.
- [62] Alice Burns, Abby Wolk, and Molly O’Malley Watts, “A Look at Waiting Lists for Medicaid Home- and Community-Based Services from 2016 to 2025,” KFF, Nov. 20, 2025.
- [63] Rachel Hest et al., “Modeling Financial Eligibility for Medicaid Long-Term Services and Supports,” Journal of Aging & Social Policy 34, no. 6 (2022): 923-37.
- [64] U.S. Bureau of Labor Statistics, Current Population Survey, 1967-2017.
- [65] Population Reference Bureau, “Health and Working Past Traditional Retirement Ages,” Today’s Research on Aging, no. 37 (2018).
- [66] Courtney Coile, Kevin Milligan, and David A. Wise, “Health Capacity to Work at Older Ages: Evidence for the U.S.,” in Social Security Programs and Retirement Around the World, ed. David A. Wise (Chicago: University of Chicago Press, 2017).
- [67] Carole Dufouil et al., “Older Age at Retirement Is Associated With Decreased Risk of Dementia,” European Journal of Epidemiology 29, no. 5 (2014): 353-61.
- [68] Michael Insler, “The Health Consequences of Retirement,” Journal of Human Resources 49, no. 1 (2014): 195-233.
- [69] Vicki A. Freedman and Brenda C. Spillman, “Active Life Expectancy in the Older U.S. Population, 1982-2011: Differences Between Blacks and Whites Persisted,” Health Affairs 35, no. 8 (2016): 1351-58.
- [70] Steven W. Cole, “Social Regulation of Human Gene Expression: Mechanisms and Implications for Public Health,” American Journal of Public Health 103, suppl. 1 (2013): S84-92.
- [71] Kelly E. Rentscher et al., “Social Relationships and Epigenetic Aging in Older Adulthood: Results From the Health and Retirement Study,” Brain, Behavior, and Immunity 114 (2023): 349-59.
- [72] Linda J. Waite and Yiang Li, “Bringing the Social World Into Our Understanding of Health,” paper presented at the Population Association of America annual meeting, Columbus, Ohio, April 2024.
- [73] Benjamin A. Shaw, Tse-Chuan Yang, and Seulki Kim, “Living Alone During Old Age and the Risk of Dementia,” Journals of Gerontology, Series B 78, no. 2 (2023): 293-301.
- [74] Thomas K.M. Cudjoe et al., “The Epidemiology of Social Isolation: National Health and Aging Trends Study,” Journals of Gerontology, Series B 75, no. 1 (2020): 107–13.
- [75] Debra Umberson and Rachel Donnelly, “Social Isolation: An Unequally Distributed Health Hazard,” Annual Review of Sociology 49 (2023): 379-99.
- [76] U.S. Department of Health and Human Services, “New Surgeon General Advisory Raises Alarm About the Devastating Impact of the Epidemic of Loneliness and Isolation in the United States,” press release, May 3, 2023.
- [77] Eun Young Choi et al., “Changes in Social Lives and Loneliness During COVID-19 Among Older Adults: A Closer Look at the Sociodemographic Differences,” International Psychogeriatrics 35, no. 6 (2023): 305-17.
- [78] Namkee G. Choi et al., “COVID-19 and Loneliness Among Older Adults,” Clinical Gerontologist 45, no. 2 (2021): 390-402.
- [79] Jeffrey G. Snodgrass et al., “Social Connection and Gene Regulation During the COVID-19 Pandemic: Divergent Patterns for Online and In-Person Interaction,” Psychoneuroendocrinology 144 (2022).
Related Posts
The Demography of Dementia and Dementia Caregiving
Dementia is one of the nation’s most expensive old-age health conditions and the most time consuming for family caregivers.

Research Identifies New Strategies to Reduce Undercount of Young Children in U.S. 2020 Census
PRB identifies factors predicting where children under age 5 are more likely to be missed in the 2020 Census and develops a new undercount risk measure for young children.

Family Caregiving for Older People
(2016) In the United States, the vast majority of care that allows older people to live in their own homes is provided by family members who do not receive pay for their services.