prb-hero

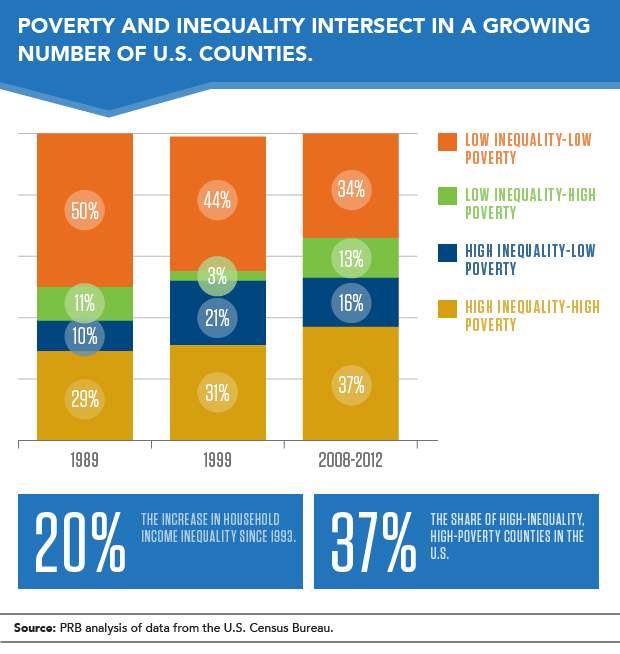
Where Poverty and Inequality Intersect

Product: Population Bulletin, vol. 69, no. 2: The Demography of Inequality in the United States

Date: September 23, 2014

In the United States, the gap between those at the top of the economic ladder and those at the bottom is wide and growing. Since the Great Recession, public discourse has focused primarily on the earnings of top executives—the top 1 percent—in comparison with low-wage workers. But broader measures of income inequality also show a growing gap between the haves and the have-nots. The Gini Index, which measures inequality across households, recently registered its first significant year-to-year increase since 1993 and has risen by 20 percent since 1967.1

The U.S. poverty rate has also increased in recent years, but at 14.5 percent the poverty rate is well below levels recorded 50 years ago when President Lyndon Johnson declared a War on Poverty. Poverty rates have fluctuated over time, increasing during recessions and decreasing during periods of economic growth.

However, for many regions poverty and inequality have increased in tandem in recent years. In the late 1980s and 1990s, income inequality and poverty intersected primarily in Appalachia, the Deep South, and parts of California and the Southwest. But during the past decade, poverty and inequality spread to new areas in Alabama, the Carolinas, Georgia, Michigan, and Tennessee (see map). By 2008-12, the majority of counties in the South (59 percent) were experiencing high levels of inequality combined with high poverty levels. Nationwide, 37 percent of counties fell into this category in 2008-12, up from 31 percent in 1999 and 29 percent in 1989.

In this analysis, counties are classified as “high poverty” if they have poverty rates greater than 15.4 percent—the average poverty rate across all of the counties and years. “High-inequality” counties are those with Gini indices greater than 0.43 (the average Gini Index across all counties and years). Data are from the Census Bureau’s 1990 and 2000 Decennial censuses and the 2008-2012 American Community Survey.

Among U.S. metropolitan areas, Atlanta has emerged as one of the most unequal, with high levels of residential segregation and low levels of intergenerational mobility (economic outcomes for children relative to those of their parents). In the Atlanta Metro Area, only 4.5 percent of children growing up in the bottom income quintile reach the top income quintile as adults.2 Levels of intergenerational mobility are even lower in Charlotte, North Carolina. High levels of inequality, combined with an inability to move up the economic ladder, puts lower-income children at a severe disadvantage compared with those living in more affluent families.

The share of low-poverty, low-inequality counties has dropped steadily over time, from 50 percent of counties in 1989 to 44 percent of counties in 1999 and just 34 percent of counties in 2008-12 (see figure). Today most of the remaining low-inequality, low-poverty counties are located in the upper Midwest, Mountain, Mid-Atlantic, and northeastern states.


Inequality is most often discussed in the context of lower-income families but income disparities also exist in more affluent communities, dividing middle-class and high-income families. The number of high-inequality, low-poverty counties reached its peak in 1999 during a period of rapid economic expansion and relative economic prosperity. About 21 percent of counties were classified as high-inequality and low-poverty in 1999. By 2008-12, the share of high-inequality, low-poverty counties had dropped to 16 percent. Many of these counties are located in high-cost metropolitan areas on the East and West coasts, but there has also been a sharp increase in inequality in oil-rich North Dakota, where poverty rates remain relatively low.3

Finally, there are some counties where poverty is widespread but there is a fairly narrow gap between higher-income and lower-income families. These low-inequality, high-poverty areas made up 13 percent of counties in 2008-12. Counties of this type were almost nonexistent in 1999, but their numbers increased with the job losses associated with the Great Recession, especially in parts of Maine, Michigan, Missouri, and the Pacific Northwest. Also included in this group are many American Indian areas, such as Buffalo County, South Dakota, which has one of the highest poverty rates in the nation (33 percent in 2008-12).4


References

  1. U.S. Census Bureau, “Table H-4. Gini Ratios for Households, by Race and Hispanic Origin of Householder: 1967 to 2012,” accessed at www.census.gov/hhes/www/income/data/historical/inequality/, on Aug. 5, 2014.
  2. Raj Chetty et al., “Where Is the Land of Opportunity? The Geography of Intergenerational Mobility in the United States” (June 2014), accessed at http://obs.rc.fas.harvard.edu/chetty/mobility_geo.pdf, on Aug. 5, 2014.
  3. Mark Mather and Beth Jarosz, “U.S. Energy Boom Fuels Population Growth in Many Rural Counties” (March 2014), accessed at www.prb.org/Publications/Articles/2014/us-oil-rich-counties.aspx, on Aug. 5, 2014.
  4. U.S. Census Bureau, Small Area Income and Poverty Estimates.