The Backdrop: Rising Inequality in the U.S.

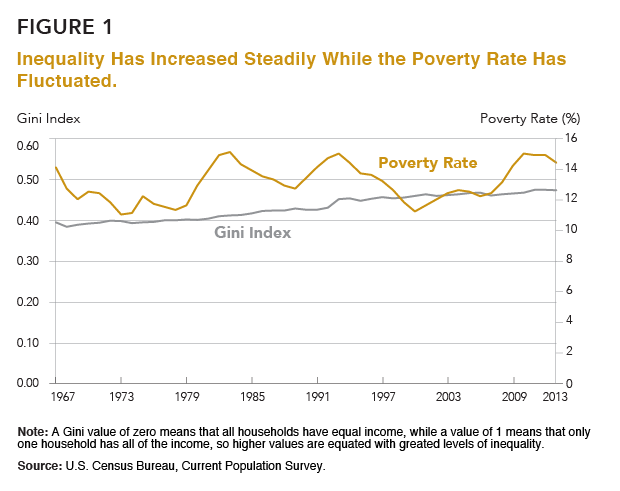
Poverty rates have fluctuated over time, increasing during periods of job loss and decreasing when the economy recovers (see Figure 1). But In 2013, the national Gini Index—the most widely used measure of inequality—stood at .476, up from .463 in 2007 and .397 in 1967. A Gini value of zero means that all households have equal income, while a value of 1 means that only one household has all of the income, so higher values are equated with greater levels of inequality. In 2012, the Gini Index value matched the highest level ever recorded in the United States. Another measure of inequality, based on the share of income received by the top 20 percent of households, shows a similar increase. In 2013, the top 20 percent of households controlled over half (51 percent) of all household income.
The Occupy Movement drew attention to rising income inequality in the United States with their slogan, “We are the 99%.” During the recession, income among the top 1 percent of families fell with the stock market crash and declines in earnings from capital gains. However, this decline was only temporary. By 2012, the top 1 percent of families—those with annual incomes over $394,000—controlled 22 percent of U.S. income, up from 18 percent in 2009.6
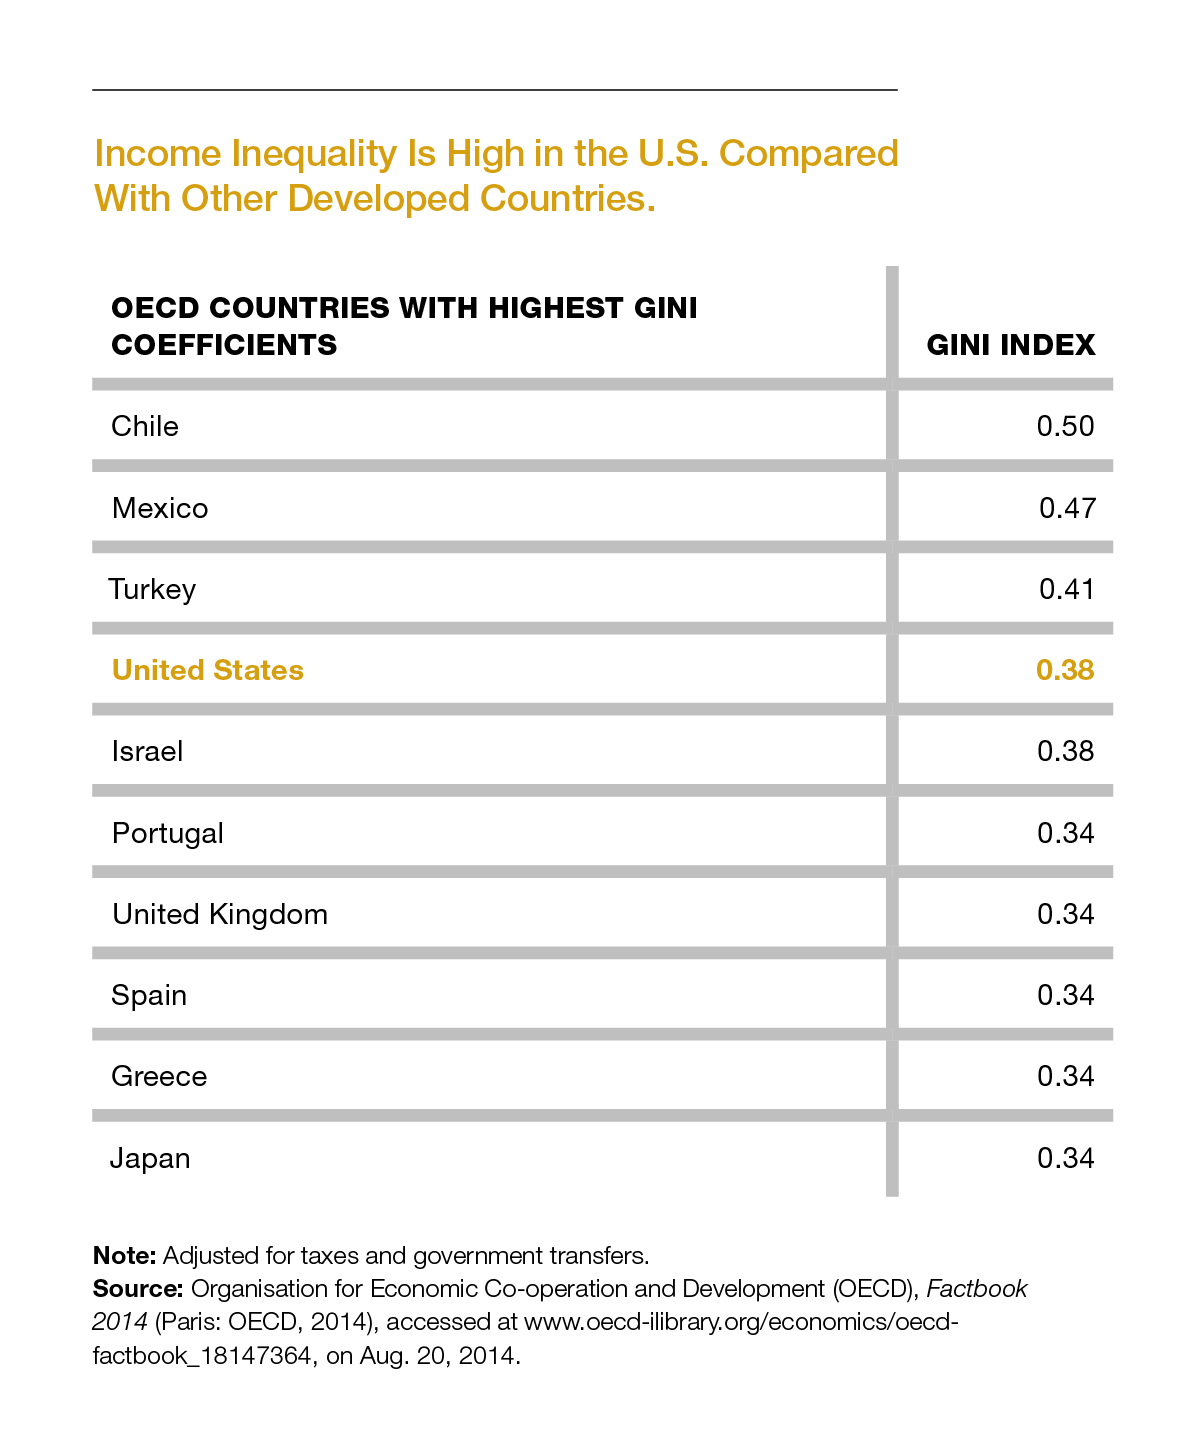
The increase in income inequality is not unique to the United States. Many other countries have seen growing income gaps—especially Estonia, France, Greece, Ireland, Japan, Slovenia, and Spain.7 But today the United States has one of the highest levels of income inequality among developed nations (see table). With an adjusted Gini Index of .38, the United States ranks just slightly below Turkey and is tied with Israel. Levels of income inequality are substantially lower in Canada (.32), France (.30), and Germany (.29).8
The Growing Wealth Gap
Gaps in household net worth, or wealth, are not reported as widely as differences in income, but in some respects, wealth is a better marker of family well-being. Among more-affluent households, wealth is mainly tied up in the stock market, but for most Americans, and especially those living in lower-income families, a home is the most valuable asset they will ever own. Homeownership provides a basic source of economic security and can shield families against material hardship by providing a cushion in the case of sudden loss of income. Owning a home also contributes to residential stability, civic engagement, psychological well-being, and children’s educational success.9
In the United States, the wealth gap is larger than the income gap, sharply dividing those at the top and bottom of the economic ladder. The Great Recession led to broad, across-the-board declines in wealth, but those at the top experienced smaller declines, in relative terms, compared with those at the bottom. As a result, the level of wealth inequality in the United States increased in the aftermath of the recession. Between 2007 and 2013, average wealth among the top 5 percent of households fell by 16 percent, compared with a 43 percent decline among middle-class households at the 50th percentile. By 2013, the top 5 percent of households had an average net worth 24 times that of households at the 50th percentile ($1.36 million compared with $56,000).10
How did this wealth gap come about? During the late 1990s, median household wealth sharply increased as the stock market boomed. Stock prices declined during the early 2000s, but wealth continued to grow with the increase in home values, benefitting the middle class as well as those in more-affluent households. But in 2007, home prices dropped sharply, wiping out trillions of dollars of assets. The middle class, which had more of their wealth tied up in their homes, was hit harder by the drop in housing prices compared with wealthier households. Foreclosures hit record levels, with 3 million homes receiving foreclosure notices in 2010.11 Between 2007 and 2013, home equity fell 61 percent among homeowners in the bottom half of the wealth distribution, compared with only a 20 percent decline among the top 5 percent of households.12 In the meantime, the stock market recovered most of its losses, fueling a rapid increase in assets among the wealthiest households.
NEXT: Where Poverty and Inequality Intersect
POPULATION BULLETIN CHAPTERS
Introduction
The Backdrop: Rising Inequality
Where Poverty and Inequality Intersect
The Generational Divide
Persistent Racial/Ethnic Gaps
Women Making Progress, But Gaps Remain
Education: The Great Equalizer?
Looking Ahead
- Includes income from capital gains. Data are from the World Top Incomes Database, accessed at
http://topincomes.g-mond.parisschoolofeconomics.eu, on Aug. 5, 2014. - The Organisation for Economic Co-operation and Development (OECD), “Crisis Squeezes Income and Puts Pressure on Inequality and Poverty,” accessed at www.oecd.org/els/soc/OECD2013-Inequality-and-Poverty-8p.pdf, on Oct. 24, 2014.
- The OECD Gini coefficients include income from earnings, self-employment, and capital income, public cash transfers, income taxes, as well as deductions for social security contributions. Data are from OECD, Factbook 2014 (Paris: OECD, 2014), accessed at www.oecd-ilibrary.org/economics/oecd-factbook_18147364, on Aug. 20, 2014.
- Robert Lerman and Signe-Mary McKernan, “Benefits and Consequences of Holding Assets,” in Asset Building and Low-Income Families, ed. Signe-Mary McKernan and Michael Sherraden (Washington, DC: Urban Institute Press, 2008).
- Fabian Pfeffer, Sheldon Danziger, and Robert Schoeni, “Wealth Levels, Wealth Inequality, and the Great Recession,” Research Summary, Russell Sage Foundation (June 2014), accessed at http://web.stanford.edu/group/scspi/_media/working_papers/pfeffer-danziger-schoeni_wealth-levels.pdf, on Oct. 21, 2014.
- Realty Trac, “Record 2.9 Million U.S. Properties Receive Foreclosure Filings in 2010 Despite 30-Month Low in December” (Jan. 31, 2011), accessed at www.realtytrac.com, on Aug. 18, 2014.
- Janet L. Yellen, “Perspectives on Inequality and Opportunity From the Survey of Consumer Finances,” remarks at the Conference on Economic Opportunity and Inequality, Federal Reserve Bank of Boston, Oct. 17, 2014.
Related Posts
Webinar: Bridging Research and Policies: Enhancing Budgeting Processes for Africa's Demographic Dividend
PRB hosted a high-level webinar with budget experts, parliamentarians, and national directors to discuss the importance of the Demographic Dividend Sensitive Budgeting approach in enhancing budgeting processes across Africa.

Webinar: Where Is the Workforce? Understanding the U.S. Labor Shortage and Working Toward Solutions
PRB, the Critical Labor Coalition, and special guest former U.S.

American Community Survey Resources, Shortcuts, and Tools Workshop
Expert data users from PRB, the U.S.

Research Identifies New Strategies to Reduce Undercount of Young Children in U.S. 2020 Census
PRB identifies factors predicting where children under age 5 are more likely to be missed in the 2020 Census and develops a new undercount risk measure for young children.