The Generational Divide in the U.S.

Poverty among those ages 65 and older has been in a long-term decline with the expansion of Social Security and private pension systems while those in younger age groups lack the same financial protections (see Figure 4). Among children and working-age adults, poverty rates are close to all-time highs. In contrast, the poverty rate for those ages 65 and older has dropped fairly steadily over time, from 29 percent in 1966 to just 10 percent in 2013. The poverty rate for older Americans fell below the rate for children in 1974 and has remained lower since. In 2013, the child poverty rate (20 percent) was double the rate for older Americans (10 percent).18
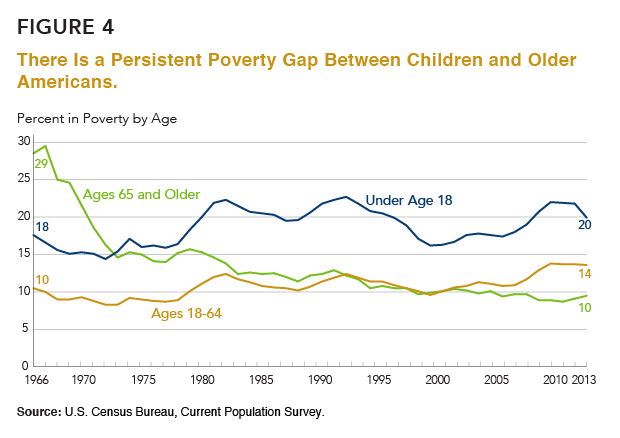
In September 2014, the unemployment rate for those ages 16 to 24 was 14 percent, more than three times the rate for those ages 55 to 64 (4 percent). Young adults are also more likely than those in older age groups to have been unemployed for six months or more during the recession. The result is a persistent poverty gap between younger workers and their children compared with older workers who are closer to retirement age.
Although poverty rates increased sharply during the recession, government transfers and tax credits have helped reduce the economic burden on poor and low-income families. An alternative poverty measure that accounts for additional household expenses and benefits—including programs such as the Earned Income Tax Credit and SNAP/food stamps—shows that antipoverty programs are cutting poverty by nearly 50 percent, from 29 percent to 16 percent.19
Under the alternative poverty measure, the gap between age groups is much smaller—but not eliminated entirely. The Supplemental Poverty Measure (SPM) showed that, in 2013, 16.4 percent of children under age 18 were poor, compared with 15.4 percent of those 18 to 64 and 14.6 percent of those ages 65 and older.20 High out-of-pocket health care expenses, such as payments for prescription drugs, help explain the relatively high poverty rate for older Americans under this alternative measure.
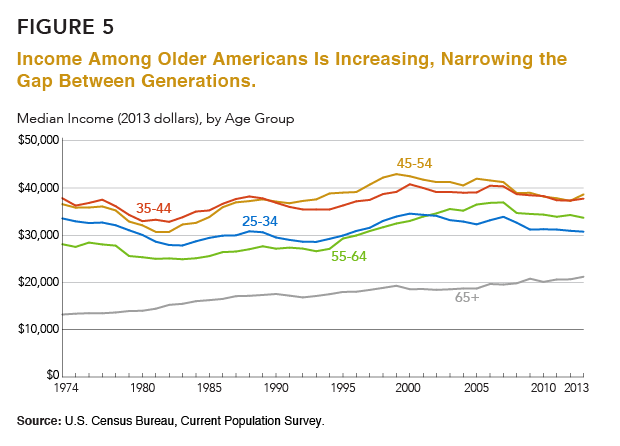
Income trends are similar to poverty trends, with the biggest gains among older Americans. Since 1974, median personal income has increased fairly steadily among those ages 65 and older, while income has fluctuated for those in younger age groups (see Figure 5). These diverging trends have resulted in a crossover in income among baby boomers ages 55 to 64 compared with people ages 25 to 34. Income among the older population has increased with the expansion of Social Security benefits and—since the mid-1990s—the rising share of older Americans in the labor force.21 Many older workers have delayed retirement, partly as a response to the recent economic downturn.22
Part of this decline may reflect young adults staying in school, but there has also been a sharp increase in young adults who are “idle”—neither employed nor in school. Among young men ages 25 to 34, 17 percent were idle in 2013, up from 14 percent in 2007, and the recent increase has been driven primarily by a decline in employment among African Americans and Latinos.23
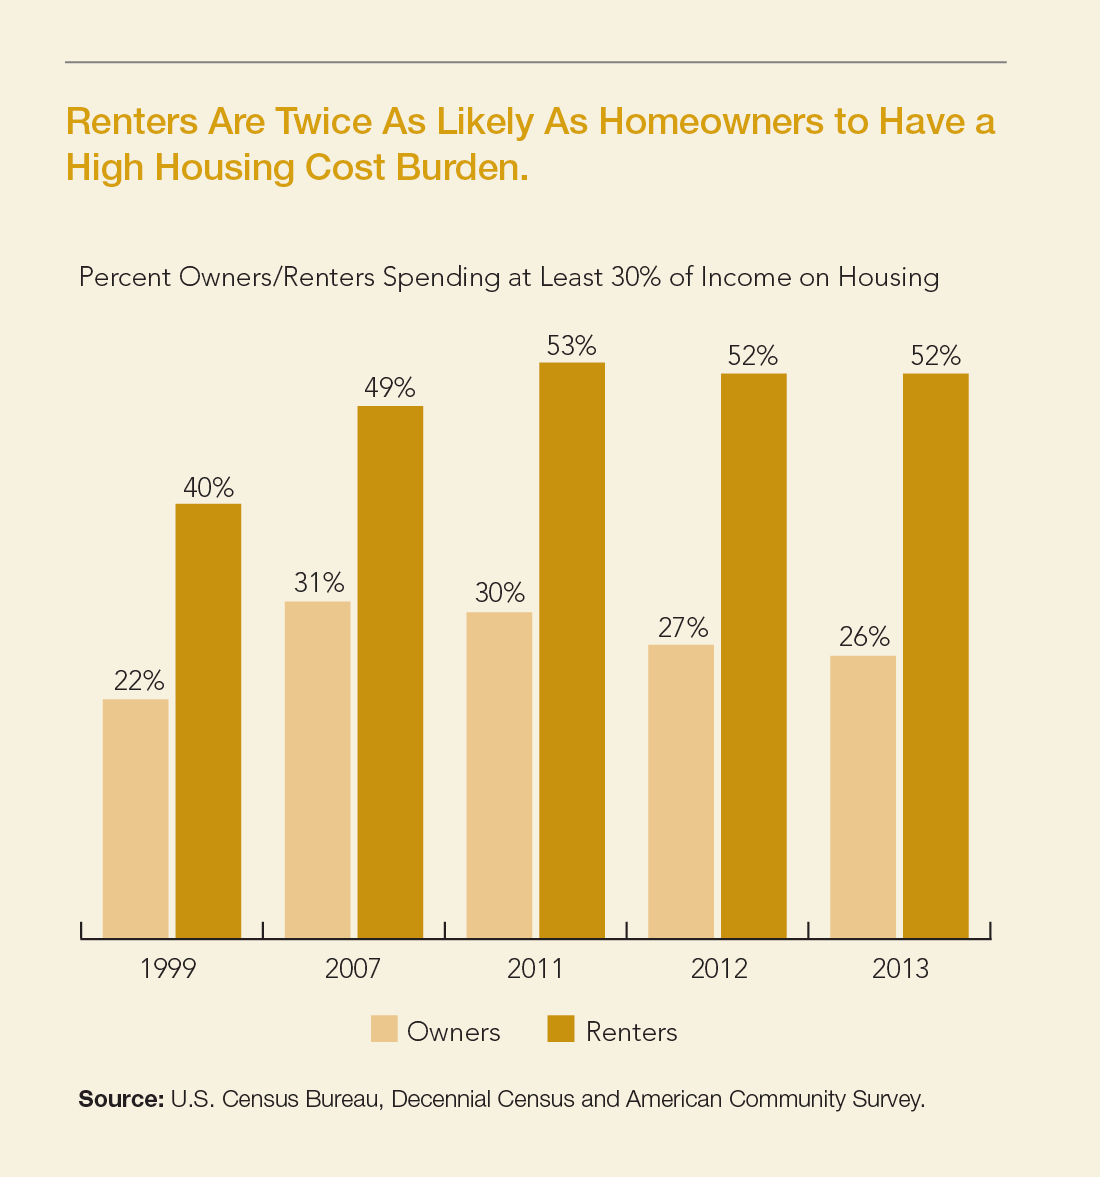
1. The U.S. Department of Housing and Urban Development considers housing “affordable” if total expenses (rent or mortgage payments, taxes, insurance, utilities, and other related payments) account for less than 30 percent of total household income.
2. C. Eugene Steuerle et al., “Lost Generations? Wealth Building Among Young Americans,” accessed at www.urban.org/publications/412766.html, on Sept. 20, 2014.
3. Jessica A. Bean, “Renters More Often Burdened by Housing Costs After Recession: Nearly Half of All Renters Spent Over 30 Percent of Income on Housing by 2010,” accessed at http://scholars.unh.edu/cgi/viewcontent.cgi?article=1168&context=carsey, on Sept. 20, 2014.
18. Although relatively few older Americans live below poverty, about 15 percent were below 125 percent of the poverty threshold in 2013.
19. Christopher Wimer et al., Trends in Poverty With an Anchored Supplemental Poverty Measure (2013), accessed at http://socialwork.columbia.edu/sites/default/files/file_manager/pdfs/News/Anchored%20SPM.December7.pdf, on Oct. 21, 2014.
20. Kathleen Short, “The Supplemental Poverty Measure: 2013,” Current Population Reports P60-251 (2014).
21. Michael V. Leonesio et al., “The Increasing Labor Force Participation of Older Workers and its Effect on the Income of the Aged,” Social Security Bulletin 72, no. 1 (2012).
22. Richard W. Johnson, Mauricio Soto, and Sheila R. Zedlewski, How Is the Economic Turmoil Affecting Older Americans? (Washington, DC: The Urban Institute, 2008).
23. Linda A. Jacobsen and Mark Mather, “A Post-Recession Update on U.S. Social and Economic Trends” (December 2011), accessed at www.prb.org/Publications/Reports/2011/us-economicsocialtrends-update1.aspx, on Aug. 20, 2014.
Related Posts
Webinar: Bridging Research and Policies: Enhancing Budgeting Processes for Africa's Demographic Dividend
PRB hosted a high-level webinar with budget experts, parliamentarians, and national directors to discuss the importance of the Demographic Dividend Sensitive Budgeting approach in enhancing budgeting processes across Africa.

Webinar: Where Is the Workforce? Understanding the U.S. Labor Shortage and Working Toward Solutions
PRB, the Critical Labor Coalition, and special guest former U.S.

American Community Survey Resources, Shortcuts, and Tools Workshop
Expert data users from PRB, the U.S.

Research Identifies New Strategies to Reduce Undercount of Young Children in U.S. 2020 Census
PRB identifies factors predicting where children under age 5 are more likely to be missed in the 2020 Census and develops a new undercount risk measure for young children.