Persistent Racial/Ethnic Gaps in the U.S.

Immigration has played a key role in these racial/ethnic changes, putting the United States on a path to become “majority minority” by 2043. But the population under age 18 is projected to reach this milestone much sooner—by 2018 or 2019, depending on future levels of immigration. Some of the fastest-growing groups—especially Latinos—are also the most vulnerable, lagging behind other groups on many measures of social and economic well-being.
The good news is that, over the long term, the economic divide between different racial/ethnic groups has narrowed. In 2013, there was a 13 percentage-point gap between the poverty rate of non-Hispanic whites (10 percent) and racial and ethnic minorities (23 percent). This represents a 7-percentage point decrease in the poverty gap since 1987, when the poverty rate for minorities was much higher, at 29 percent. While the poverty rate for whites increased slightly during this 25-year period, from 9 percent to 10 percent, the poverty rates for blacks, Latinos, and Asians declined (see Figure 6).
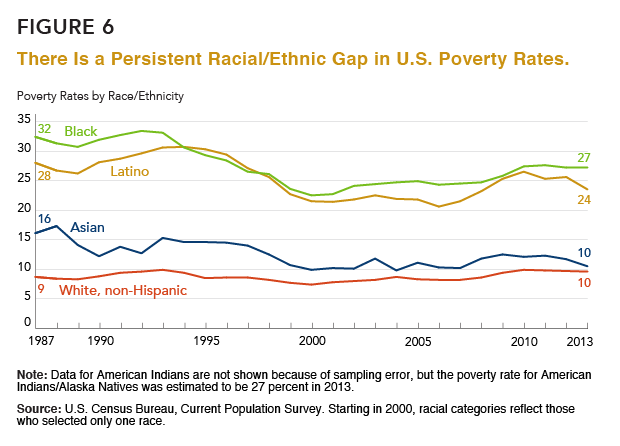
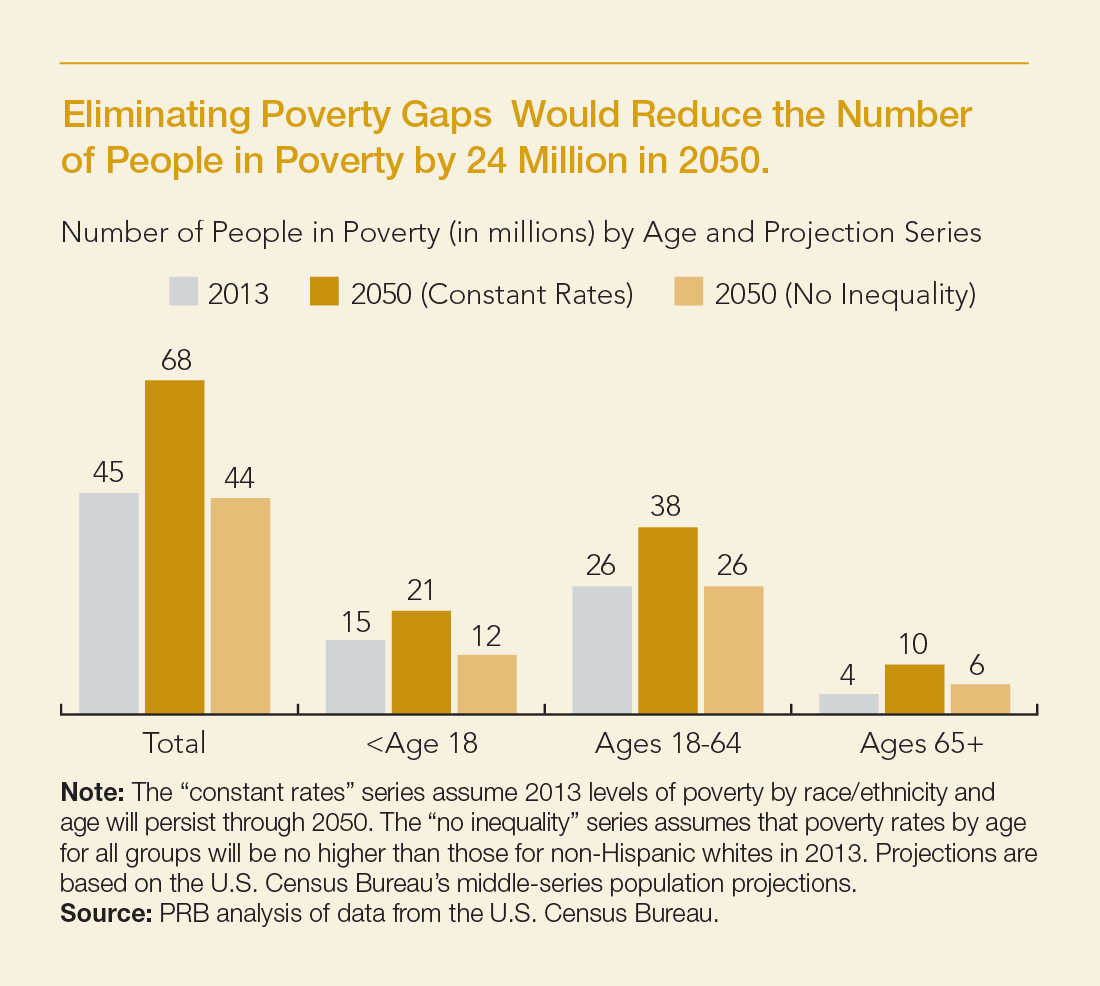
The bad news is that, in the short term, the recession contributed to a growing poverty gap between Asians and whites versus blacks and Latinos, who were disproportionately affected by job losses during the economic downturn. But the gap also reflects longer-term demographic changes in the U.S. population. Baby boomers, who are mostly white, are reaching retirement age and can receive Social Security income, while young children and their families are more likely to be racial/ethnic minorities and are at a higher risk of being poor. The racial/ethnic divide between generations may contribute to a growing economic gap across different racial/ethnic groups—with an aging white population eligible for benefits that help keep them above the official poverty line, and a younger and racially diverse population entering the workforce during a period of economic instability. If current disparities persist, the number of people living in poverty is projected to increase with the rising share of lower-income racial/ethnic minorities (see Box 3).
White households are also wealthier, on average, compared with black and Latino households. Data from the Survey of Income and Program Participation show that median net worth of whites was over $110,000 in 2011, compared with just $6,300 for black households and $7,700 for Latino households (see Figure 7).
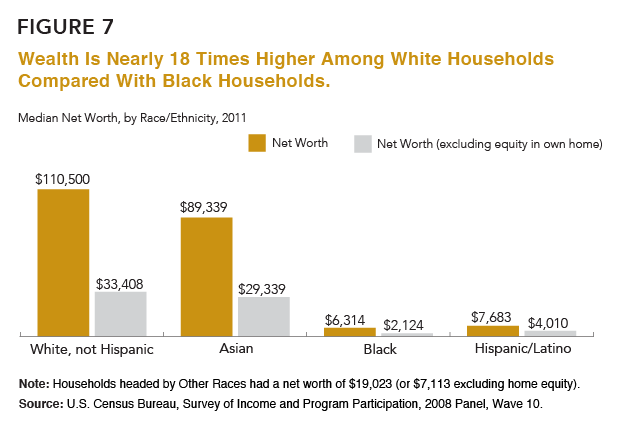
The wealth gap can be explained largely by differences in homeownership and home values between groups, as well as higher levels of private transfers of wealth (for example, through large gifts or inheritances) among whites compared with blacks and Latinos.24 With higher incomes, white families are able to purchase homes eight years earlier, on average, compared with black families, generating more equity and potential for growth in assets.25 Finally, although buying a home remains an important first step toward economic security, homeownership became a liability for many lower-income families during the recent recession. High interest rates, falling home prices, and the rise in foreclosures wiped out trillions of dollars of accumulated wealth.
NEXT: Women Making Progress, But Gaps Remain
POPULATION BULLETIN CHAPTERS
Introduction
The Backdrop: Rising Inequality
Where Poverty and Inequality Intersect
The Generational Divide
Persistent Racial/Ethnic Gaps
Women Making Progress, But Gaps Remain
Education: The Great Equalizer?
Looking Ahead
24. Signe McKernan et al., “Do Racial Disparities in Private Transfers Help Explain the Racial Wealth Gap? New Evidence From Longitudinal Data,” Demography 51, no 3 (2014): 949-74.
25. Thomas Shapiro, Tatjana Meschede, and Sam Osoro, The Roots of the Widening Racial Wealth Gap: Explaining the Black-White Economic Divide (Waltham, MA: Institute on Assets and Social Policy, Brandeis University, 2013).
Related Posts
Webinar: Bridging Research and Policies: Enhancing Budgeting Processes for Africa's Demographic Dividend
PRB hosted a high-level webinar with budget experts, parliamentarians, and national directors to discuss the importance of the Demographic Dividend Sensitive Budgeting approach in enhancing budgeting processes across Africa.

Webinar: Where Is the Workforce? Understanding the U.S. Labor Shortage and Working Toward Solutions
PRB, the Critical Labor Coalition, and special guest former U.S.

American Community Survey Resources, Shortcuts, and Tools Workshop
Expert data users from PRB, the U.S.

Research Identifies New Strategies to Reduce Undercount of Young Children in U.S. 2020 Census
PRB identifies factors predicting where children under age 5 are more likely to be missed in the 2020 Census and develops a new undercount risk measure for young children.