Paola Scommegna
Contributing Senior Writer

A new publication from the National Academies of Sciences, Engineering, and Medicine identifies eight key demographic trends shaping the rapidly growing U.S. population ages 65 and older—projected to nearly double from 51 million in 2017 to 95 million by 2060.
The publication, Future Directions for the Demography of Aging, reflects the perspectives of nearly two dozen National Institute on Aging-supported researchers who examine recent demographic shifts along with “positive changes and disquieting trends.” They also explore research and policies that could improve health and well-being among older adults in the United States.
Average U.S. life expectancy at birth increased steadily from 1950 to 2014, in large part reflecting a reduction in mortality at older ages (see Figure 1). Slight declines in life expectancy since 2014 reflect increases in most major causes of death, with women experiencing more deterioration related to chronic diseases (such as heart disease, diabetes, Alzheimer’s disease) than men, reports Eileen Crimmins of the University of Southern California. Opioid deaths, which occur at relatively young ages, have also contributed to overall trends.
Life expectancy in the United States lags behind that of many other high-income countries. Lower life expectancy in the United States reflects, in large part, premature deaths related to higher rates of tobacco use and obesity. Among the 40 countries with the highest life expectancies worldwide, the United States fell from 20th in 1980 to 40th in 2015.
Research shows that the gender gap in U.S. life expectancy is narrowing, and the gap between blacks and whites has shrunk somewhat. But much of the gains in life expectancy are concentrated among the most educated Americans, and large regional differences persist, Crimmins points out. Optimizing the health of the U.S. older population may depend less on medical progress and more on policies that reduce socioeconomic, racial, and geographic differences in health care access, she argues.
Between 2017 and 2060, the share of the older population that is non-Hispanic white is projected to drop by 22 percentage points, from 77 percent to 55 percent (see Figure 2).
As the older population becomes increasingly more diverse, racial/ethnic health disparities will play a greater role in shaping the overall health of the U.S. older population, report Robert A. Hummer and Iliya Gutin of the University of North Carolina at Chapel Hill. Asian Americans tend to have the best health profiles, followed closely by non-Hispanic whites. A substantial health gap separates Asian Americans and non-Hispanic whites from blacks, Hispanics, and Native Americans, who tend to fare worse on a range of health indicators. Racial/ethnic disparities in health are typically more pronounced among women than men.
Policymakers must focus aggressive attention on promoting socioeconomic equity and health care access across groups or large racial/ethnic health disparities will likely last well into the future, Hummer and Gutin argue.
People with a college degree or more have the best health and live the longest, while those with less than a high school diploma have the worst health and live shorter lives, Angela M. O’Rand and Scott M. Lynch of Duke University report. The differences increase by education level; the widest difference in life expectancy gains and losses are between college graduates and those without high school degrees (see Figure 3). Whites tend to have more pronounced differences by education level than blacks.
A large body of research finds that health and mortality differences in older adulthood are closely related to socioeconomic conditions and health in childhood, O’Rand and Lynch report. Evidence is building that the health and well-being of the older population reflects the cumulative effects of socioeconomic conditions over the entire life course. Understanding the ways that disadvantage in childhood “gets under the skin” and influences health and mortality in old age can help policymakers identify early investments (for example, in nutrition and education) and other interventions that can improve health in old age.
Rural areas have the highest concentration of older people and are aging faster than urban areas, report Kathleen Cagney of the University of Chicago and Erin York Cornwell of Cornell University. The median age in rural areas is 51 compared with 45 in urban areas. Older people living in rural locations may have access to fewer health care services and face longer travel times to obtain care.
In metropolitan areas, suburban counties are aging more rapidly than urban counties (see Figure 4). Suburbs tend to share characteristics that make aging in place challenging, such as limited public transportation, businesses clustered rather than dispersed, and single-family two-story homes, which can be difficult for aging adults to maintain and navigate. Many suburban areas are also experiencing declining infrastructure and rising poverty.
Analysis of data from the National Social Life, Health, and Aging Project shows that living in a disadvantaged area is related to poor health even when other factors are taken into account, Cagney and York Cornwell report. People in neighborhoods with a greater share of low-income residents or housing in disrepair; more crime, litter, odor, or noise; or limited social ties among residents tend to have more depressive symptoms. New forms of data can help policymakers and planners understand the impact of location on people’s health in old age. For example, data on crime, potholes, and even rat sightings can now be linked to measures of health and well-being.
Spouses and adult children provide most of the care that enables older people to live independently and avoid costly nursing homes. But declines in marriage, increases in divorce, and lower fertility mean that more baby boomers will reach age 65 without a spouse or adult child to rely on for care, reports Emily M. Agree of Johns Hopkins University (see Figure 5). Divorce and remarriage are associated with “less contact, less support, and poorer quality relationships” among parents and adult children than long-term intact marriages, studies show. Adult children feel less obliged to care for elderly stepparents or fathers with whom they did not reside during childhood.
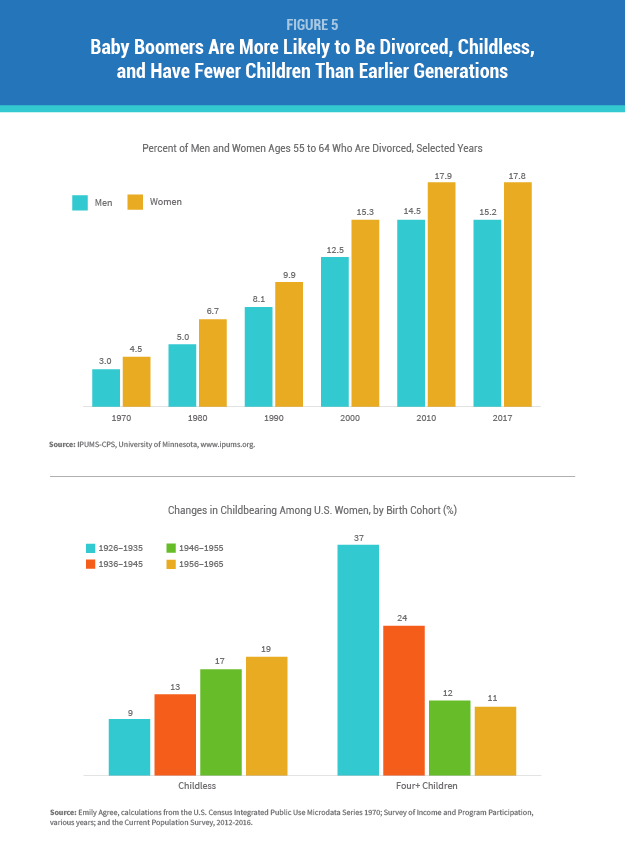
Agree recommends that research and policies related to family caregiving focus on the emerging roles of siblings, friends, cohabiting partners, and more distant relatives. Lower-income older adults are especially vulnerable, not only because they are more likely to have unstable and varied partnerships, but also because they often serve as primary caregivers for grandchildren, she argues.
Labor force participation rates have risen for both men and women over the past 20 years (see Figure 6). According to Courtney C. Coile of Wellesley College, primary drivers of this trend include:
At the same time, more U.S. workers are leaving the workforce early using Social Security disability insurance (DI). About 16 percent of U.S. workers received DI before they were eligible for Social Security benefits in 2016, up from 11 percent among working men and 8 percent among working women in 1980, Coile estimates based on Social Security Administration data. Changes in medical eligibility criteria, women’s labor force participation, and economic factors—rather than increases in disability levels—primarily explain this trend, she reports.
Evidence shows many older workers are now retiring gradually, switching to a different job, part-time work, or self-employment, according to Coile. Blacks, Hispanics, and those with lower levels of education are less likely to be working at older ages than their white or more-educated peers.
Researchers and policymakers should focus on the experience of those with less education who are “known to retire earlier, have shorter life expectancies, and be more likely to use DI,” Coile argues. Changes to Social Security and other programs that create incentives to work longer may have unanticipated impacts on the well-being of those unable to continue working.
As a group, the baby boom generation is better educated than previous generations but has higher rates of obesity and mobility-related impairments, reports Vicki Freedman of the University of Michigan. The likelihood of disability increases with age: The National Health and Aging Trends Study (NHATS) shows that just over 20 percent of adults ages 65 to 69 have either poor capacity (physical limitations, poor vision, poor hearing, or probable dementia), while more than 80 percent have poor capacity by age 90 (see Figure 7).
A growing share of older adults—roughly one in four—successfully accommodates losses in physical capacity and continues to carry out daily activities without difficulty or help from others by using assistive devices such as canes, walkers, and grab bars, NHATS data show. Behavioral changes such as using devices or modifying the physical environment can determine whether living longer also means remaining independent longer, Freedman points out.
Older minority women are especially disadvantaged, however. They are less likely to successfully accommodate their limitations by using assistive devices and are two to three times more likely than non-Hispanic white women to receive assistance with self-care, mobility, or household activities, Freedman’s analysis of NHATS data finds. Better understanding of late-life disablement can help policymakers identify public health interventions that can maximize independent function, extend quality of life, and minimize nursing home use.
The share of the older population with dementia has fallen over the past two decades. This downward trend is likely the result of better brain health related to higher levels of education, suggests analysis of the U.S. Health and Retirement Study and other studies (see Figure 8).
Researchers question whether dementia prevalence can continue to decline in tandem with high rates of obesity and diabetes, which are both cardiovascular risk factors for dementia. A complex set of factors influence a person’s likelihood of developing dementia, including genetics, early-life environment and education, and features of late-life settings such as cognitive stimulation and social networks, reports Kenneth M. Langa of the University of Michigan.
Research has identified large and growing disparities in dementia risk by socioeconomic status and race/ethnicity, which could slow progress in cutting dementia levels, Langa notes. A better understanding of the causes of the recent decrease in dementia prevalence can help shape interventions that could contribute to further declines, with tremendous implications for older Americans, their families, and the costs of public programs. Policies that address growing disparities in dementia risk by ensuring equity of access to the resources and environments that contribute to healthy cognitive function are crucial to the overall health of the U.S. older population, he argues.

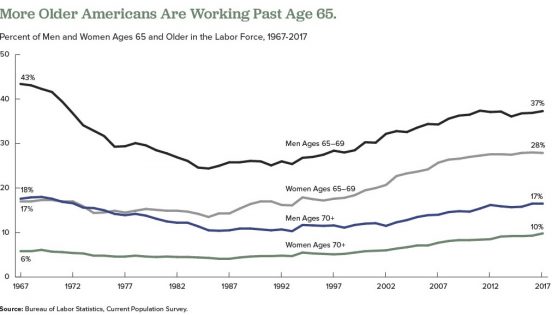
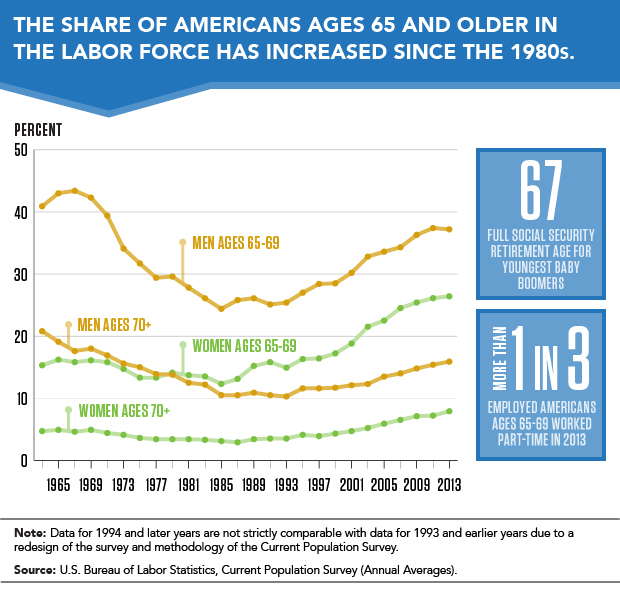
A growing share of Americans are working beyond their 65th birthday, a reversal that began in the mid-1980s. Labor force participation rates for men ages 65 to 69 began to drop in the mid-1960s, bottoming out at 24 percent in 1985, but have risen to about 37 percent in 2017. Among women ages 65 to 69, the labor force participation rate increased from 18 percent in 1964 to 28 percent in 2017.
Researchers have identified a variety of factors influencing older people’s decisions to postpone retirement over the past 25 years, including the following:
But researchers disagree on whether the upswing in the share of employed older people will continue as more members of the baby boom generation reach traditional retirement ages.
Some analysts argue that most of the factors listed above have played themselves out. Alice Munnell of Boston College points out that defined-benefit pensions and employer-provided retirement health insurance are almost entirely absent from the private sector; educational attainment has plateaued among the those now approaching retirement age; gains in health and longevity related to declines in smoking and improved medical care are being offset by increases in obesity; and blue-collar jobs have been rare for a generation.2
But other researchers argue that high levels of debt remain a powerful force that may contribute to more people postponing retirement. Annamaria Lusardi of George Washington University, Olivia Mitchell of University of Pennsylvania, and Noemi Oggero of the University of Turin find a “dramatic increase” in the amount of debt carried by older Americans nearing retirement ages, mainly the result of “having purchased more expensive homes with smaller down payments than previous generations.”3
They use data from the nationally representative Health and Retirement Study (HRS), an ongoing survey of older Americans, and the National Financial Capability Study (NFCS), a national sample of adults surveyed on financial planning and decisionmaking. Their analysis focuses on the debt of Americans ages 56 to 61 in 1992, 2004, and 2010.
They show that the median debt-to-income ratio (the percentage of income that goes to debt payments) climbed from 14 percent in 1992 to 45 percent in 2004, and to 50 percent in 2010. The median amount of debt rose sharply between 1992 and 2004, from $6,800 to $31,200 in 2015 dollars.
Their findings also indicate that older adults ages 62 to 66 in 2010 carried more debt than their counterparts from earlier years, though they carried less debt than adults ages 56 to 61 in 2010. “While people’s financial situation does seem to improve with age, the older group is still financially distressed,” they write. “Close to half (47 percent) of those ages 62 to 66 are worried about running out of money in retirement and just over half (55 percent) had planned for it [their retirement].”
In another study using HRS and NFCS data, Lusardi and Mitchell find that women in their 50s and 60s in recent generations are more likely to say they plan to work to older ages than their peers from the early 1990s.4 Respondents with plans to delay retirement tend to have higher levels of education, higher divorce rates, and fewer children, but “household finances also play a key role” in retirement decisions, they report. “Older women today have more debt than previously and are more financially fragile than in the past,” they write.
1 U.S. Bureau of Labor Statistics, “Table 2. Employed Full- and Part-Time Workers by Disability Status and Age, 2016 Annual Averages,” last modified June 21, 2017, accessed at www.bls.gov/news.release/disabl.t02.htm, on Feb. 14, 2018.
2 Alicia Munnell, “The Average Retirement Age—An Update,” Center for Retirement Research, Boston College, No. 15-4 (March 2015).
3 Annamaria Lusardi, Olivia S. Mitchell, and Noemi Oggero, “Debt and Financial Vulnerability on the Verge of Retirement,” National Bureau of Economic Research Working Paper No.23664 (Aug. 2017).
4 Annamaria Lusardi and Olivia S. Mitchell, “Older Women’s Labor Market Attachment, Retirement Planning, and Household Debt,” National Bureau of Economic Research Working Paper No. 22606 (Sept. 2016).

Births to teenage mothers in the United States have hit record lows for eight successive years, but experts are quick to point out that U.S. teen birth rates are far above those in other high-income countries.
Provisional data for 2016 show that the U.S. teen birth rate was 20.3 births per 1,000 females ages 15 to 19. This rate is 9 percent lower than in 2015 (22.3 per 1,000) and 51 percent lower than in 2007 (41.5 per 1,000).1 But other wealthy countries have much lower rates: United Kingdom, 13.9 per 1,000; Canada, 9.4 per 1,000; France, 8.8 per 1,000; and Sweden, 5.7 per 1,000.2
Because teenage mothers and their children face elevated risks of poverty and health problems, preventing unplanned teenage births is a U.S. public policy priority. New research on the dynamics of U.S. early childbearing underscores the importance of effective contraception and suggests that teenagers who have unintended pregnancies are more likely to be in violent, conflictual, and unstable relationships than their peers. Teenagers’ perceptions of the costs and benefits of having a child early also appear to play a role in unintended childbearing.
Increased contraceptive use by teenagers appears to be driving the recent decline in teen birth rates, a recent article in the Journal of Adolescent Health shows.3
But the contraceptive-use patterns and dynamics of low-income young women’s relationships may put them at greater risk of unintended pregnancies, a University of Michigan study in the journal Demography suggests.4
Yasamin Kusunoki, Jennifer Barber, Elizabeth Ela, and Amelia Bucek find that poor women have fewer but longer relationships, use contraceptives less frequently, and use less effective methods than women from more advantaged backgrounds.
The researchers used data from the Relationship Dynamics and Social Life (RDSL) study, which identified a random sample of 18-to-19-year-old Michigan women and interviewed them weekly on their relationships, sexual activity, and contraceptive use for more than two years. The current analysis is based on almost 850 racially diverse participants from the study’s first year.
Higher rates of unintended pregnancy among young black women in previous studies have fueled speculation that black women may engage in riskier sexual and contraceptive behaviors than their white peers. In fact, young women from both races used contraception with similar frequency and consistency during the study period, and black women had sex less frequently than their peers.
The Michigan researchers also found that although black women did not differ from white women in the number of different contraceptive methods used, they actually had fewer method switches than white women. (Method switches increase the risk of unintended pregnancy.)
After accounting for socioeconomic disadvantage, the main significant difference between black and white women was contraceptive method choice. Black women used oral contraceptive pills less often and relied on condoms more often than their white counterparts.
The perceived side effects of hormonal contraceptives and negative or limited experiences with the health care system may contribute to black women’s greater reliance on condoms, Kusunoki suggests. Condoms are highly effective for sexually transmitted infection prevention, she argues, but relying on condoms alone for pregnancy prevention likely contributes to the higher risk of unintended pregnancy among black women.
The intimate relationships of young women in their late teens that lead to unintended pregnancy tend to be more conflictual, unstable, and violent than those of their peers, find University of Michigan’s Barber, Kusunoki, Heather Gatny, and Robert Melendez, in a study also based on RDSL data.5
Relationships that lead to pregnancy are more serious (longer lasting and more likely to involve cohabitation) but also experienced higher levels of conflict and violence than relationships that did not lead to pregnancy. Specifically, the pregnant couples were five times more likely to have broken up and gotten back together, and the pregnant women were four times more likely to report that their partner had physically assaulted them (see figure).
By contrast, young pregnant women’s other relationships that did not lead to pregnancy were more like those of their peers on measures of length, seriousness, instability, and conflict.
Interpersonal skills programs could help couples “avoid risky situations” by, for instance, using contraception when having make-up sex after a breakup and not fighting when either partner is drunk or high, suggests William J. Dougherty of the University of Minnesota.6
Barber, Kusunoki, Gatny, and Melendez find that the men who fathered pregnancies were older, less educated, and more likely to have children with other partners than either the partners of women who did not become pregnant or the pregnant women’s other partners.
“In other words, the men who impregnated women were generally more disadvantaged and had less promising life prospects than all the other men [in relationships with women in the study],” observes Leslie J. Harris of the University of Oregon.7
The researchers also examined the women’s intimate relationships before and after pregnancy, finding that these relationships deteriorated, either breaking up or becoming less serious, as well as becoming more violent following the pregnancy.
Only about 10 percent of the pregnant women previously reported a strong desire to become pregnant, the researchers note. “If the pregnancy could have been avoided in those relationships that are most serious, unstable, and conflictual, those young women may have been in better relationships when they became mothers,” they point out. Contraceptive access for women who want to delay pregnancy is crucial for the well-being of both mothers and their children, they argue.
Additionally, they suggest that “mandating father involvement is not always in the children’s best interest if it increases contact with violent fathers, or increases violence between their parents.” Communication and co-parenting skills training are “more appropriate for relationships that are not violent,” they write.
Further analysis of the RDSL data shows that violent relationships may contribute to unplanned pregnancies by influencing contraceptive use patterns.8 Young women who experienced physical intimate partner violence (IPV) in their current relationship (recently or in the past) were less likely to use contraception than other similar young women. Those who had experienced IPV tended to use condoms inconsistently. These findings are consistent with previous research highlighting the difficulty of negotiating contraceptive use in violent relationships.
The researchers suggest that service providers and program planners “identify specific relationships, as well as specific periods in the relationship,” where the risk of both violence and unplanned pregnancy are high. Based on these findings they recommend that clinicians “discuss young women’s specific relationship experiences, and do so repeatedly, as relationships change across time.”
Perceiving that becoming pregnant and having a child carries more positive than negative personal consequences may also shape whether a teenager has an unintended pregnancy, another study based on the RDSL data finds.9
While a clear majority of the teenagers interviewed at the beginning of the study told the researchers that they did not want to become pregnant, 20 percent perceived that the benefits of an early pregnancy outweighed the costs. Sarah Hayford of Ohio State University and Karen Benjamin Guzzo of Bowling Green State University, joined Kusunoki and Barber in conducting this analysis.
The 18- and 19-year-old women who had the most positive perceptions of a pregnancy’s impact on their personal lives and of their friends’ approval were most likely to become pregnant during the study.
These young women did not see parenthood as conflicting with other goals, such as completing postsecondary education or having the resources to acquire consumer goods, the researchers note.
Young women’s very “personal evaluation of the consequences of childbearing and how a child would fit in to their lives” may contribute to how consistently they use contraception and may help explain unintended pregnancy, the researchers suggest.
In a related study, researchers examined levels of both desire and disinclination for a pregnancy (using a scale of zero to five) among the RSDL participants.10 Young women in serious relationships, who are depressed, and who are not pursuing postsecondary education have more desire for pregnancy and less disinclination, they find. Additionally, young women who grew up in disadvantaged settings—whose households received public assistance when they were children—are most likely to desire a pregnancy and less likely to want to avoid one.
Social environments in which early unintended pregnancies are less stigmatized play a role in shaping attitudes, the researchers suggest. For example, young women with teenage mothers are more likely to desire early pregnancy than their otherwise similar peers. Thus, as these studies and analyses show, an understanding of the dynamics of teenagers’ intimate relationships and attitudes is essential to any policy aimed at preventing teenage births.
This article was produced under a grant from the Eunice Kennedy Shriver National Institute of Child Health and Human Development (NICHD). The work of researchers from the following NICHD-funded population research centers was highlighted in this article: Guttmacher Institute, University of Michigan, Ohio State University, University of Texas at Austin, and Bowling Green State University. A portion of an article by Jared Wadley, University of Michigan, was adapted for part of this piece; used with permission.
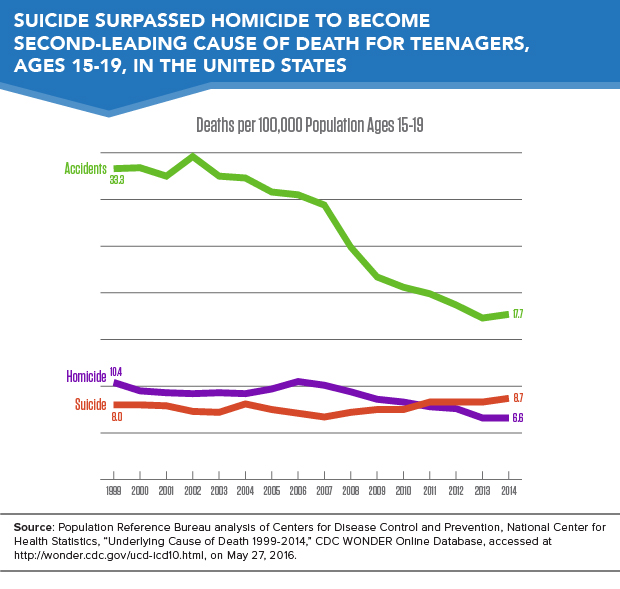
Suicides have become the second-leading cause of death among teenagers in the United States, surpassing homicide deaths, which dropped to third on the list (see Figure 1). The teenage suicide rate increased from 8 deaths per 100,000 in 1999 to 8.7 deaths per 100,000 in 2014.
Higher suicide rates are driven in part by changes in the method of suicide. Suffocation, which includes hanging and strangulation, and is highly lethal, increased as a method of suicide. A rising suicide rates among teenage girls is driving the higher overall suicide rate.
Despite the rise in suicide, the overall mortality rate among teenagers has fallen from 68.6 deaths per 100,000 in 1999 to 45.5 deaths per 100,000 in 2014, as a result of declining homicide and traffic accident death rates during the past 15 years. Data are based on Population Reference Bureau (PRB)’s analysis of mortality statistics from the U.S. Centers for Disease Control and Prevention (CDC).
A higher rate of suicide attempts does not appear to be driving the increasing teenage suicide rate. Data from the Youth Risk Behavior Surveillance System show that among high school students, the prevalence of attempting suicide remained flat from 1999 to 2013.1 Rather, suicide attempts today appear more likely to result in death because teenagers have shifted to more lethal methods of self-harm—a trend that has alarming implications.2
The frequency of suffocation (a particularly lethal form of self-harm, which includes hanging) as the reported cause of suicide-related death among teenagers nearly doubled over the past 15 years. The share of teenage suicides due to suffocation rose from more than one-quarter (27 percent) in 1999 to nearly one-half (45 percent) in 2014.
Both teenage boys and teenage girls are increasingly likely to commit suicide by suffocation. From 1999 to 2014, the overall suicide rate among teenage girls increased by 1.5 deaths per 100,000, while the suffocation-related suicide rate increased by 1.4 deaths per 100,000 (see Figure 2). In other words, the increased rate of suffocation deaths accounted for virtually all of the increase in the suicide rate among teenage girls.
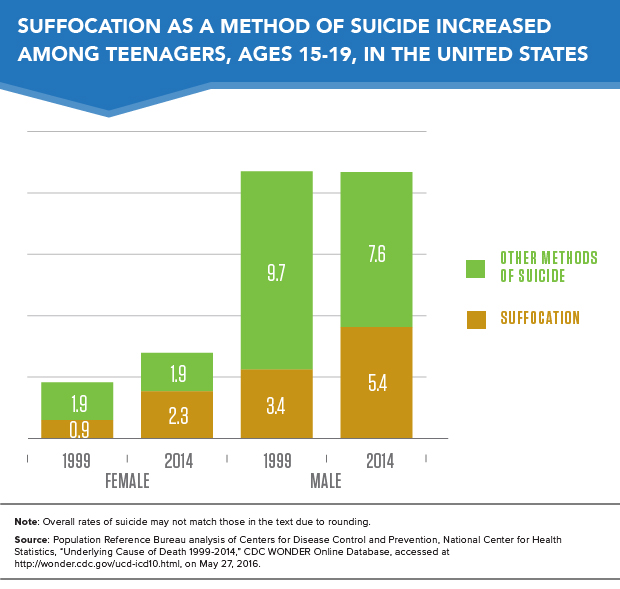
Among teenage boys, the suicide rate by suffocation increased by almost 60 percent across this period, but their overall suicide rate remained stable at 13 deaths per 100,000 due to a drop in the rate of suicide by other methods including firearms.
Increasing use of highly lethal methods of self-harm presents a significant public health challenge. The reasons teenagers are using more lethal methods to attempt suicide remain unclear. Some researchers hypothesize that social contagion—more exposure to suicide could induce at-risk individuals to attempt suicide—may be to blame, but there are no definitive answers. More research is needed to understand the underlying factors behind this trend. In the meantime, suicide prevention programs should continue working to address root causes, while also recognizing that the risk of death from a suicide attempt is rising.
The suicide rate for teenage boys was three times the rate for teenage girls in 2014. However, the rise in the overall teenage suicide rate between 1999 and 2014 was driven by the 56 percent increase in the suicide rate among teen girls—from 2.7 deaths per 100,000 to 4.2 deaths per 100,000.
Suicide rates rose for girls in every racial/ethnic category between 1999-2001 and 2012-2014.3 Rates rose fastest for American Indian and Alaska Native girls (60 percent increase), and rates rose by more than 50 percent for both non-Hispanic Black/African American and non-Hispanic white teenage girls.
Among boys, only non-Hispanic Black/African American teenagers had lower suicide rates in 2012-2014 than in 1999-2001. As with girls, rates rose fastest for American Indian and Alaska Native teenage boys, and rates also increased for non-Hispanic white boys. Rates remained stable for Asian/Pacific Islander and Hispanic teenage boys.
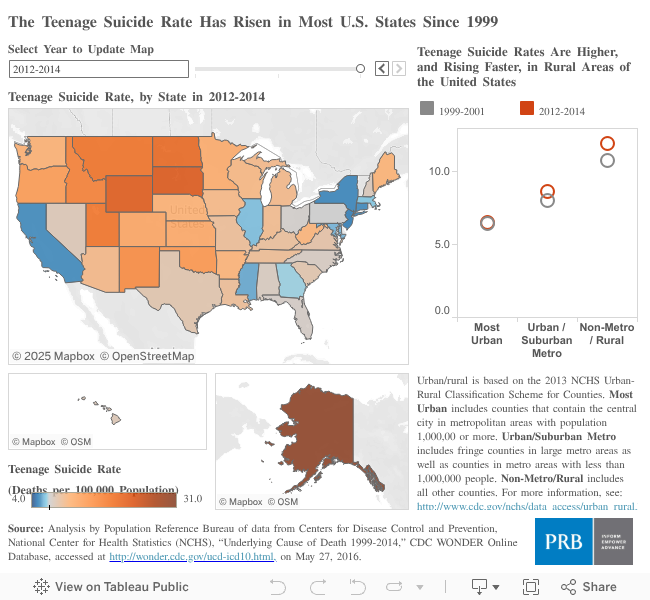
Overall, the highest teenage suicide rates are among American Indian and Alaska Native teenagers. This may be partially explained by their greater concentrations in rural areas, where the risk of suicide is much greater (see map). Yet, even in rural areas, American Indian and Alaska Native teenagers have extraordinarily high rates of suicide, especially as compared with other racial/ethnic groups living in those areas.
Suicide rates are higher in rural areas for a variety of reasons including social isolation, prevalence of firearms, economic hardship, and limited access to mental health and emergency health care services.
The teenage suicide rate in rural areas is nearly double the rate in highly urbanized areas (11.9 deaths per 100,000 in rural areas and 6.5 deaths per 100,000 in the most urban counties).4 All of the states with the highest rates of teenage suicide—Alaska, South Dakota, Wyoming, and North Dakota—have relatively high proportions living in rural areas (see map). Conversely, the four states with the lowest teenage suicide rates—California, Connecticut, New Jersey, and New York—have predominantly urban and suburban populations.
PRB’s World Population Data Sheet is an annual report on the world’s demographic, health, and environmental progress and challenges.
This year’s data sheet provides detailed information on 16 population, health, and environment indicators for more than 200 countries, and has a special focus on “Progress and Challenges.”
Explore Data Visualizations and Data Sheet
For three of the indicators—infant mortality, total fertility rate, and life expectancy—we have included data from 1970 and 2013 to show trends over time. The environment indicator—carbon emissions—shows data from 1990 and 2012.
We have updated world population by region and country (see Regional Highlights below). We have highlighted examples of the incredible achievements over the last several decades: the proportion of people living in poverty has declined, infant mortality has dropped remarkably, and fewer mothers are dying in childbirth. But progress has been uneven. Pockets of high infant and maternal mortality persist within many countries, and there are still more than 1 billion people living in extreme poverty.
This summer, the United Nations community is discussing the “post-2015 Development Agenda,” a global framework setting goals on sustainable development and poverty eradication that will replace the Millennium Development Goals. See progress thus far on a few of these goals.
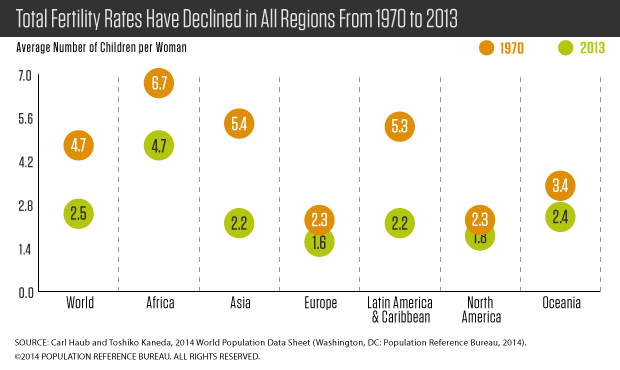
In much of the developing world, demographic change has contributed to economic growth and reductions in poverty. Over the last 40 years, women are having fewer children, from 4.7 children per woman in 1970 to an average of 2.5 children today. Total fertility rates (TFRs) range from 1.1 in Taiwan to 7.4 in Niger.
In 1970, just under one-half (48 percent) of the world’s population was younger than 20, a nearly equal percentage was ages 20 to 64, and only 5 percent was 65 and older. Today, as a result of lower fertility rates and longer life expectancy, the share of global population under age 20 has dropped to about 35 percent, the population between ages 20 and 64 represent 58 percent, and ages 65 and older represent 7 percent. Asia, Latin America, and Oceania all have population age structures similar to the global averages. In 1970, Europe and North America were similar to the world average today, and their slower growth has resulted in a current population much older than the global average. Africa’s population is at the other end of the age spectrum—Africa’s current youthful age structure is much like the global average in 1970.
World population is expected to rise from 7.2 billion today to 9.7 billion by 2050, and virtually all this future growth will be concentrated in the world’s less-developed countries, especially in Africa.
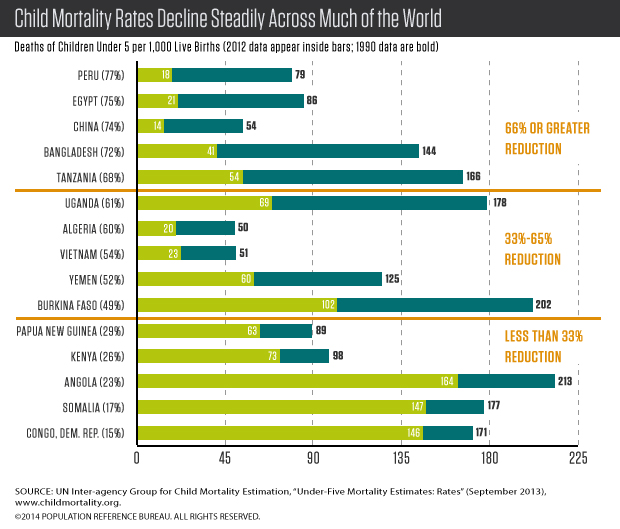
The child mortality rate is the number of deaths of children under 5 per 1,000 live births. The United Nations set a target for Millennium Development Goal 4: to reduce by two-thirds, between 1990 and 2015, the under-5 mortality rate. Across the globe, many countries have made significant progress in reducing child mortality. For example, child mortality in Bangladesh declined from 144 child deaths per 1,000 live births to 41, a reduction of 72 percent. The global rate in 2012 was almost one-half its 1990 rate, declining from 90 deaths per 1,000 live births to 48 in 2012. Despite these gains, many countries will fall short of the MDG target, and further progress is needed across much of sub-Saharan Africa and South Asia.
The maternal mortality ratio is the number of maternal deaths per 100,000 live births. Globally this ratio dropped from 380 deaths to 210 deaths per 100,000 live births between 1990 and 2013. Some countries have made remarkable progress. For example, maternal mortality in Rwanda declined from 1,400 maternal deaths per 100,000 live births to 320, a reduction of 77 percent. Even with these drops, many countries have not yet met the UN target for Millennium Development Goal 5: to reduce, by three-quarters, between 1990 and 2015, the number of maternal deaths. While the ratio has declined rapidly in some countries, many others have made insufficient progress. The ratio for all developing countries is 14 times higher than for developed countries: 230 maternal deaths per 100,000 live births vs. 16, and further efforts are needed to end these preventable maternal deaths.

Creating sustainable economic development to meet human needs without sacrificing the environment is challenging. The great strides made over the last 40 years have come at a cost to the environment. Many indicators of the planet’s health have continued to decline, with further losses of biodiversity and little progress in reducing emissions and slowing climate change.
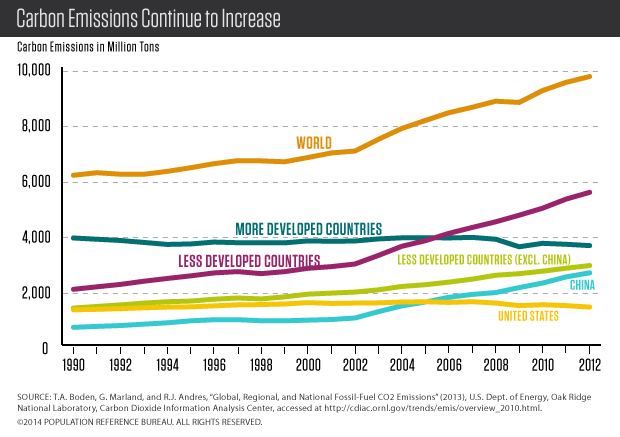
Carbon emissions continue to increase for the world. Since 1990, global carbon emissions increased more than 50 percent. Emissions in the United States and other developed countries remain very high. The growth in emissions in China and the less developed countries is particularly striking and has been one of the unfortunate consequences of the incredible economic and human development progress.
Africa
By 2050, Africa is projected to increase to 2.4 billion from 1.1 billion today, making it the region with the largest population growth. But this projection should be treated very cautiously, because it assumes that birth rates will decline smoothly in all African countries in much the same way as birth rates declined in other regions. And that assumption, in turn, assumes that the effective use of family planning will spread in Africa. In most countries, declines in birth rates have been very slow or even nonexistent. And even with declining birth rates, sub-Saharan Africa’s population will continue to grow at a fairly rapid pace after 2050 as it will still be quite youthful.
Asia
Asia is home to 60 percent of global population. China and India account for more than half of Asia’s total population. China’s total fertility rate is a very low 1.6 children per woman. It is hard to predict how much impact the relaxing of its strict “one-child” policy in 2013 will have on China’s population. In India, the TFR has fallen from about 5.5 children in 1970 to 2.4 today. But doubts about the future course of the birth rate in India’s heavily populated and impoverished northern states make projections challenging. Nonetheless, India is projected to pass China in population size in about 15 years, becoming the world’s most populous country, about 1.5 billion people.
Latin America/Caribbean
Population growth has been in slow decline in this region, largely due to a lower birth rate in Brazil and Mexico, the two countries that account for more than half of the region’s population. In Brazil, women average 1.8 children, while in Mexico the average is about 2.2. Among developing regions, Latin America/Caribbean has the highest prevalence of family planning at 73 percent for all methods and 67 percent for modern methods among married women. The region’s population is projected to increase from 618 million today to 773 million in 2050. Approximately three-quarters of a million people (on a net basis) leave the region for North America and Europe each year.
North America
The United States and Canada have rather low TFRs: Canada at 1.6 and the United States at 1.9. In the United States, fertility declined during the recent economic recession, a decline that was especially sharp among Hispanics. Immigration is a significant engine of population growth in both countries.
Europe
Europe’s birth rate has plummeted to an unexpectedly low level in the past few decades. Europe’s population of 740 million is projected to decrease to 726 million by 2050, but even that lower number depends on whether immigration helps to stall a more-rapid decline. Today, women in Europe average only 1.6 children, compared to 2.3 in 1970. This low fertility has created unprecedented aging. In Europe, only 16 percent of the population is below age 15. Compare that to 41 percent in Africa and 25 percent in Asia. Europe’s population ages 65 and older is projected to rise to 27 percent by 2050.
Oceania
In Australia and New Zealand, continued growth from higher birth rates and immigration is expected. Australia’s TFR is 1.9; New Zealand’s, 2.0. Australia’s population of 24 million is expected to increase to 36 million by 2050; New Zealand’s population will increase from 4.3 million to 5.5 million.
A growing share of Americans are working beyond their 65th birthdays, a reversal that began about 25 years ago (see figure). This upswing appears likely to continue as more members of the baby-boom generation (born between 1946 and 1964) reach traditional retirement ages.
A variety of financial incentives are keeping older people in the labor force. These include changes in the Social Security program that gradually raise the age when retirees can begin to receive full benefits to 67 for the youngest baby boomers. Also key are changes in the types of employer-sponsored retirement plans: Employers have shifted away from defined-benefit pensions that provide guaranteed payouts, often replacing them with 401(k) plans with payouts that depend on how much the retiree saves and how well the investments do.
Working longer is one way to enter retirement more financially secure, says Matthew Rutledge, research economist at the Center for Retirement Research at Boston College (CRR).
A recent CRR report identified a number of additional trends influencing decisions to postpone retirement over the past 25 years:
But will these factors continue to influence an ever-larger proportion of younger baby boomers, contributing to a further rise in the share of people working past 65?
Analysts disagree, according to Rutledge. “Some analysts believe that most of those factors have fully played themselves out,” he says. They argue that defined benefit pensions and retiree health insurance are almost entirely gone from the private sector, educational attainment has plateaued among the cohorts approaching retirement age, increases in obesity have offset other gains in health and longevity (like the decline of smoking and improved medical care), and blue-collar jobs have been rare for a generation.
But other analysts point to reasons these trends may continue to contribute to more people postponing retirement. For example, employers are not offering defined benefit pensions and retiree health insurance to more recent employees, but the number of long-tenured employees able to count on benefits from the old system is still significant and will continue to shrink, he notes.
In Rutledge’s view, analysts have not fully appreciated the profound effects the Great Recession is having on retirement decisions and will have for many years to come. “Financial markets have recovered, but if investors had to cash out to support themselves, or got skittish and bailed out, they may have missed out on that recovery, which means they may not have the financial resources to stop working,” he says. Additionally, workers who “experienced a long jobless spell but were lucky enough to find re-employment probably want to make up for the resources they depleted” by staying on the job.
But the recession also contributed to early retirements by “knocking a lot of people out of the labor force who may have preferred to keep working into their late 60s.” According to Rutledge’s research, jobless individuals ages 62 and older have little patience for the job search, and tend to stop searching and retire within a year of losing a job.1 “If they don’t come back—and ‘unretirement’ is common, but hardly the norm—then retirement ages will be lower than they would have been if the recession had been a more normal downturn.”
In addition, diminished job prospects during the recession led many people to apply for disability insurance and record numbers began receiving benefits. The Social Security Administration “has done their best to try to give disability beneficiaries incentives to return to work, but research indicates that not very many recipients are healthy enough to even look for a job or stay with one for long enough to disqualify themselves,” he reports.
Federal disability insurance (DI) under the Social Security program has traditionally removed mostly low-educated workers from the pool of potential retirees, and this group likely had fairly early retirement ages even if they had not been on DI benefits, Rutledge explains. But the recent increase in disability recipients could have an impact on labor force participation rates because more highly educated workers are receiving DI as well. “Due to the increasing prevalence of mental illness as a disabling condition, higher-educated individuals are getting on DI, likely cutting off their careers much earlier than we would have projected,” he says.
Continued stagnant wages for low- and middle-income workers are likely to reduce the incentive to stay in the workforce. “If people don’t see their efforts rewarded with wage growth that actually keeps up with the cost of living and with their expectations about how much they should be making near the ends of their careers, then they’re likely to decide it’s not worth working,” says Rutledge.
The availability of part-time positions will also influence whether older Americans remain on the job or retire early. While many older employees prefer to transition slowly to full retirement by working part-time initially, some employers are reluctant to allow part-time work. Data from the Census Bureau’s Current Population Survey show that among employed 65-to-69-year-olds in 2013, nearly one-third of men (31 percent) and almost one-half of women (46 percent) were working part-time.2 Among those ages 70 and older still in the workforce, an even larger share was working part-time (44 percent of men and 55 percent of women).
Finally, new changes in the Social Security program could be effective in encouraging older individuals to remain in the workforce longer and delay claiming benefits. “Some reform will be needed—especially to disability insurance, which has less than two years left before its Trust Fund is exhausted.”
Paola Scommegna is a senior writer/editor at the Population Reference Bureau.
The chronic stress of living in poverty, loneliness of social isolation, and fear endemic in some high-crime neighborhoods can alter gene activity and contribute to disease, according to Steve Cole, professor of medicine and behavioral sciences at University of California, Los Angeles (UCLA). His research examines how psychological experiences influence immune systems and human health. He is mapping the biological pathways through which social conditions change the expression of traits or tendencies encoded in genetic material.
Researchers in this growing field of “social genomics” are finding that social activities today may influence our bodies for the next few months or for the rest of our lives, he reports. But he emphasizes the following:
Cole spoke with Marlene Lee, program director of academic research and relations at the Population Reference Bureau, about advances in genetics and the implications for population research. Below are excerpts from their conversation.
Lee: What kinds of social activity affect our bodies and which activities have short-term implications and which have long-term implications?
Cole: In general, the things that people worry about a lot are what we often call acute stressors—really bad events like the death of a loved one or a really frightening event, traumatic experience, or just having a terrifically bad day. It turns out that the epidemiology suggests that it is not that kind of acute stress that is most detrimental to health. What’s really detrimental to health are long-term stressful lifestyles: social behaviors that may not be terribly bad in any given day but that add up, when repeated day after day, month after month, year after year, to a life that is filled with threat and uncertainty. That threat doesn’t even have to be particularly conscious—it may just be subtly there in the background. The kinds of social and environmental variables that seem to trigger that kind of chronic “stress/threat” psychology are things like poverty, the sense of being alone or separate from humanity, or a big threat that hangs over your head for a long time like a diagnosis with a chronic disease such as cancer. Worrying constantly about whether we or the people we care about are safe—is there going to be a war or a shooting. That kind of psychology is the kind that correlates best with the risk of disease in epidemiologic studies… When we look into genomics to try to understand how diseases come about, we are starting to find that it is these chronic stressors that the genome responds to in a way that sets us up for disease down the line.
Lee: Does a heightened sense of not being safe or of insecurity among the elderly play a little bit into aging being more stressful and having long-term effects later in life?
Cole: Yes, I think it may, both in terms of people feeling like they are less able to cope with a complicated environment as they are older and also more aware, because of their greater life experience, of the kinds of things that could come upon them. That said, lots of older people are mentally skilled enough to find their way into a niche, a place in the world, where they are fundamentally comfortable. They are around people that they know and care about and that know them and care about them. That kind of capacity to control your own life and to make wise decisions, and find the things that work for you, is something that older people are often quite good at. We kind of raise our own stakes as we age. There is much more variability in people’s biology and outcomes as a result of the increasing leverage they have over their own lives and their own personal histories.
Lee: How is what you think of as the “new genetics” and the advances in genetics different from the genetics some people may have learned in high school?
Cole: …As we get the tools to watch genes in action, we have begun to recognize that they do not necessarily exert the same influence on every single individual. Whether a gene is active, or how active it is, or how much it influences your cellular physiology depends a lot on the environment you are in. That environment includes the physical and chemical environment—the things that we traditionally think of as physiological stimuli: temperature, humidity. But it can also include the social world and how we perceive the world. If we perceive it as threatening or uncertain, our bodies will mount “defensive” stress responses. They will release hormones and neurotransmitters that activate receptors on cells, and that kicks off changes in gene expression. We can start to see how psychology meets up with physical events and chemical events to jointly regulate what our genome does. We have gone beyond a static view of genes as just blocks that are handed to you by your genetic endowment from your parents. We now think of them as a template that reflects the conditions of the life that you lead back into the body in the form of changes in cellular physiology.
Lee: You and others have written about “socially sensitive” genes. …How does identification of socially sensitive genes influence understanding the relationship between social conditions and health?
Cole: What has been amazing in the last 10 or 15 years is our ability to poll the whole human genome. We have remarkable biotechnology that allows us to look at every single one of our 21,000 genes as they respond to these different kinds of social, psychological, physical, and chemical environments. That allows us to map the whole system as it is working and ask questions about which components of the system are sensitive to any given kind of stimulus or environment. …When we study people confronting a wide variety of different kinds of adversity—bereavement, social isolation, poverty, or post-traumatic stress, for example—we see a fairly recurrent pattern in which one group of genes involved in inflammatory responses becomes activated. You start to transcribe more copies of that gene DNA into messenger RNA and that builds more inflammatory proteins in your cells. That genetic program probably evolved to defend [us] against the likelihood of physical injury, which for most of our history as a species has been associated with the psychological experience of flight, threat, or stress… When we confront extended periods of threat or uncertainty, that “pro-inflammatory” group of genes involved in defending us against bacteria become more active. Conversely, genes that defend us against viral infections…become less active. As a consequence of those two things, we become both more vulnerable to viral infections but also we grow more vulnerable to a variety of different chronic diseases that are caused by the physiological side effects of those inflammatory genes that are trying to defend us against those bacterial infections… Pro-inflammatory genes also accidentally fertilize the development of atherosclerotic plaques and other forms of cardiovascular disease, the development and metastasis of cancer cells, and the degeneration of our neurons. That is an unwanted byproduct of this defensive gene expression response. You can think of [the pro-inflammatory response to stress] as a kind of double-edged sword: It kills bacteria, but it also makes it easy for other kinds of diseases to progress. What happens in heart disease is there is damage on the wall of a blood vessel and this inflammatory response tries to heal that damage, but inadvertently builds a plaque, sort of like a scar, that starts to block your blood vessels. A similar kind of defensive response gone wrong happens in neurodegenerative diseases. You have more inflammation going on than is really healthy for the neurons and so the neurons basically get sick and die by accident while the immune system is trying to defend you against tissue damage. Similar things happen with metastatic cancer. We are now finding that many tumors start to grow in our body but they can’t actually escape and metastasize (and that is what actually causes disease and death). But one thing that does help them metastasize and colonize distant tissues is when inflammation grows blood vessels into the environment. That helps cells survive longer, it provides growth signals and other kinds of resources that a renegade cancer cell can take advantage of and use to escape into the rest of the body. …This is why, if you feel stressed for years and decades, that can eventually add up to changes in the way that very slow biological processes work in your body and contribute to these chronic diseases.
Lee: Do you have additional insight into the different pathways through which social environment controls gene expression?
Cole: …We are understanding how threat, stress, fear, and anxiety get out of the brain and into the body. [They] travel through a division of our nervous system—the sympathetic nervous system, popularly called the fight-or-flight stress response. The chemicals released by those neurons in the distant parts of the body are well-known to activate certain kinds of receptors that control the activity of pro-inflammatory and anti-viral genes. In the past ten years, we have been able to map out quite clearly that when you have the fight or flight response, the neurotransmitter norepinephrine interacts with beta-adrenergic receptors and stimulates the expression of the interleukin 6 gene, which then stimulates inflammatory biology… In another stress response pathway, hormones regulate the activity of our adrenal glands, and the adrenal glands produce another set of hormones that go out into the body, in particular cortisol, to regulate gene expression in just about every tissue. So for stress and fear, we have a pretty good biochemical roadmap of how these gene expression changes take place. One of the big frontiers right now is how positive psychology gets out into the rest of the body, if it does. It is possible that positive psychology works only by reducing stress or threat responses. But a lot of people are interested in the possibility that separate from reducing threat or stress, positive psychology may have its own hormones and neurotransmitters that also influence gene expression…
Lee: Could you give an example of early social experience and what it changes in terms of gene expression?
Cole: One of the best examples comes from a line of research on monkeys conducted by Stephen Soumi. These are monkeys that are newborn. They’ve had some exposure to the world through the mother in utero, but basically they are fresh to what we would call the environment and the world outside. Dr. Suomi randomizes them to either stable social conditions where an adult [mother] is there to structure what they are doing, or to spend the first couple of months of their lives in a cage full of other infant monkeys without any adult supervision. In the absence of any stabilizing adults, that social environment is somewhat unstable and chaotic but not overtly violent or injurious. That is actually a reasonably good model of the kinds of psychological experiences that really get to us in modern society. …There’s not a lot of violence that takes place to the average person in America on a daily basis, but there’s a lot of threat and uncertainty and chaos and the need to figure out what is going on and how to confront all the random crazy things that happen to us in life. …What we have been learning is that even things that are not that extreme still trigger the same kind of psychology. Let’s say that you are in a family but you have an unusually volatile and unpredictable social scene: mom and dad don’t get along, or maybe dad’s not around very often, or maybe mom’s not around very often, or maybe there are just constantly new people coming into the house for whatever reason and you don’t understand why. All of that will leave you feeling disoriented and like the world is an unpredictable place. I need food and I cry: Sometimes I get it [food] and sometimes I don’t. To make a long story short, when life is chaotic and unpredictable (even for a few months), that seems to activate some of these defensive gene expression programs. When Dr. Soumi randomizes the monkeys to the more unstable environment, the gene expression profiles in the white blood cells of these animals look like they are under stress—they turn on that inflammatory response. What’s remarkable is that after a few months, he can take that monkey from an unstable environment and put it in with all the rest of the monkeys reared in a more-stable social system. So you have a monkey that has been in an unstable chaotic environment, and now you put all the monkeys together…. [for] the rest of their lives, the animals that spent the first few months of their lives in the chaotic environment behave differently. Moreover, they continue to show differences in gene expression, months and now years, after that initial unstable early environment is gone.
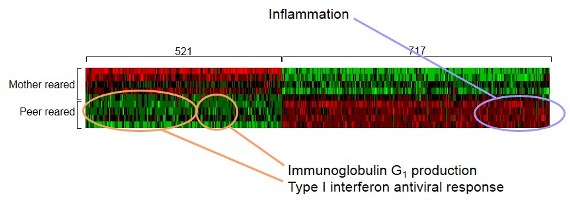
This “heat plot” shows differences in the expression of genes regulating immune system functioning between monkeys who experienced social instability (peer reared) and those who did not (mother reared)—red representing up-regulated genes and green representing down-regulated genes.
Source: Steve Cole, “Transcriptional Modulation of the Developing Immune System by Early Life Social Adversity,” Proceeding of the National Academy of Sciences of the United States of America 109, no. 50 (2012): 20578-83.
Lee: I see this as quite revolutionary in terms of how we think about the environment that we create for people in our society. What do you think are some of the implications of this new genetics and some of these types of findings for public policy or dealing with creating interventions for particular types of diseases?
Cole: The first thing is that the scenario I just outlined suggests that all other things equal, interventions that take place early in the life span are probably going to have more leverage because there is more of your life span remaining for benefit to accrue, and because young bodies are so impressionable. A second thing that comes to mind is that I don’t want to leave anybody with the impression that the die is cast when you are young and that there is nothing you can do after that. We have never seen a situation where, even in the oldest animals, there is not some plasticity, or some ability to catch up or rebound when you come into a more favorable environment. So even late in life, in mid-adulthood or late-adulthood, when people are put into more favorable environments, the genome gets the message, and it starts to respond in a more favorable way—less inflammation and more healthy antiviral responses for example in white blood cells. Even in adulthood there is room to change your world for the better and to have that filter down through your body into the genome… Just because adversity can get into the body does not mean that there is not a way to launder it out by straightening up the environment that you are in now and leading the most salutatory and favorable lifestyle for who we are temperamentally. And I think the third thing that also jumps out—the more we learn about these gene expression profiles the more we can see diseases before they even become an illness. We start to understand the ingredients of a heart attack or the ingredients of Alzheimer’s disease or the ingredients of a case of metastatic cancer. We are beginning to recognize that the same sets of genes contribute to all of these things… there are usual suspects involved in all of these things like the genes that mediate inflammatory responses… We can see disease brew for years and years before it actually rears its head as a significant impairment or overt symptoms for an individual. That is an exciting opportunity because it allows us to think about what is going on for this person before their health goes around the bend, and it is really hard to get it back. I am cautiously optimistic that as we learn more about the molecular biology and the genomics of disease, we can start to respond to adversity and its effects on the body before we get into these irreversible disease states. We can start to monitor how are we doing: Have we picked a good life for ourselves? Is the set of policies we have working well for people at the regional or state or national levels? Is this really working for people or are we still seeing bodies that look, at the genomic level, [like] they are feeling stress and threat and that we know in the end will then add up to differences in disease rates…
Lee: What is the one thing you would recommend if you could make a law or tell people what important concrete steps might be needed?
Cole: I don’t think I have a simple answer except in one regard. …I got to this research by looking at minority groups that were stigmatized to the point of being seriously threatened—having to fear for their lives if it were known that they were a member of a particular group. That seemed to be exceptionally corrosive to health and well-being. …I think it is deeply important that we create a society where every human being feels safe. Ideally we would all feel valued, but at least each of us needs to feel safe.
This interview was initiated as a follow-up to a talk given by Steve Cole at a RAND conference marking the 20th anniversary of the National Institute on Aging Centers on the Demography, Economics, and Epidemiology of Aging. Cole is professor of medicine, psychology, and behavioral sciences at UCLA and a member of the USC/UCLA Center of Biodemography and Population Health. To learn more:
Steve Cole, “Nervous System Regulation of the Cancer Genome,” Brain, Behavior and Immunity 30, Supplement (2013): S10-18.
George M. Slavich and Steve Cole, “The Emerging Field of Human Social Genomics,” Clinical Psychological Science (forthcoming, published online March 5, 2013).
Steve Cole, “Social Regulation of Human Gene Expression: Mechanisms and Implications for Public Health,” American Journal of Public Health (forthcoming).
Definitions: The human genome is a set of DNA sequences contained within cells of the human body, providing instructions about how to build these cells. A gene is one sequence of DNA that provides instructions to make a specific chemical in the body, usually a protein. Additional background: http://ghr.nlm.nih.gov/handbook/howgeneswork/makingprotein
The “Gold Moment on Family Planning” is set for World Population Day, July 11, 2012, in London. The event seeks international attention, policy, and funding on meeting the global unmet need for family planning by 2020.
(June 2012) For women in Morocco today, becoming a mother is safer than ever. The nation has seen a sharp decline in the numbers of women who die during pregnancy or childbirth. At the same time, the country stands out among Arab countries for a rapid increase in modern contraceptive use by both rural and urban women and for relatively low levels of “unmet need” for family planning—defined as the share of women who wish to delay or avoid pregnancy but are not using contraception.
Morocco’s drop in maternal deaths and high level of contraceptive use are closely related, according to Farzaneh Roudi-Fahimi, Middle East and North Africa program director at the Population Reference Bureau. “When a woman wants a smaller family and uses contraception effectively, she can have fewer pregnancies—reducing her lifetime risk of disability and death from complications during pregnancy and childbirth,” she said. Morocco’s maternal mortality rate dropped from 332 deaths per 100,000 live births in 1990 to 112 per 100,000 births in 2009, reflecting a remarkable 60 percent decline.1 Morocco’s rate is now closer to the average for Central America (90 per 100,000) than the average for the North African region (270 per 100,000) or Africa as a whole (590 per 100,000).2
Demand for family planning in Morocco increased sharply over the past decade, Roudi-Fahimi said. The share of married women ages 15 to 49 who want to postpone or avoid pregnancy was about 60 percent in 2004 and increased to 80 percent by 2011, when 67 percent were using contraception and 11 percent were not, reflecting “unmet need” for family planning.3
Many observers say that the nation is poised to join the few low- and middle-income countries worldwide that are on track to achieve the United Nations Millennium Development Goal 5—reducing maternal mortality by 75 percent between 1990 and 2015. To reach the MDG milestone, Morocco has made safe motherhood a priority and invested in the three proven strategies to reduce maternal mortality—increased availability of voluntary family planning services, expanded and improved maternal health care, and ensured access to obstetric care (including Caesarian birth) in part by eliminating fees.
The Moroccan government has been able to meet a greater share of the rising need for contraception by focusing on household-based delivery of family planning services. The government’s effort has made modern contraceptives available to low-income and rural women who would otherwise not have access to private-sector services.
Results from a 2011 Pan Arab Project for Family Health (PAPFAM) survey show that 57 percent of Moroccan married women of reproductive age were using a modern contraceptive method in 2011, an increase from 36 percent in 1992.4 The survey also found that about 10 percent of all married Moroccan women of reproductive age were using traditional family planning methods, compared with about 6 percent in 1992.
Fifty-five percent of married women in rural areas were using a modern family planning method in 2011, up from 32 percent in 1992. Such an increase in modern contraceptive use is particularly significant, reflecting improvements in other aspects of women’s lives such as rising school enrollments for girls and increasing literacy levels among younger women, Roudi said. While 44 percent of all Moroccan women ages 15 and older are literate, 72 percent of young women (ages 15 to 24) are literate, according to 2009 United Nations data.5
Widespread family planning use has contributed to Morocco’s rapid shift from large to small families. The 2011 PAPFAM survey found that Moroccan women were having 2.6 children on average in 2011—three fewer births than the average of 5.6 per woman recorded in 1980. The change has been particularly dramatic among women living in rural areas, whose fertility declined from 6.6 births in 1980 to 3.2 births on average in 2011.
The recent survey results also underscore the progress Morocco has made in narrowing the gap in access to family planning services between the poor and rich segments of society. The average difference in family size between the country’s poorest and richest quintiles of the population (five groups of equal population size) was narrowed by three children between 1992 and 2011 (see table). Over the same period, modern contraceptive use among married women in the poorest quintile rose from 18 percent to 55 percent—not far behind that of women in the richest quintile. Unmet need for family planning among the poorest women was cut by more than half during that time.
Fertility and Reproductive Health Indicators for Morocco, by Selected Wealth Quintile,* 1992 and 2011
| Indicator | Selected Wealth Quintiles | |||||
|---|---|---|---|---|---|---|
| Poorest | Middle | Richest | ||||
| 1992 | 2011 | 1992 | 2011 | 1992 | 2011 | |
| Average Number of Births per Woman Ages 15 to 49 | 6.7 | 3.4 | 4.2 | 2.7 | 2.3 | 2.4 |
| Percent of Married Women (Ages 15 to 49) Using Modern Contraceptives | 18 | 55 | 38 | 59 | 48 | 57 |
| Percent of Married Women (Ages 15 to 49) With Unmet Need for Family Planning** | 33 | 14 | 16 | 10 | 10 | 10 |
| Percent of New Mothers Who Received Any Prenatal Care by Trained Personnel | 8 | 50 | 31 | 85 | 74 | 97 |
| Percent of Births Delivered at Home | 95 | 61 | 73 | 14 | 29 | 6 |
| Percent of Deliveries Assisted by Trained Personnel | 5 | 38 | 28 | 87 | 78 | 96 |
Notes: * Wealth quintiles (five groups of equal population size) are based on an index of surveyed household assets. ** Unmet need for family planning includes women who say they want to delay or avoid pregnancy but are not using a contraceptive method.
Sources: M. Azelmat, M. Ayad, and E.A. Housni, Demographic and Health Survey: Morocco 1992 Final Report (1993); and Pan Arab Project for Family Health (PAPFAM), 2011, special tabulations.
The 2011 PAPFAM survey results also reflect dramatic increases in health care during pregnancy and childbirth, which research has linked to improved survival of both mothers and children. These changes are partly the result of policies that increased the number of trained midwives and removed the barriers that prevented rural women from accessing health care during pregnancy and delivery, including transportation. Nearly all (97 percent) of the wealthiest fifth received prenatal care by 2011, up from about 75 percent in 1992. While the gap between the richest and poorest fifths of the population narrowed, still 50 percent of the poorest new mothers did not receive professional prenatal care in 2011.
The share of home births has declined as maternal health care services have been expanded and access improved. The Moroccan health ministry has established maternity “waiting homes,” where women from remote areas can stay along with family members for up to two weeks before their due dates in order to be close to a health care facility. Between 1992 and 2011, the share of births delivered at home declined from 95 percent to 61 percent for women in the poorest fifth of the population and from 73 percent to 14 percent for women with incomes in the middle fifth.
Despite the progress made, Morocco’s family planning and health care programs could be improved in a number of ways. “Family planning in Morocco remains defined by one dominant method: the pill,” said Roudi-Fahimi. The 2011 PAPFAM survey shows that 72 percent of women practicing family planning rely on the pill and 16 percent rely on traditional methods (see figure).6 The survey also shows that Moroccan couples hardly used sterilization or male condoms for contraception. Morocco’s family planning program would benefit from expanding services to include more contraceptive choices, including condoms that prevent both pregnancy and HIV, she noted.
Contraceptive Use in Morocco
Note: Distribution of contraceptive methods used by married women ages 15 to 49.
Source: PAPFAM, special tabulations.
Moroccan family planning and maternal health services tend to focus on the needs of married women. Single men and women may avoid family planning and reproductive health services because of a lack of confidentiality as well as judgment by providers. Roudi-Fahimi argued that these programs should be expanded to serve unmarried couples who are sexually active—a relationship that is usually kept secret because it is not acceptable socially or legally. “The number of couples in such relationships is not high, but the fact that women in such relationships find it difficult to access family planning counseling and services puts their health and well-being in danger, particularly if they are young,” she said.
Paola Scommegna is a senior writer/editor at the Population Reference Bureau.
(September 2010) Net worth—the difference between total savings and assets, and the amount of debt owed—is an important metric to assess a family’s economic well-being. Recent data show a large and growing racial gap in the financial net worth of families and households in the United States, even though the racial disparities in income have not increased since the 1980s.1
Net Worth of Households by Race/Ethnicity, 2004
Note: Net worth includes cash accounts plus savings, shares of stocks or mutual funds, bonds, automobiles, real estate, or other investments.
Source: U.S. Census Bureau, Survey of Income and Program Participation, accessed at www.census.gov/hhes/www/wealth/2004/wlth04-2.html, on Aug. 25, 2010.
A recent report on a national survey of family income dynamics revealed that the wealth gap between black and white American families quadrupled between 1984 and 2007, from $20,000 to $95,000 (not including the value of the family home).2 In 2007 dollars, the net worth of African American families only rose from about $2,500 to $5,000 over the 23-year period, remaining well below the cost of a new car. Researchers found that even high-income African American families had a net worth of just $18,000, and one-quarter of all African American families had no financial cushion at all. In contrast, the average net worth of white families rose from about $22,000 to $100,000 between 1984 and 2007.
A different survey of wealth recently released by the U.S. Census Bureau also shows a large wealth disparity among whites, Asians, blacks, and Hispanics, especially when including home values (see figure).3 African Americans and Hispanics are much less likely to own a home than are non-Hispanic whites and Asians, often reflecting the greater difficulty in getting mortgages, as well as having lower incomes and less job security.4 While car ownership is widespread, blacks and Hispanics are much less likely to own stocks or mutual fund shares, or to have a financial stake in a business (see table).
While family or household income supports day-to-day living expenses, savings and other assets provide a safety net for unexpected expenses and a reserve for special purchases, college tuition, or retirement. Families without this cushion are vulnerable to financial hardship if a family member requires expensive medical care or loses a job. Another major advantage of net worth—even modest amounts—is transfer to the next generation, enabling children to pay off loans, for example, or afford the down payment on a house. One reason that today’s African Americans and Hispanics have less net wealth is that they were less likely to inherit assets. The continuing wealth gap perpetuates the financial disadvantage of African Americans and Hispanics.
These data do not capture the wealth effects of the recent recession, which led to a wave of home foreclosures, wiping out a major source of wealth accumulation for millions of families. While the majority of homeowners kept their property, home values have fallen throughout the United States, eroding net worth.
Percent Owning Selected Financial Assets by Race and Ethnicity, 2004
| Racial/Ethnic Group | Households (Millions) | Savings Accounts* | Stocks and Mutual Fund Shares | Own Business or Profession | Motor Vehicles | Own Home |
|---|---|---|---|---|---|---|
| White non-Hispanic | 81.3 | 72 | 32 | 13 | 89 | 74 |
| Black | 13.9 | 46 | 9 | 6 | 70 | 46 |
| Asian | 3.2 | 72 | 31 | 13 | 83 | 56 |
| Hispanic | 12.2 | 45 | 9 | 7 | 78 | 49 |
*Interest-earning assets at financial institutions.
Source: U.S. Census Bureau, Survey of Income and Program Participation, accessed at www.census.gov/hhes/www/wealth/2004/wlth04-2.html, on Aug. 25, 2010.
Home foreclosures have hit African Americans and Hispanics especially hard, in part because they were more likely than whites to have high-cost or subprime mortgages.5 High unemployment among minorities has prevented many from qualifying for refinancing or loan modifications that would have allowed them to keep their homes.
In addition, many families affected by job losses have drained their savings and retirement funds to cover living costs. According to available data, even when the housing and job markets recover from the recession, there will continue to be a large wealth gap among U.S. racial and ethnic groups.
Mary Mederios Kent is senior demographic writer at the Population Reference Bureau.
This Population Bulletin Update is a follow-up to 2006’s Population Bulletin, “Immigration: Shaping and Reshaping America” by Phil Martin and Elizabeth Midgley, and provides new data and analysis on the economic impacts and policy debates around immigration.
(June 2010) Recent immigration patterns and policies show both continuity and change. Continuity is reflected in the arrival of an average of 104,000 foreigners a day in the United States. This group includes 3,100 who have received immigrant visas that allow them to settle and become naturalized citizens after five years, and 99,200 tourists and business and student visitors (see table). About 2,000 unauthorized foreigners a day settle in the United States. Over half elude apprehension on the Mexico-U.S. border; the others enter legally, but violate the terms of their visitor visas by going to work or not departing.1
Two developments have rekindled the immigration reform debate. The recent recession, the worst since the Great Depression, exacerbated unemployment and reduced the number of unauthorized foreigners entering the country. However, most unauthorized foreigners did not go home even if they lost their jobs, since there were also few jobs in their home countries. The recession resulted in the loss of 8 million jobs; civilian employment fell from 146 million at the end of 2007 to 138 million at the end of 2009. There was also stepped-up enforcement of immigration laws, especially after the failure of the U.S. Senate to approve a comprehensive immigration reform bill in 2007, including the proposal to require employers to fire employees whose names and social security data do not match. Experts agree that the stock of unauthorized foreigners fell in 2008-09 for the first time in two decades, but they disagree over why it fell. Some studies stress the recession, suggesting that the stock of unauthorized foreigners will increase again with economic recovery and job growth. Others stress the effects of federal and state enforcement efforts to keep unauthorized workers out of U.S. jobs.2
Entries In and Out of the United States, 2005-2009
| Category | 2005 | 2006 | 2007 | 2008 | 2009 |
|---|---|---|---|---|---|
| Legal Immigrants | 1,122,373 | 1,266,129 | 1,052,415 | 1,107,126 | 1,130,818 |
| Immediate relatives of U.S. citizens | 436,231 | 580,348 | 494,920 | 488,483 | 535,554 |
| Other family-sponsored immigrants | 212,970 | 222,229 | 194,900 | 227,761 | 211,859 |
| Employment-based | 246,878 | 159,081 | 162,176 | 166,511 | 144,034 |
| Refugees and asylees | 150,677 | 216,454 | 136,125 | 166,392 | 177,368 |
| Diversity and other immigrants | 75,617 | 88,017 | 64,294 | 57,979 | 62,003 |
| Estimated emigration | -312,000 | -316,000 | -320,000 | -324,000 | -328,000 |
| Legal Temporary Migrants | 32,003,435 | 33,667,328 | 37,149,651 | 39,381,925 | 36,231,554 |
| Pleasure/business | 28,510,374 | 29,928,567 | 32,905,061 | 35,045,836 | 32,190,915 |
| Foreign students (F-1) | 621,178 | 693,805 | 787,756 | 859,169 | 895,392 |
| Temporary foreign workers | 882,957 | 985,456 | 1,118,138 | 1,101,938 | 936,272 |
| Illegal Immigration: Apprehensions | 1,291,142 | 1,206,457 | 960,756 | 791,568 | — |
| Removals or deportations | 246,431 | 280,974 | 319,382 | 358,886 | — |
| Change in unauthorized foreigners | 572,000 | 572,000 | 572,000 | -650,000 | — |
— Data not available
Note: The stock of unauthorized rose from 8.4 million in 2000 to 12.4 million in 2007, and in 2009 dipped to 11.1 million.
Sources: DHS; and unauthorized foreigners data from Jeff Passel, Pew Hispanic Center, accessed at http://pewhispanic.org/topics/?TopicID=16, on June 3, 2010.
The second stimulus for a renewed debate is that more states and cities are enacting laws to deal with unauthorized migration, including an Arizona law signed in April 2010 that makes unauthorized presence in the state a crime. Public opinion polls find widespread dissatisfaction with the “broken” immigration system. Congress has debated comprehensive immigration reform for a decade without passing new legislation. The U.S. House of Representatives approved a bill in 2005 and the Senate followed in 2006, but Congress has been unable to agree on a three-pronged package that would toughen enforcement against unauthorized migration, legalize most unauthorized foreigners, and create new guest worker programs and expand current ones. Arizona and a dozen other states require employers to use the federal government’s electronic E-Verify system to check the legal status of new hires; private employers with federal contracts must also use E-Verify.
Figure 1
Annual Number of Legal U.S. Immigrants by Decade and Region of Origin, 1960-2009
Note: Numbers may not add to 100 percent due to rounding.
Source: Department of Homeland Security (DHS) Immigration Statistics.
Immigration has a major effect on the size, distribution, and composition of the U.S. population. As U.S. fertility fell from a peak of 3.7 children per woman in the late 1950s to 2.0 today, the contribution of immigration to U.S. population growth increased. Between 1990 and 2010, the number of foreign-born U.S. residents almost doubled from 20 million to 40 million, while the U.S. population rose from almost 250 million to 310 million. Thus, immigration directly contributed one-third of U.S. population growth and, with the U.S.-born children and grandchildren of immigrants, immigration contributed half of U.S. population growth.
The United States had 39 million foreign-born residents in 2009; 11 million, almost 30 percent, were in the United States illegally. The United States has the most foreign-born residents of any country, three times more than number-two Russia, and more unauthorized residents than any other country. The United States, with 13 percent foreign-born residents, has a higher share of immigrants among its residents than most European countries, but a lower share than Australia and Canada.3
In recent decades, immigrants have been mostly Asian and Hispanic, changing the composition of the U.S. population (see Figure 1). In 1970, about 83 percent of the 203 million U.S. residents were non-Hispanic whites and 6 percent were Hispanic or Asian. In 2010, the United States had 310 million residents; two-thirds were non-Hispanic white and 20 percent were Hispanic or Asian. If current trends continue, by 2050 the non-Hispanic white share of U.S. residents will decline to about 50 percent while the share of Hispanics and Asians taken together will rise to one-third (see Figure 2).4
Most immigrants come to the United States for economic opportunity; about 100,000 a year, less than 10 percent, arrive as refugees and asylum seekers fleeing persecution in their own countries. About half of immigrants and U.S.-born persons are in the U.S. labor force—a slightly higher share of foreign-born men and a slightly lower share of foreign-born women. In 2009, about 15 percent of U.S. workers were born outside the United States.
The effects of foreign-born workers on U.S. labor markets are hotly debated. Economic theory predicts that adding foreign workers to the labor force should increase economic output and lower wages, or lower the rate of increase in wages. This theory was confirmed by a National Research Council study that estimated immigration raised U.S. GDP, the value of all goods and services produced, one-tenth of 1 percent in 1996, increasing that year’s GDP of $8 trillion by up to $8 billion.5 U.S. GDP was $15 trillion in 2010, suggesting that immigration contributed up to $15 billion. Average U.S. wages were depressed 3 percent because of immigration.
Figure 2
U.S. Population by Race and Ethnic Group, 1970, 2010, 2050
Source: U.S. Census Projections With Constant Net International Migration, accessed at www.census.gov/population/www/projections/2009cnmsSumTabs.html.
However, comparisons of cities with varying proportions of immigrants have not yielded evidence of wage depression linked to immigration. For example, in 1980, over 125,000 Cubans left for the United States via the port of Mariel. Many settled in Miami, increasing the labor force by 8 percent, but the unemployment rate of African Americans in Miami in 1981 was lower than in cities such as Atlanta, which did not receive Cuban immigrants.6 One reason may be that U.S.-born workers who competed with Marielitos moved away from Miami, or did not move to Miami.
Because of internal migration, most economists look for the impacts of immigrants throughout the U.S. labor market rather than in particular cities. Immigrants and U.S.-born workers are often grouped by their age and education in order to determine, for example, how 20-to-25-year-old immigrants with less than a high school education affect similar U.S.-born workers. Economist George Borjas assumed that foreign-born and U.S.-born workers of the same age and with the same levels of education are substitutes, meaning that an employer considers foreign- and U.S.-born workers to be interchangeable.7 However, if foreign-born and U.S.-born workers are complements, meaning that a 30-year-old U.S.-born carpenter with a high-school education is more productive because he has a foreign-born helper, immigrants can raise the wages of similar U.S.-born workers.8 Estimated immigrant impacts depend largely on assumptions, and economic studies have not reached definitive conclusions.9
Immigrants do more than work—they also pay taxes and consume tax-supported services. Almost half of the 12 million U.S. workers without a high-school diploma are immigrants, and most have low earnings. Most taxes from low earners flow to the federal government as Social Security and Medicare taxes, but the major tax-supported services used by immigrants are education and other services provided by state and local governments.10 Because of this, some state and local governments call immigration an unfunded federal mandate and attempt to recover from the federal government the cost of providing services to immigrants.
Next page:
The path to naturalization and policy reactions
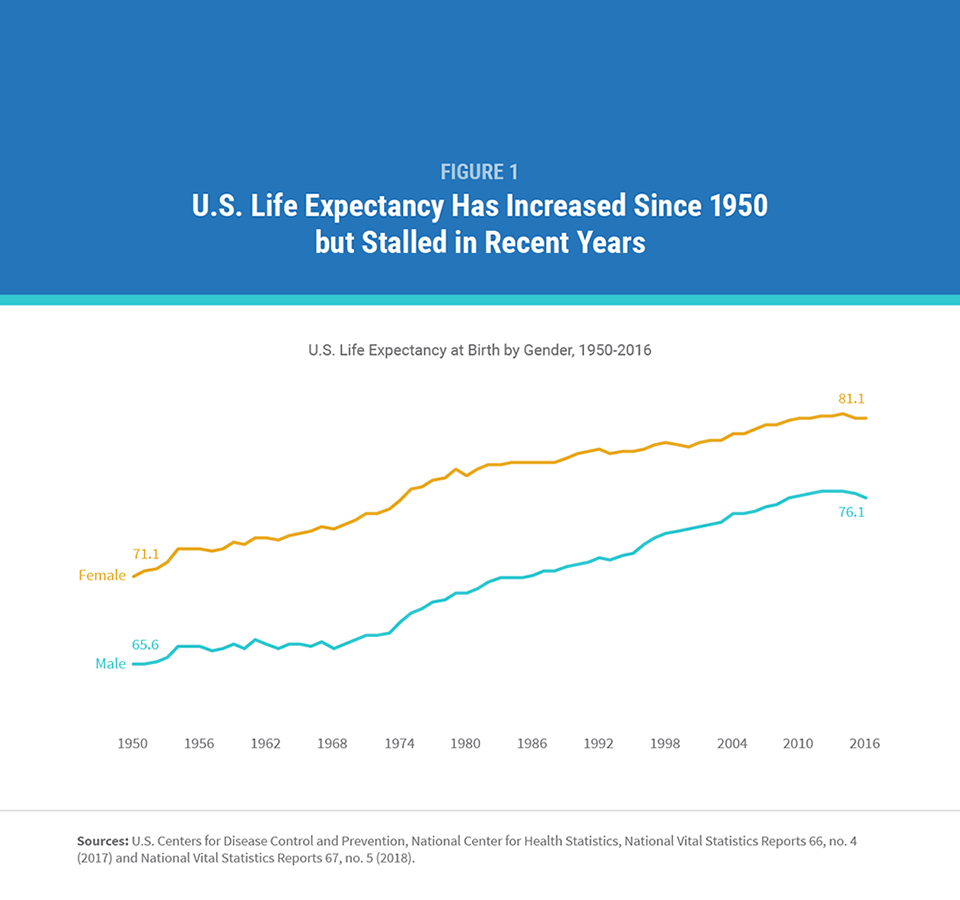
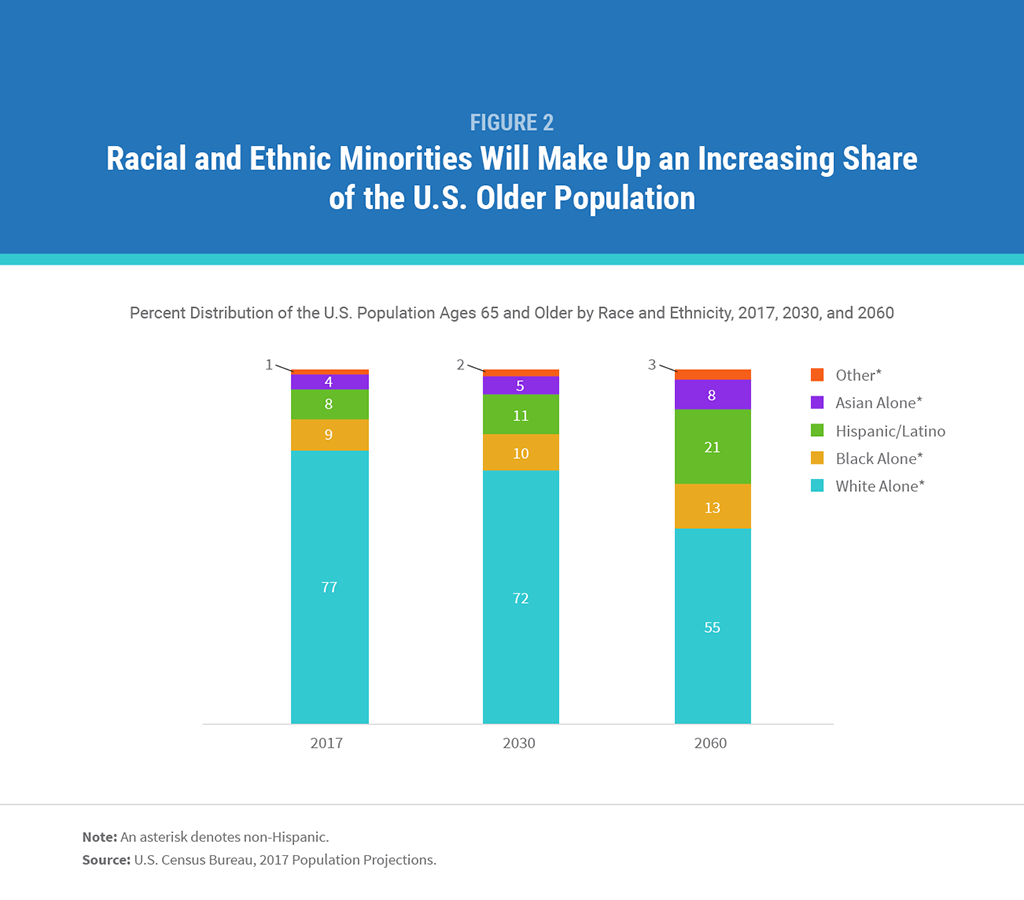
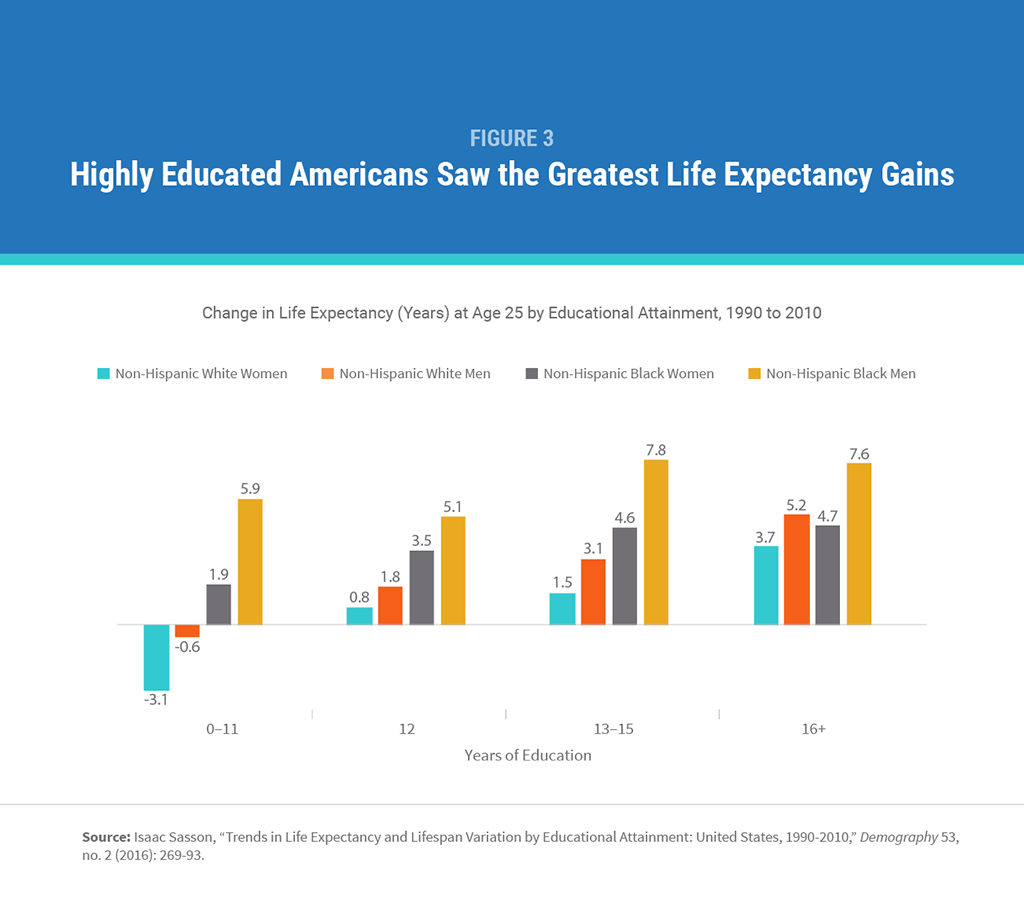
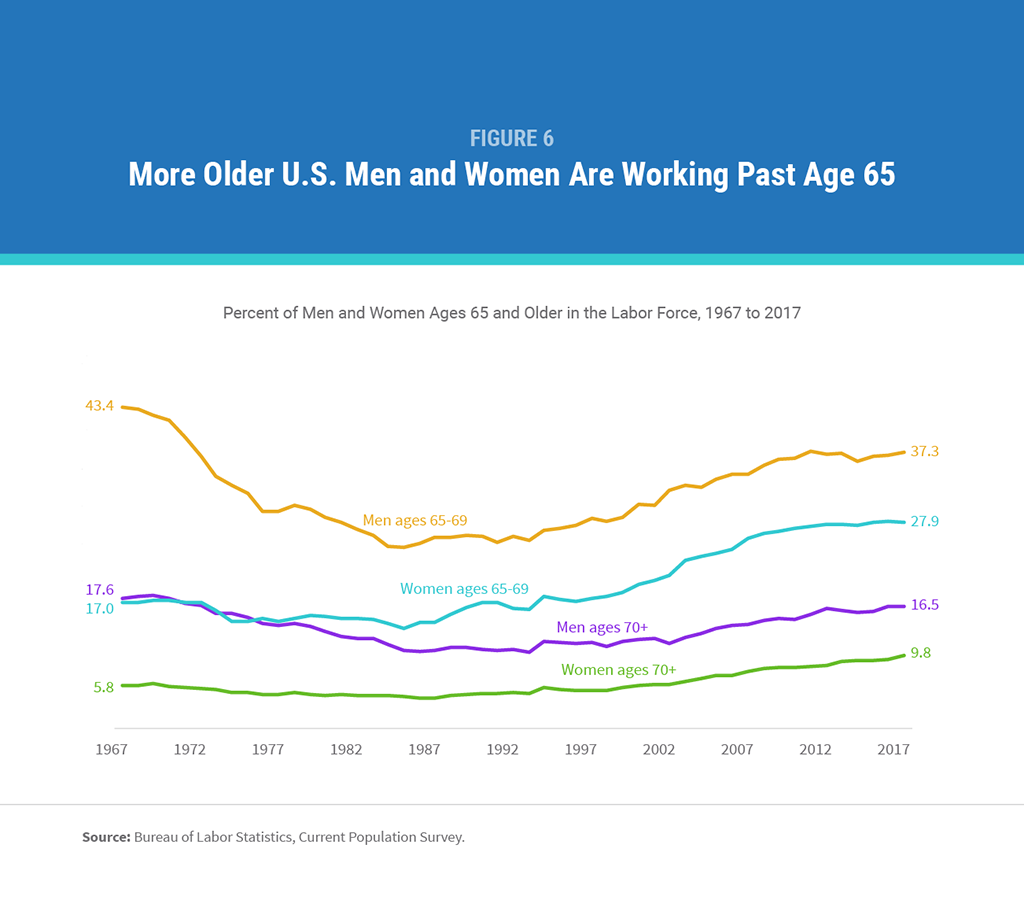
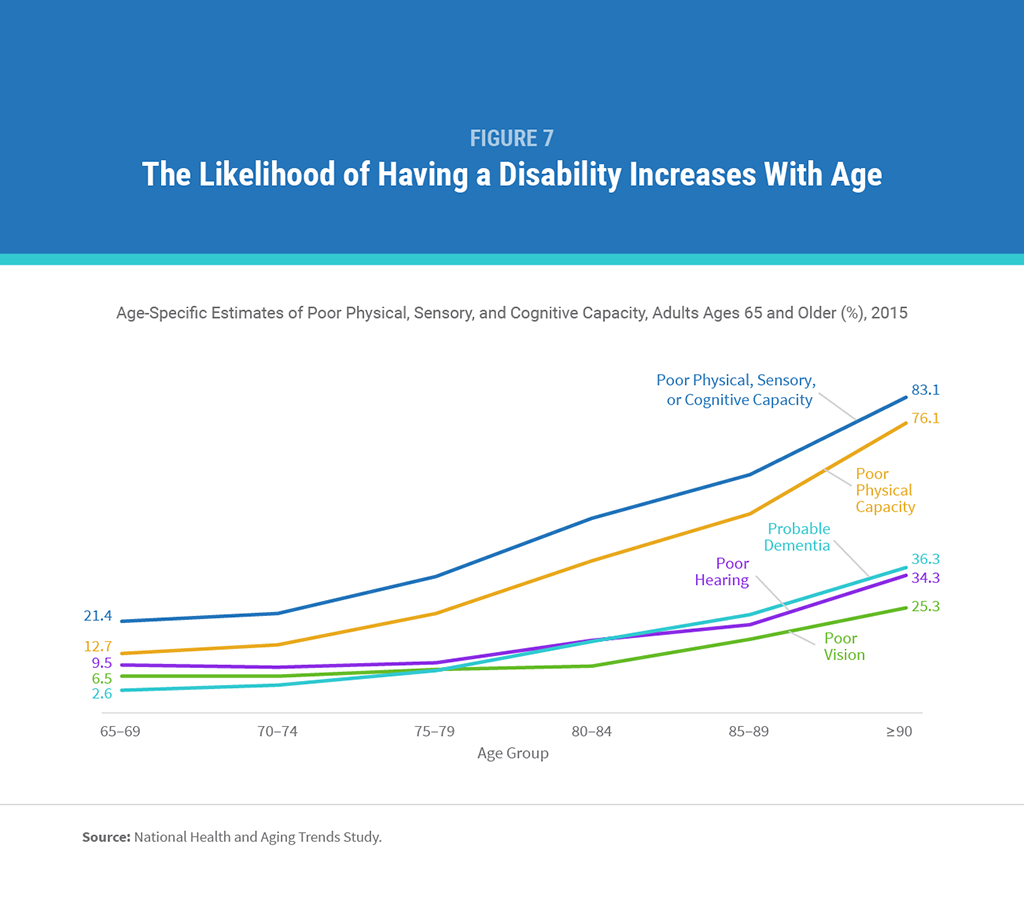
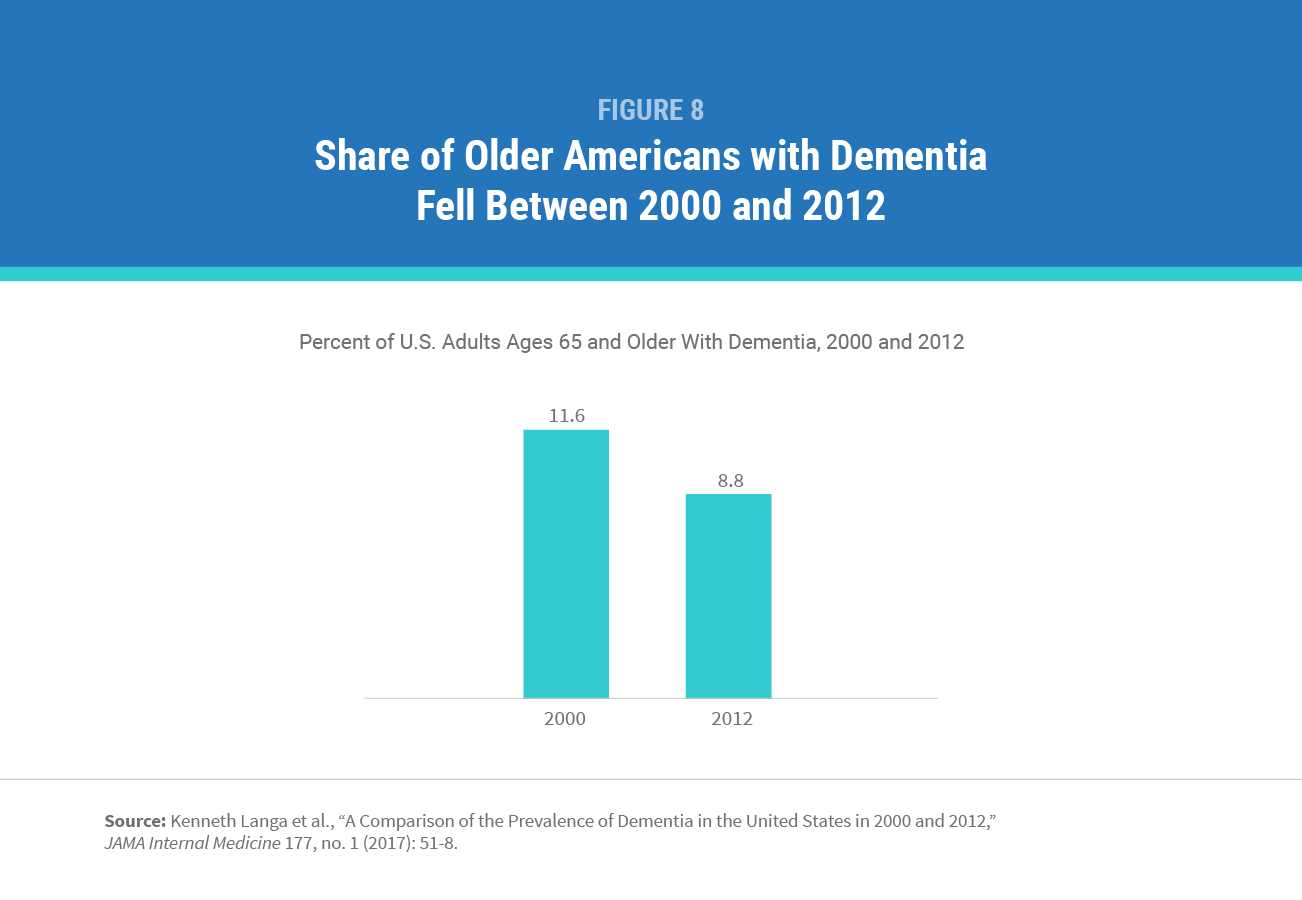

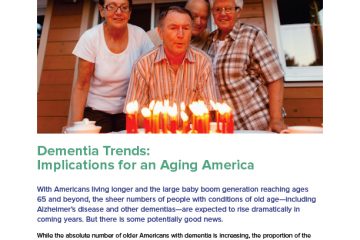

 ">
">

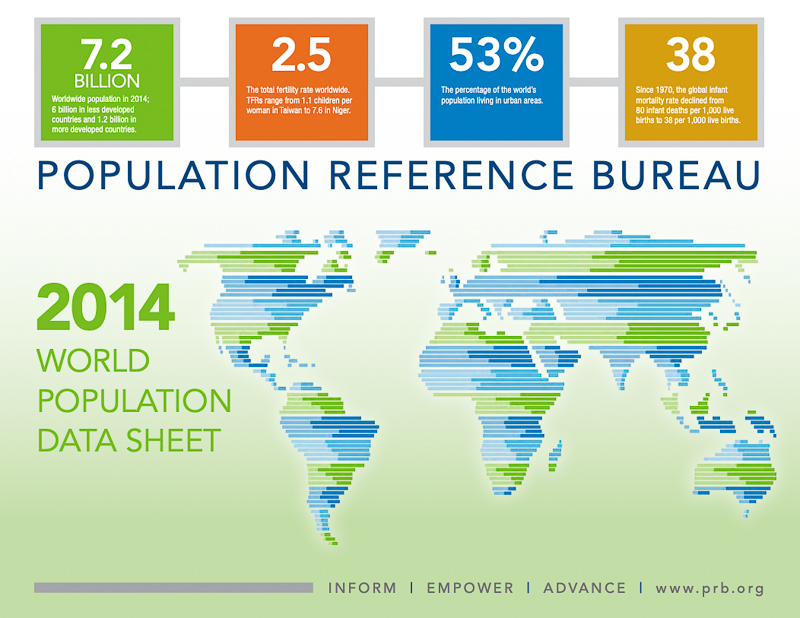 ">
">
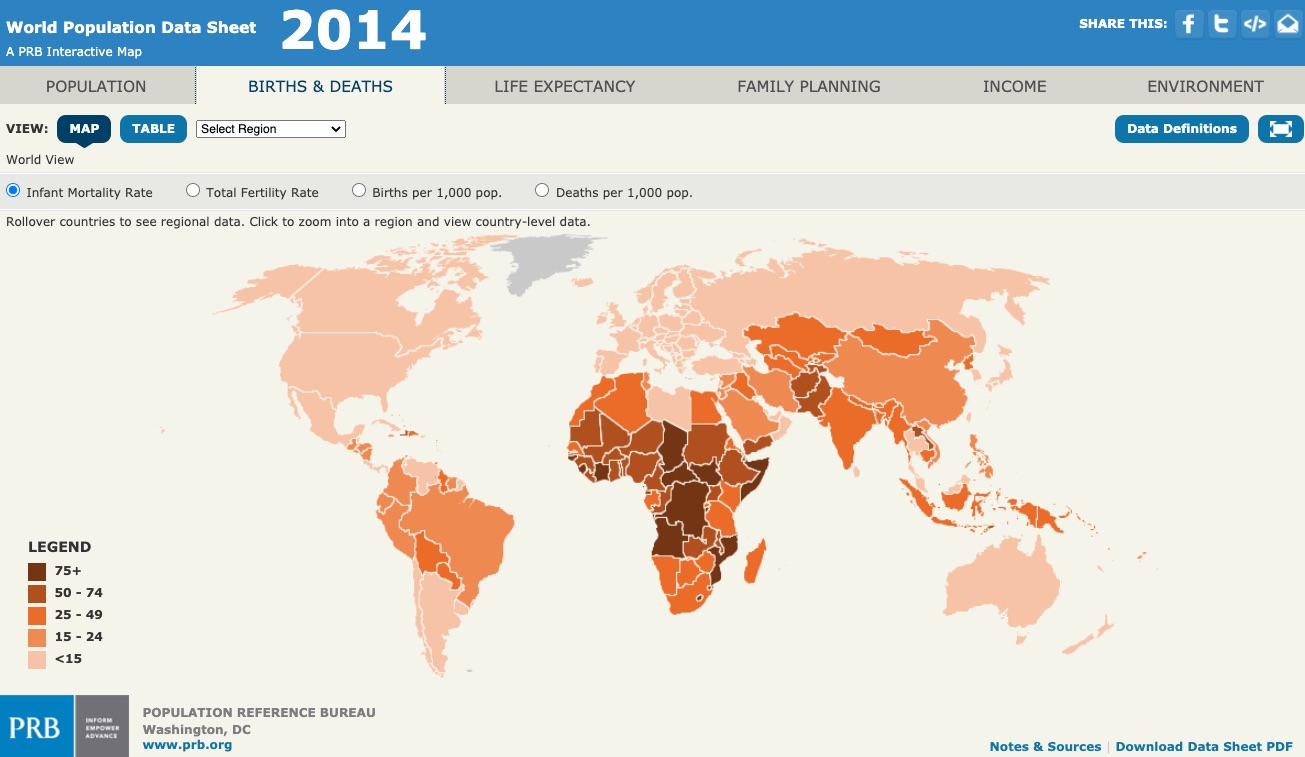 ">
">
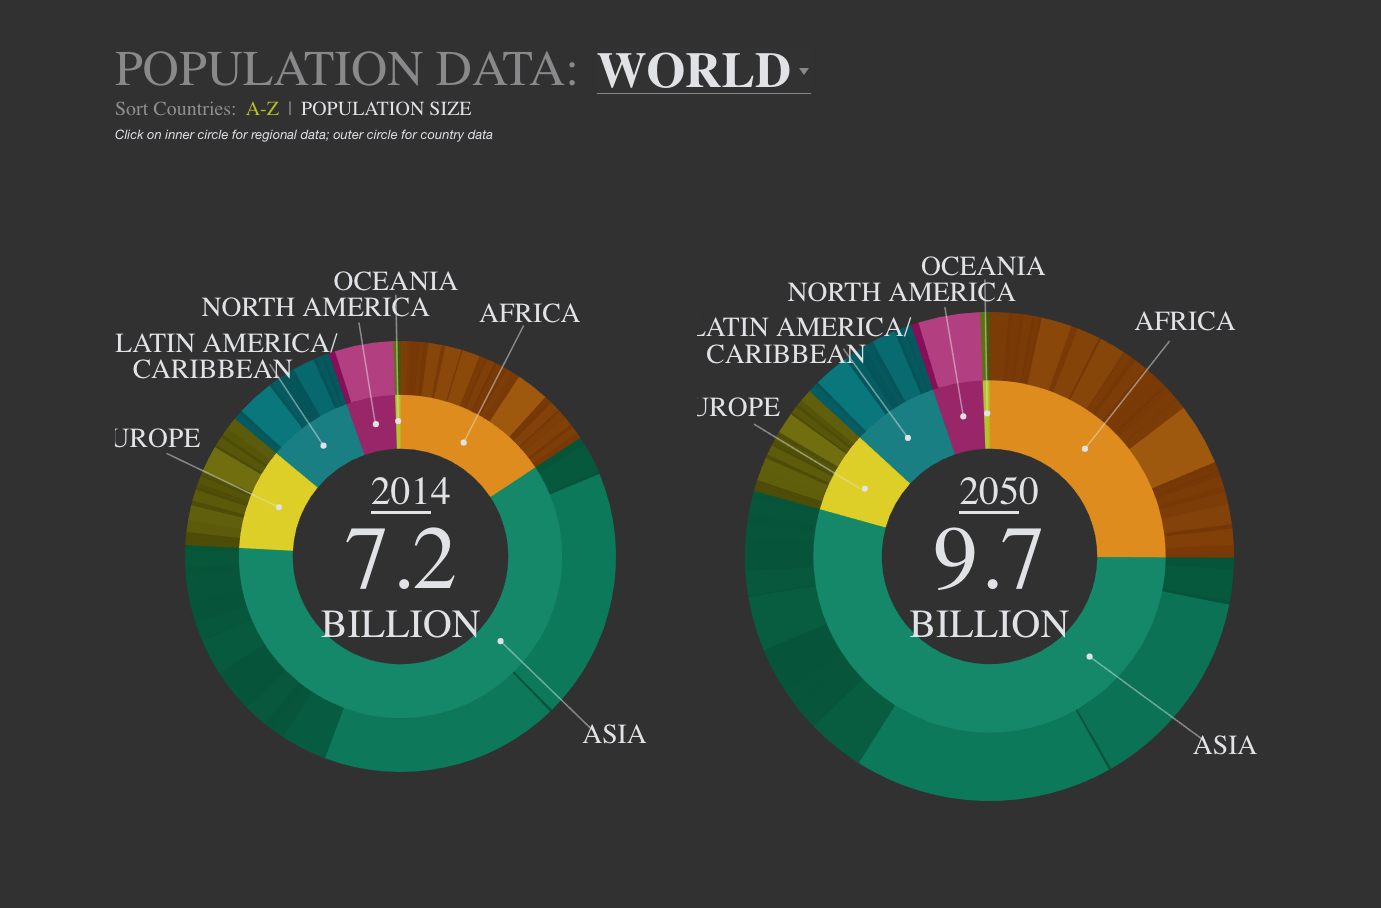 ">
">


 ">
">