


Quick Links

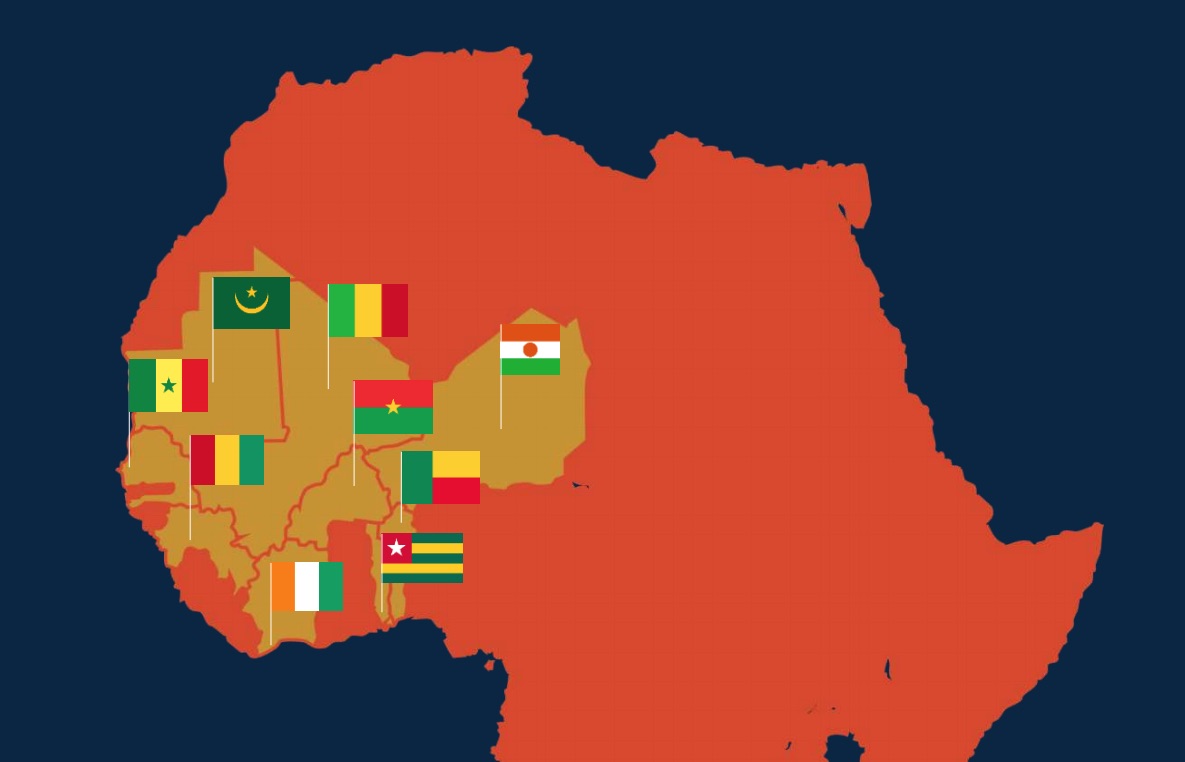
The Ouagadougou Partnership Young Ambassadors
The Ouagadougou Partnership Young Ambassadors
Des Jeunes Ambassadeurs Presentations


 ">
">
(February 2011) The core issues of population studies are among the central concerns of our societies and those we study, and have been for a very long time. This fact is widely recognized inside and outside the population profession. As Charles Hirschman notes, “Ever since the days of Malthus and Graunt, demographers have had an abiding interest in public affairs.”1 The late Senator Daniel Patrick Moynihan said, “[T]here is simply nothing so important to a people and its government as how many of them there are, whether their number is growing or declining, how they are distributed as between different ages, sexes…and different social classes and racial and ethnic groups…”2
Support for population studies on the scale we experience it today is justified by the discipline’s expected social utility, by the hope that research results can improve well-being. How well population research satisfies that expectation is difficult to measure, but the goal that population studies should be useful has been a guiding principle of the discipline.
Given the well-established link between population studies and public welfare, a priority of population scientists should be public demography, which I define as an effort to reach a public audience with demographic analysis and summaries of our research results, discussions about what these results mean, and what, if any, action the public and its elected and appointed officials ought to take based on what we have learned.
This paper outlines what I mean by public demography; highlights why public demography is important; suggests ways to implement a public demography agenda; and addresses some prominent objections to these suggestions.
My ideas about public demography have been shaped by the work of Michael Burawoy.3 In his 2004 presidential address to the American Sociological Association and in articles and presentations before and after that, Burawoy distinguishes and describes four types of sociology—professional, critical, policy, and public.4 But a less complex model posits that a professional can take on several of these roles simultaneously or over the span of one’s career.
Peter J. Donaldson is president of the Population Council, and was president of the Population Reference Bureau.
References
-
- Charles Hirschman, “The Future of Demography,” Asian Population Studies 4, no. 3 (2008): 233-34.
-
- Daniel Patrick Moynihan, “The Most Important Decision-Making Process,” Policy Review 1 (Summer 1977): 89-93.
-
- Burawoy’s public sociology publications and comments from others, accessed at http://burawoy.berkeley.edu/PS.htm, on Aug. 27, 2008.
-
- Michael Burawoy, “For Public Sociology,” American Sociological Review 70, no. 1 (2005): 4-28. The characteristic activity of professional sociology is basic research—the effort to advance theoretical and empirical knowledge within the framework of the discipline’s scientific norms. Critical sociology deconstructs and explores paradigm shifts. Policy sociology is concerned with applied research and concrete questions about public policies or service programs. Public sociology focuses on public interest and producing material that addresses the public’s concerns. A great deal of what demographers do is on the border between what Burawoy defines as “professional” and “policy” work. Formal demography, biometrics, the development of better methods and data collection procedures aside, demography is about issues of public concern. Think of the research of scholars such as Linda Waite on marriage, Sara S. McLanahan on children, or Douglas Massey on immigration.


 ">
">
Government policymakers and planners around the world use population projections to gauge future demand for food, water, energy, and services, and to forecast future demographic characteristics. Population projections can alert policymakers to major trends that may affect economic development and help policymakers craft policies that can be adapted for various projection scenarios.
The accuracy of population projections has been attracting more attention, driven by concerns about the possible long-term effects of aging, HIV/AIDS, and other demographic trends. The National Research Council of the U.S. National Academy of Sciences (NAS) convened a panel of experts in 1998 to examine the assumptions, accuracy, and uncertainty related to the most widely used population projections and to recommend ways to improve these projections. After extensive review, the panel concluded in July 2000 that current world population projections to the year 2050 are based on sound scientific evidence and provide plausible forecasts of demographic trends for the world. The panel cautioned, however, that projections for specific countries, for certain population groups, or for longer periods in the future are less certain than global and shorter-range projections.
Users of population projections need to understand the reliability and the limitations of projection series. Awareness of how projections are prepared and the possible sources of uncertainty in the numbers can help policymakers more effectively incorporate projections in their planning process.
Who Makes Population Projections?
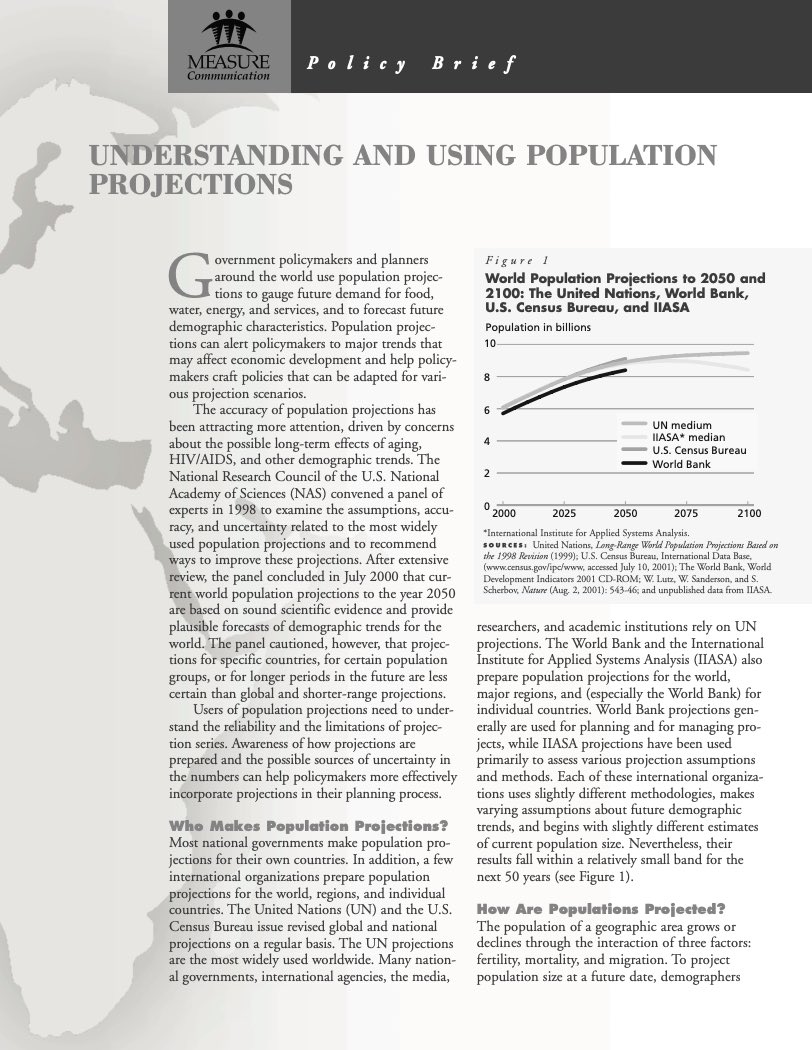
Most national governments make population projections for their own countries. In addition, a few international organizations prepare population projections for the world, regions, and individual countries. The United Nations (UN) and the U.S. Census Bureau issue revised global and national projections on a regular basis. The UN projections are the most widely used worldwide. Many national governments, international agencies, the media, researchers, and academic institutions rely on UN projections. The World Bank and the International Institute for Applied Systems Analysis (IIASA) also prepare population projections for the world, major regions, and (especially the World Bank) for individual countries. World Bank projections generally are used for planning and for managing projects, while IIASA projections have been used primarily to assess various projection assumptions and methods. Each of these international organizations uses slightly different methodologies, makes varying assumptions about future demographic trends, and begins with slightly different estimates of current population size. Nevertheless, their results fall within a relatively small band for the next 50 years (see Figure 1).
Figure 1
World Population Projections to 2050 and 2100: The United Nations, World Bank, U.S. Census Bureau, and IIASA
*International Institute for Applied Systems Analysis.
Sources: United Nations, Long-Range World Population Projections Based on the 1998 Revision (1999); U.S. Census Bureau, International Data Base, (www.census.gov/ipc/www, accessed July 10, 2001); The World Bank, World Development Indicators 2001 CD-ROM; W. Lutz, W. Sanderson, and S. Scherbov, Nature (Aug. 2, 2001): 543-46; and unpublished data from IIASA.
How Are Populations Projected?
The population of a geographic area grows or declines through the interaction of three factors: fertility, mortality, and migration. To project population size at a future date, demographers make assumptions about levels of fertility and mortality and about how many people will move into or out of an area before that date. The net population increase or decrease over the period is added to the “baseline” (beginning) population to project future population.
All of the major international agencies that project populations base their projections on current population estimates and assumptions about how fertility, mortality, and migration will change over time. Recent projection methodologies have focused on identifying uncertainty in projections — that is, on developing estimates of the probability that the future population size will fall within a certain range. Demographers try to measure the uncertainty of population projections by consulting other experts; analyzing errors in previous projections; and examining trends in fertility, mortality, and migration.
How Accurate Are Projections?
The accuracy of current population projections cannot be directly evaluated, but the success of previous global and country-level projections can be examined. Twelve times since the 1950s, the UN has projected the world population size for the year 2000. All but one of these projections has been off by less than 4 percent.
Projections for specific countries and age groups have not been as accurate, however. In general, projections of future population size tend to be more uncertain, or less accurate:
- For less developed countries than for more developed countries, partly because the former tend to have less reliable data on the current population size and birth and death rates;
- For smaller countries than larger ones, in part because analysts devote more attention to larger countries;
- For younger and older age groups than for middle age groups, because incorrect assumptions about fertility and mortality have a greater effect at older and younger ages;
- At the country level than at the regional or global level, because errors at the country level tend to cancel each other when aggregated to regions or to the world; and
- For longer periods (more than two decades) than shorter periods, because of the compounding effects of incorrect assumptions over time.
Which errors are most important? In short-term projections, inaccuracies in the population data at the beginning point of a projection are the most important source of error. For long-term projections, assumptions about future fertility, mortality, and migration trends have a greater effect on accuracy.
What Will Determine Future Population Trends?
Population change reflects the interplay of fertility, mortality, and migration, but in less developed regions, where fertility levels are high, fertility has the greatest effect on future population size. Years of high fertility produce a young population age structure, which generates momentum for future growth as these youth begin having their own families. Today, average fertility in less developed countries is 3.2 children per woman, or one child more than “replacement-level fertility,” in which couples have about two children each and replace themselves in the population.
Fertility
In the latter half of the 20th century, fertility fell nearly everywhere in the world, although not at the same pace (see Figure 2). Based on evidence from the last half century, demographers and other researchers have formulated several theories about the likely path of fertility decline in more developed and less developed countries.
Figure 2
Patterns of Fertility Decline: India, Argentina, and Thailand, 1970–1996
Note: Total fertility rate is the average total number of children a woman would have given current birth rates.
Sources: Registrar General of India; Instituto Nacional de Estadística (Argentina); United Nations Population Division; and Population Reference Bureau estimates.
Demographers generally assume that fertility will eventually stabilize at a specific level in every country, usually at replacement level. In most industrialized countries (not including the United States), average fertility is now below the two-child-per-woman replacement level, and experts have been engaged in a spirited debate about whether fertility will continue to fall, level off, or rise again to stabilize at replacement level.
Most countries, however, have above replacement-level fertility, and the UN has assumed that their fertility rates will decline to replacement level and remain constant thereafter. Although the 1980s and 1990s saw rapid fertility decline in a number of countries, most projection series show the pace of decline slowing as countries reach lower fertility levels. Demographers are less certain about the timing and extent of the decline. The various projection scenarios published by the UN and other agencies reflect different assumptions about future fertility decline (see Figure 3).
Figure 3
World Population Projections to 2050 Under Three Assumptions of Fertility
Note: The TFR (total fertility rate) is the average total number of children a woman would have given current birth rates.
Source: United Nations, World Population Prospects: The 2000 Revision (2001).
Mortality
Continuing improvements in health and healthcare worldwide have prompted the UN to increase its assumptions of the ultimate limits of life expectancy each time it produced new population projections. Each time, demographers had underestimated gains in life expectancy. While these underestimates of life expectancy had little effect on overall population totals, they understated the future size of elderly populations and, accordingly, the looming challenges of population aging for retirement and social security programs.
The HIV/AIDS epidemic represents an unexpected demographic crisis: It has lowered the projected life expectancy for sub-Saharan Africa, in particular, where infection rates are above 2 percent of the population in 45 countries. In the nine most affected countries (mostly in eastern and southern Africa), current UN estimates show that AIDS mortality lowers the projected 2015 population by nearly 18 percent compared to what it would have been without AIDS. If exceptionally high rates of infection are contained within a small number of countries, HIV/AIDS will have a moderate effect on population growth in Africa. But if HIV/AIDS prevalence reaches similarly high levels in other sub-Saharan regions, as well as in Asia, Latin America, and Eastern Europe, HIV/AIDS could lower life expectancy in these regions and affect world population growth.
Migration
Future international migration is more difficult to project than fertility or mortality because migration flows often result from short-term changes in economic, social, or political factors that are hard to predict or quantify. Migration can have a significant effect, however, on population change in specific countries and regions: International migration accounted for nearly half of the population growth rate in more developed countries in the 1990s, for example. Flows of refugees following political or civil unrest have also altered the demographic landscape in some less developed countries.
No methods exist to predict sudden mass migrations generated by political, economic, or environmental crises. The best demographers can do is to revise their estimates as soon as new information is available.
What Do Projected Trends Imply?
Social, economic, and environmental changes, along with government policies, can influence future demographic trends — especially fertility levels — which ensure some uncertainty in population projections. Because of the compounding effects of past fertility levels on a population’s age structure, and the inherent uncertainty in projecting future trends, the long-range scenarios from various institutions span a wide range. Nevertheless, there are some similarities between the central or “most likely” projections and between the plausible ranges of population size projected by different institutions.
The U.S. Census Bureau pegs world population at 9.1 billion in 2050, compared with 9.3 billion for the latest medium projection by the UN, 8.7 billion from the World Bank, and 8.8 billion from IIASA. By 2100, the differences in the central estimates of these institutions widen to a billion or more, and differences between the low and high scenarios span more than 10 billion — from 4 billion to 16 billion.
The NAS panel recommended, among other things, that demographers develop new ways to characterize the uncertainty that is associated with any population forecast: Demographers should state the probability that future world population will be, for example, between 10 billion and 12 billion. These methodological refinements, along with continued improvements in the assumptions used to create projections, will make the projections more valuable for a wider range of users. When users are aware of the assumptions behind the estimates, they can make informed judgments about the most likely scenario for a particular population.
How Can Policymakers and Program Planners Best Use Projections?
Policymakers and program planners can undertake several steps to make projections more useful for policy and planning purposes:
- Understand the causes of uncertainty in population projections and the implications of this uncertainty for plans and policies that span different time horizons and target specific population groups;
- Contribute to national and international efforts to collect more accurate demographic data — which would lead to more accurate assumptions about fertility, mortality, and migration and better projections; and
- Cooperate with national and international research efforts to develop more accurate projections by supporting organizations that investigate better projection methodologies, the demographic effect of HIV/AIDS, the effect of policies and programs on fertility trends, and similar topics.
This brief summarizes the major findings of the Panel on Population Projections of the National Research Council of the U.S. National Academy of Sciences and includes portions of a Population Reference Bureau Population Bulletin by Brian O’Neill and Deborah Balk (see references at below). PRB gratefully acknowledges contributions and comments from Michal Avni, John Bongaarts, Rodolfo Bulatao, Barney Cohen, Bessie Lee, and Ellen Starbird. This work has been funded by the U.S. Agency for International Development (USAID) under the MEASURE Communication project (HRN-A-00-98-000001-00).
For Further Information
Haupt, Arthur, and Thomas T. Kane. Population Handbook. 4th ed. Washington, DC: Population Reference Bureau, 1998.
National Research Council. Committee on Population. Panel on Population Projections. Beyond Six Billion: Forecasting the World’s Population, ed. John Bongaarts and Rodolfo A. Bulatao. Washington, DC: National Academy Press, 2000.
United Nations. World Population Prospects: The 2000 Revision Highlights. New York: UN, 2000. Available online at www.un.org/esa/
population/unpop.htm.
International Institute for Applied Systems Analysis, Population Project: www.iiasa.ac.at/research/pop/
The World Bank: www.worldbank.org/data/
United Nations Population Division, Population Information Network: www.undp.org/popin/
United States Census Bureau, International Programs Center: www.census.gov/ipc/www/
(November 2000) International negotiations aimed at ameliorating climate change have generally focused on consumption patterns in industrialized countries rather than global population growth. Industrialized countries have produced the bulk of greenhouse gas emissions to date: The United States alone accounted for 23 percent of total world CO2 emissions in 1996, according to the U.S. Department of Energy’s Carbon Dioxide Information Analysis Center (CDIAC). The staggering levels of emissions in more developed countries stem mainly from consumption patterns that lead to high per capita emissions (see Figure 1). In 1996, U.S. per capita emissions of carbon dioxide stood at 20.0 metric tons, while for Germany and Japan the figures were 10.5 and 9.3 metric tons, respectively. In contrast, the global average for that year was 4.0 metric tons per capita. For sub-Saharan Africa, it was 0.8 metric tons.
Figure 1
Per Capita Carbon Dioxide Emissions, Top Ten Countries, 1996 (metric tons)
Source: U.S. Department of Energy, Carbon Dioxide Information Analysis Center, published in the World Bank’s World Development Indicators 2000.
The developing world is fast becoming a substantial contributor to climate change, however. With economies and populations in less developed countries growing considerably, so are their levels of greenhouse gas emissions. In China, emissions of carbon dioxide rose from 1.5 to 2.8 metric tons per capita between 1980 and 1996, while the population increased from 984 million to 1.22 billion. As a result, China accounted for 15 percent of the world’s total emissions in 1996, second only to the United States (see Figure 2). Less developed countries altogether accounted for 23 percent of worldwide emissions in 1996, as opposed to under 17 percent in 1980.
In the long run, efforts to curb climate change will have to address both consumption patterns that contribute to high per capita emissions as well as the growing number of consumers worldwide. To involve less developed countries in the solution, future climate change agreements are likely reflect the view that people of the world enjoy equal rights to use the atmosphere to dispose of the carbon generated by fossil fuel combustion. If adopted, such a principle would make the overall size of the human population a critical variable. The larger the population becomes, the lower the average per capita level of emissions commensurate with acceptable levels of greenhouse gas production. In other words, as population grows, each individual’s right to pollute shrinks.
Figure 2
Total Carbon Dioxide Emissions: Top Ten Countries, 1996 (million metric tons)
Source: U.S. Department of Energy, Carbon Dioxide Information Analysis Center, published in the World Bank’s World Development Indicators 2000.
Population growth also increases the number of people who will be affected by climate change, though it remains unclear how specific communities will be affected. In addition to rising temperatures and changing weather patterns, a number of less obvious effects could occur. Agricultural productivity might be boosted in some areas, but disrupted in others, worsening malnutrition. Global warming could also lead to a redistribution of disease-carrying insects, introducing unaccustomed human populations to such diseases as malaria, dengue fever, yellow fever, and encephalitis.
The Intergovernmental Panel on Climate Change has identified Africa as the continent that is most vulnerable to the impacts of the projected changes because widespread poverty limits adaptation capabilities. But other regions will be affected as well. Countries with large coastal populations — China, India, and the United States, for example — may have to contend with extensive damage from rising sea levels. In countries that are susceptible to flooding such as Bangladesh, more severe storms and changing rainfall patterns could exacerbate existing problems, endangering communities that already live on vulnerable land. In the end, there will no doubt be additional, unanticipated effects: The full range of climate change’s impact remains to be seen.
Bingham Kennedy, Jr. is an associate editor at the Population Reference Bureau.