Crowds in a stadium with cots.

Disasters Raise Risk of a Homeless Undercount in 2020 Census

Counting people experiencing homelessness is not an easy task during any census, and the coronavirus pandemic, wildfires, and hurricanes have made the process even more complicated in 2020.

Despite rigorous efforts by the Census Bureau to count everyone in the United States, many people experiencing homelessness are likely to be missed in the 2020 Census count. The Census Bureau had already identified people experiencing homelessness as a hard-to-count population because they have more difficulty accessing the typical modes of responding to the survey—by internet, phone, or mail—than people with a permanent address.1 Then the pandemic’s effects on everyday life delayed census field operations. The rescheduled dates to count people experiencing homelessness—Sept. 22-24, 2020—place count efforts in the middle of peak wildfire and hurricane seasons. This confluence of crises magnifies the challenge of conducting a complete and accurate count of an often-overlooked population.

Counting People Where They Sleep

The goal of the 2020 Census is to count everyone once, only once, and at their “usual residence.” Usual residence is defined as the location where a person lives and sleeps most of the time. If people do not have a permanent home, they should be counted at the location where they are on Census Day, April 1, 2020. For people experiencing homelessness, their location on Census Day may be unsheltered (including living in a vehicle), at a shelter or transitional housing, at a hotel or motel, or doubled up in another household.

People who are doubled-up on Census Day should be counted in the household where they are staying on that day, and the census questionnaire includes prompts to help ensure everyone is counted. But the Census Bureau has identified the doubled-up population as hard-to-count because, despite prompts in the questionnaire, they may still be missed.

For people staying at shelters and those who are unsheltered, the Census Bureau aims to count people at the locations where they receive services, like soup kitchens, shelters, and mobile food vans, and at targeted outdoor locations like parks, under bridges, at bus depots, and other areas. To identify such count locations, the Census Bureau uses a combination of internet research and outreach to local elected officials and advocacy organizations.

Due to the coronavirus pandemic, however, both service-based and outdoor count operations were delayed. Service-based enumeration, originally scheduled for March 30 to April 1, has been delayed to September 22-24. The outdoor count, originally scheduled for April 1, will now take place from September 23-24. Because of these delays, people will no longer be counted where they were on April 1 but rather where they are staying in September. This shift—and the reasons for it—raise questions: Are the same service locations open? Are the same people using those services? Are people avoiding services to reduce their risk of exposure to the coronavirus that causes COVID-19, making them even harder to enumerate? All of these issues complicate the count of people experiencing homelessness in 2020.

Counting During Crises Heightens the Risk of Undercount

The shift in operations has also moved the count into peak hurricane and wildfire seasons. Just as census enumerators are preparing to count people outdoors and at service-based locations, serious natural disasters are ravaging parts of the nation. Wildfires have led to hazardous air quality across much of the West Coast, forcing many people to stay indoors. Hurricane Sally, which hit the Gulf Coast on Sept. 16, 2020, has severely damaged infrastructure across several states. People who would normally be outdoors may not be in their “usual” locations, and services may be dramatically disrupted in areas that have been affected by disasters.

The closure of libraries and other community facilities further compounds the challenge of counting. If people experiencing homelessness are missed in service-based and unsheltered enumeration, they can still self-respond to the census through September 30. Public facilities such as libraries, schools, and community centers were expected to serve as outreach locations for 2020 Census self-response. At libraries, for example, people without access to the internet or a computer could learn about the census and use a computer to respond online. However, due to the coronavirus pandemic, many of these facilities are closed. Even if a facility is open, people may avoid public places to lower their risk of contracting the coronavirus.

Communities Could Lose Crucial Funding For Services

Official estimates of homelessness in the United States range from 568,000 to more than 1.5 million people (and both are underestimates). Given those staggering numbers, the Census Bureau faces a major challenge in enumerating this large, hard-to-count population. And because of ongoing natural disasters and the economic effects of the coronavirus pandemic, it’s likely that the number of people experiencing homelessness has increased in 2020.

The 2020 Census will be used to reapportion congressional seats, redraw voting districts, and allocate more than $1 trillion in federal funds each year—including funds that assist people experiencing homelessness. Data from the 2020 Census will be used by governments and nonproft organizations to determine needs for roads, hospitals, and other public services. An undercount of people without a permananent address would reduce funds for programs that serve the United States’ most vulnerable residents. Such an undercount will be magnified in local areas with large numbers of people experiencing homelessness and in areas where the count will be most disrupted. Communities hit the hardest by the pandemic and natural disasters could lose crucial funding.

As one of several vital nationwide operations destabilized by the coronavirus pandemic, wildfires, and hurricanes, the 2020 Census faces more challenges than usual in counting people experiencing homelessness. But a complete and accurate count is vital to supporting these populations and the communities that serve them.

References

1U.S. Census Bureau, “Counting the Hard to Count in a Census,” Select Topics in International Censuses, July 2019, https://www.census.gov/content/dam/Census/library/working-papers/2019/demo/Hard-to-Count-Populations-Brief.pdf

0620f-census-undercount

2020 Census Self-Response Rates Are Lagging in Neighborhoods at Risk of Undercounting Young Children

2020 Census Self-Response Rates Are Lagging in Neighborhoods at Risk of Undercounting Young Children

U.S. 2020 Census self-response rates are lagging in neighborhoods with a very high risk of undercounting young children, according to a new analysis by Population Reference Bureau (PRB).

As of June 25, 2020, the average self-response rate in census tracts with a very high risk of undercounting young children was 55%, while self-response rates in tracts with a low risk of undercounting young children—or a potential net overcount—were much higher, at 69%. The mean response rate across all census tracts in the United States was almost 62% (see Table 1).

TABLE 1. Average 2020 Census Self-Response Rates Across Census Tracts, by Risk of Undercounting Young Children

Tracts Average Tract-Level Response Rate (%)
All census tracts in the United States 61.5 %
All census tracts in large counties 63.0 %
Census tracts with a low risk of undercounting young children 69.1
Census tracts with a high risk of undercounting young children 64.5 %
Census tracts with a very high risk of undercounting young children 55.3 %

Notes: Data on response rates reflect rates as of June 25, 2020. Large counties are the 689 counties that had at least 5,000 children ages 0 to 4 in the 2010 Census.
Source: PRB analysis of data from the U.S. Census Bureau.

Data on the risk of child undercount are available for census tracts in 689 large counties—those with at least 5,000 children under age 5 in 2010. Collectively, these 689 counties accounted for about 93% of the national net undercount of young children in the 2010 Census. As of mid-June, the average 2020 Census self-response rate across tracts in these counties was 63%.

The following interactive figure shows a map of Washington, DC, which exhibits a sharp east-west divide in self-response rates and the risk of undercounting young children. Census tracts shaded dark red are those with a very high risk of undercounting young children and very low self-response rates (less than 49% as of June 25, 2020).

FIGURE. Risk of Undercounting Young Children and 2020 Census Self-Response Rates in the Washington, DC Area, by Census Tract (June 25, 2020)

Source: PRB analysis of data from the U.S. Census Bureau.

Just 20 counties—mostly located in California, New York, and Texas—account for 41% of all young children living in very high-risk census tracts (see Table 2). A few of these counties stand out because they have both large numbers and shares of children living in very high-risk neighborhoods, in combination with relatively low self-response rates. For example, 84% of children under age 5 in Miami-Dade County, Florida (132,235), live in neighborhoods with a very high risk of undercounting young children, and the average self-response rate in that county in late June was 59%, which is below the average across all large counties (63%). Over two-thirds of young children in Hidalgo County, Texas, live in very high-risk neighborhoods, and the mean self-response rate in that county was 46% in late June.

TABLE 2. 2020 Census Self-Response Rates in 20 Counties With the Largest Numbers of Young Children Living in Very High-Risk Census Tracts

wdt_ID Counties Number of Young Children Living in Very High-Risk Tracts Percent of Young Children Living in Very High-Risk Tracts Average Tract-Level Response Rate (%)
1 All large counties 4,062,432 24.7 63.0
2 Los Angeles County, CA 290,389 46.5 57.8
3 Harris County, TX 140,160 39.7 55.0
4 Miami-Dade County, FL 132,235 84.0 58.6
5 Cook County, IL 130,949 39.9 59.9
6 Kings County, NY 94,935 49.0 48.8
7 Queens County, NY 91,986 63.5 51.0
8 Bronx County, NY 87,466 82.5 52.9
9 Dallas County, TX 86,532 42.2 57.9
10 Broward County, FL 71,264 63.9 59.1
11 Philadelphia County, PA 69,185 64.2 50.9
12 Maricopa County, AZ 55,238 19.8 62.2
13 Hidalgo County, TX 54,216 67.7 46.4
14 Orange County, CA 52,528 27.8 71.0
15 Wayne County, MI 45,665 39.6 61.9
16 San Diego County, CA 45,340 21.4 67.5
17 San Bernardino County, CA 44,715 28.9 59.5
18 El Paso County, TX 42,160 64.7 58.8
19 Santa Clara County, CA 41,967 35.4 71.3
20 Bexar County, TX 39,492 28.5 59.7
21 Riverside County, CA 36,421 23.1 60.5

Note: Data on response rates reflect rates as of June 25, 2020. Large counties are the 689 counties that had at least 5,000 children ages 0 to 4 in the 2010 Census.
Source: PRB analysis of data from the U.S. Census Bureau.

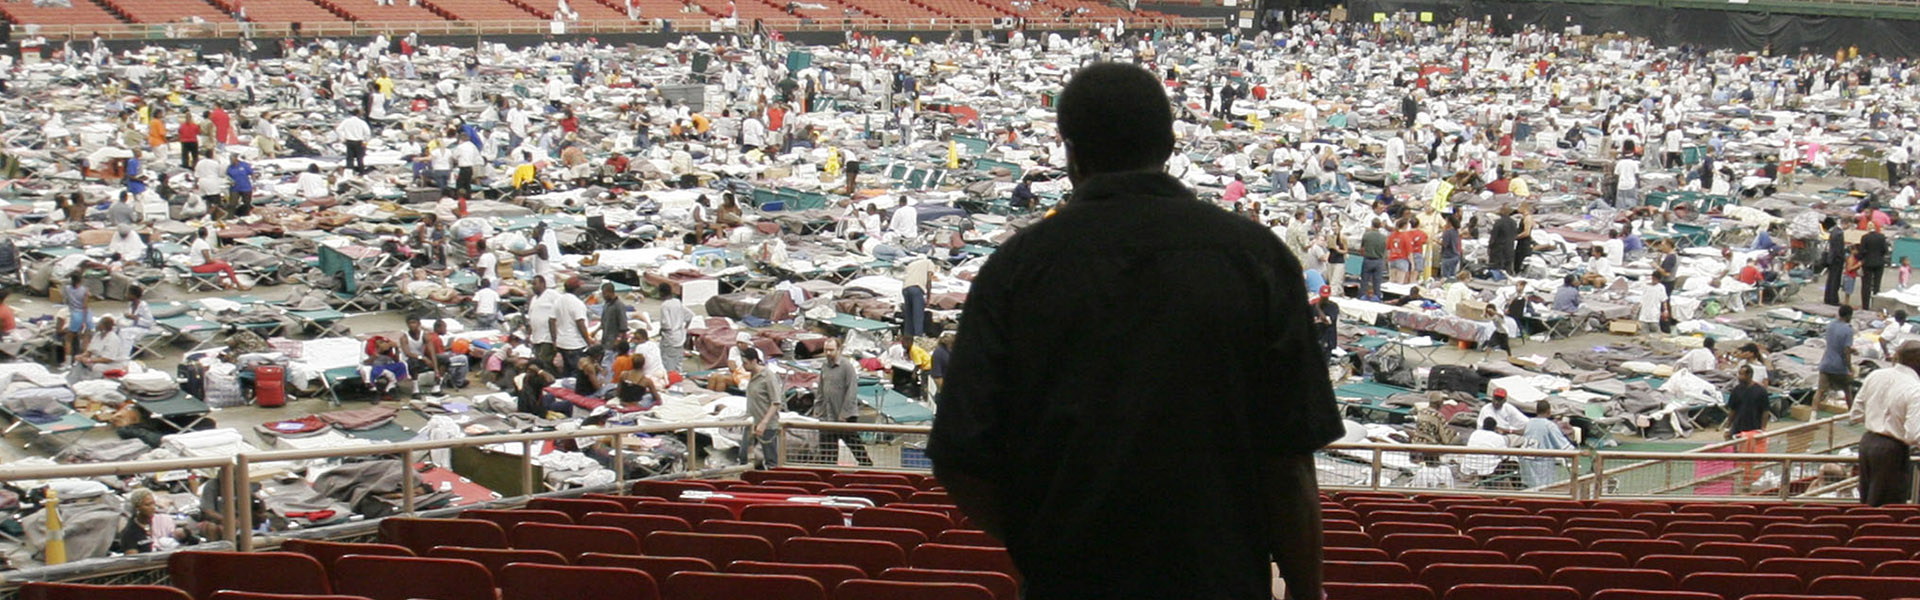
Why does it matter if a neighborhood has a large share of households that have not responded to the census? Low self-response rates could lead to less accurate counts and fewer dollars for communities that need those funds the most. Accurate census data ensure that funding is equitably distributed for numerous programs benefitting children and families, such as the National School Lunch Program and Head Start. Census Bureau data are used to distribute more than $675 billion in federal funds to states and local communities for health, education, housing, and infrastructure programs each year.

Response Rates Are Lower in Neighborhoods With Higher Concentrations of Black, American Indian, and Latinx Children

Self-response rates were lowest in neighborhoods with high concentrations of racial and ethnic minorities in the young child population. The mean self-response rate for all tracts where Blacks make up the majority of young children was 51%, compared with 64% for tracts with a majority of non-Hispanic White children. The average self-response rate was just 21% in tracts with a majority of American Indian/Alaska Native children, which probably reflects the delayed start of the Census Bureau’s Update Leave operation in many rural areas. The average self-response rate for tracts with a majority of Latinx children was also relatively low, at 54%. The mean self-response rate was 62% in neighborhoods with a majority of Asian American children under age 5—similar to the average rate for neighborhoods with a majority of non-Hispanic White children.

These low response rates in communities of color are important because historically, certain racial and ethnic groups have faced a higher risk of being missed in the decennial census. Results from the 2010 Census show that among children under age 5, the net undercount rate was 7.5% for Latinx children and 6.3% for children classified as Black alone or in combination with one or more other races. The net undercount rate for all children under age 5 was 4.6%—higher than any other age group.

Identifying Neighborhoods to Target for Outreach

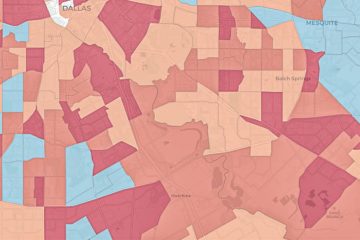
PRB has developed a series of maps and databases, which are being updated on a weekly basis, to help improve targeting of communities where children are most likely to be missed in the census. These resources highlight census tracts with a very high risk of undercounting young children and low 2020 Census self-response rates.

Interactive maps

Users can zoom in and out of these maps to view patterns in their states and local areas and can click on a census tract to view the tract FIPS code, undercount risk category, 2020 Census self-response rate, and estimated number of children under age 5 in 2014-2018.

The maps are divided into 11 separate files, covering all 50 states and the District of Columbia.

Each database includes data on the risk of undercounting young children, the latest 2020 Census self-response rates, weekly change in response rates, key predictors of child undercount, and the racial/ethnic composition of the young child population.

  • State-County FIPS code.
  • State FIPS code.
  • State abbreviation.
  • State name.
  • County FIPS code.
  • County name.
  • Tract code.
  • Undercount of young children risk category.
  • 2020 Census self-response rate.
  • Weekly change in 2020 Census self-response rate.
  • Number of children ages 0 to 4.
  • Total population.
  • Percent of population that are young children ages 0 to 4.
  • Population ages 0 to 4 that is Black Alone.
  • Population ages 0 to 4 that is American Indian and Alaska Native Alone.
  • Population ages 0 to 4 that is Asian Alone.
  • Population ages 0 to 4 that is Native Hawaiian/Other Pacific Islander Alone.
  • Population ages 0 to 4 that is Two or More Races.
  • Population ages 0 to 4 that is White Alone, Not Hispanic.
  • Population ages 0 to 4 that is Hispanic or Latino.
  • Percent of children ages 0 to 4 in families with incomes below 100% of poverty.
  • Percent of adults ages 18 to 34 with less than a high school diploma.
  • Percent of children ages 0 to 17 living in a female-headed household.
  • Percent of children ages 0 to 5 living with grandparents.
  • Percent of households that are limited-English speaking.
  • Percent of children ages 0 to 5 living in immigrant families.
  • Percent of population living in renter-occupied housing units.

About These Estimates

The Census Bureau calculates household self-response rates for geographic areas that receive their census invitations in the mail, as well as households in Update Leave areas that receive their census invitation and paper form when a census taker drops off a package of materials at their residence.

Net undercounts represent a balance between two groups. One group is people omitted from the Census. The second group is erroneous enumerations (mostly people counted twice) and whole-person imputations.

The estimated risk of undercount for young children is based on PRB’s analysis of American Community Survey estimates and the U.S. Census Bureau’s Revised 2018 Experimental Demographic Analysis Estimates for young children. Data are based on 2020 Census tract boundaries.

While 2020 Census self-response rates are available for 2020 Census tracts, PRB’s original database on the undercount of children is based on 2010 Census tract boundaries. PRB matched 2010 Census tracts to 2020 Census tracts using a crosswalk file provided by the Census Bureau.

For a detailed description of the methods and data sources used to predict child undercount risk, please refer to William P. O’Hare, Linda A. Jacobsen, Mark Mather, and Alicia Van Orman’s report, Predicting Tract-level Net Undercount Risk for Young Children.

Acknowledgement

This research was funded by The Annie E. Casey Foundation, Inc., and we thank them for their support. The findings and conclusions presented in this report are those of the authors alone and do not necessarily reflect the opinions of the Foundation.

We also thank Dr. William P. O’Hare for all his work on the undercount of children in the census and for providing expert guidance to PRB staff on this project.

If you have any questions, please contact Mark Mather at PRB.