
 ">
">
Appalachia’s unemployment and poverty rates remain above levels seen before the economic downturn of 2007-2009, suggesting an incomplete economic recovery, especially in many of the Region’s most rural counties, according to a new Population Reference Bureau (PRB) report for the Appalachian Regional Commission.
The Appalachian Region: A Data Overview From the 2011-2015 American Community Survey—co-authored by Kelvin Pollard, PRB senior demographer, and Linda A. Jacobsen, PRB vice president of U.S. Programs—compares newly released American Community Survey data for 2011-2015 with 2006-2010 data to show trends in income, employment, and other indicators at the regional, subregional, state, and county levels. The Region encompasses 205,000 square miles along the Appalachian Mountains from southern New York to northern Mississippi, including portions of 12 states and all of West Virginia.
Although Appalachia’s 2011-2015 unemployment rate matched the national average of 6.9 percent, it was still slightly higher than in 2006-2010. In addition, unemployment varied widely across the Region. For example, unemployment was less than 5 percent in 39 counties, with 29 of them located in New York, Pennsylvania, Virginia, and West Virginia—the states whose Appalachian sections had the lowest jobless levels. Conversely, the jobless rate was at least 10 percent in 54 counties—42 of which were outside metropolitan areas and 48 of which were in Central, South Central, and Southern Appalachia.
The report’s authors point to signs of a connection between unemployment and educational attainment: In 52 of the 54 Appalachian counties with double-digit unemployment, the share of 25-to-64-year-olds with at least a high school diploma was below the national average of 88 percent; in 27 of these counties, the share was below 80 percent.
During the 2011-2015 period, just 23 percent of adults ages 25 and over in Appalachia had at least a bachelor’s degree, which was seven percentage points lower than in the nation as a whole. The share was lower than the national average in 399 of the Region’s 420 counties. In the Appalachian sections of six states (Kentucky, Maryland, Mississippi, Ohio, Virginia, and West Virginia), the share with a bachelor’s degree or more was at least 10 percentage points below the national average.
However, the authors note that the share of adults with a four-year degree was two percentage points higher in 2011-2015 than in 2006-2010, and the share with at least a high school diploma rose three percentage points during the period, suggesting a continued trend toward greater educational attainment in the Region.
Since 2006-2010, the share of Appalachian residents in poverty (incomes below $24,036 for a family of two adults and two children in 2015) has risen 1.5 percentage points to 17.1 percent in 2011-2015. Poverty increased throughout the Region—in all subregions and among both rural and urban counties. The rise in poverty rates was especially high (more than two percentage points) in the Appalachian portions of Georgia, Maryland, North Carolina, and South Carolina.
Every age group under age 65 experienced an increase in poverty: Child poverty in Appalachia rose almost three percentage points (to 24 percent), and poverty among working-age adults increased nearly two percentage points. Although the overall rise in the poverty rate among Appalachian young adults (ages 18 to 24) of 1.2 percentage points was less than the national average of 1.8 percentage points, it was significantly higher in some parts of Appalachia—more than three percentage points higher in the Appalachian sections of Maryland and Virginia; and more than four percentage points greater in Appalachian North Carolina.
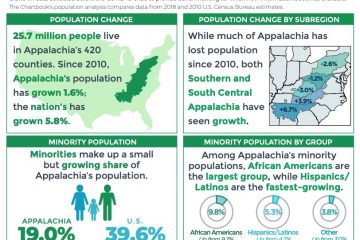
Overall, Appalachia’s population grew less than 2 percent between the two periods, less than half the national average. Growth was even slower in large parts of the Region: The Appalachian sections of Kentucky, New York, Ohio, Pennsylvania, and Virginia have actually lost population since 2006-2010.
Appalachia’s residents are older, on average, and less racially and ethnically diverse than the U.S. population as a whole, but these and other demographic, health, and socioeconomic patterns vary widely within the Region, the report shows.
The full report includes detailed tables and county-level maps, covering state- and county-level data on population, age, race and ethnicity, housing occupancy and tenure, education, labor force, employment and unemployment, income and poverty, health insurance coverage, disability status, migration patterns, and veteran status.


Appalachia’s unemployment and poverty rates remain above levels seen before the economic downturn of 2007-2009, suggesting an incomplete economic recovery, especially in many of the Region’s most rural counties, according to a new Population Reference Bureau (PRB) report for the Appalachian Regional Commission.
The Appalachian Region: A Data Overview From the 2011-2015 American Community Survey—co-authored by Kelvin Pollard, PRB senior demographer, and Linda A. Jacobsen, PRB vice president of U.S. Programs—compares newly released American Community Survey data for 2011-2015 with 2006-2010 data to show trends in income, employment, and other indicators at the regional, subregional, state, and county levels. The Region encompasses 205,000 square miles along the Appalachian Mountains from southern New York to northern Mississippi, including portions of 12 states and all of West Virginia.
Although Appalachia’s 2011-2015 unemployment rate matched the national average of 6.9 percent, it was still slightly higher than in 2006-2010. In addition, unemployment varied widely across the Region. For example, unemployment was less than 5 percent in 39 counties, with 29 of them located in New York, Pennsylvania, Virginia, and West Virginia—the states whose Appalachian sections had the lowest jobless levels. Conversely, the jobless rate was at least 10 percent in 54 counties—42 of which were outside metropolitan areas and 48 of which were in Central, South Central, and Southern Appalachia.
The report’s authors point to signs of a connection between unemployment and educational attainment: In 52 of the 54 Appalachian counties with double-digit unemployment, the share of 25-to-64-year-olds with at least a high school diploma was below the national average of 88 percent; in 27 of these counties, the share was below 80 percent.
During the 2011-2015 period, just 23 percent of adults ages 25 and over in Appalachia had at least a bachelor’s degree, which was seven percentage points lower than in the nation as a whole. The share was lower than the national average in 399 of the Region’s 420 counties. In the Appalachian sections of six states (Kentucky, Maryland, Mississippi, Ohio, Virginia, and West Virginia), the share with a bachelor’s degree or more was at least 10 percentage points below the national average.
However, the authors note that the share of adults with a four-year degree was two percentage points higher in 2011-2015 than in 2006-2010, and the share with at least a high school diploma rose three percentage points during the period, suggesting a continued trend toward greater educational attainment in the Region.
Since 2006-2010, the share of Appalachian residents in poverty (incomes below $24,036 for a family of two adults and two children in 2015) has risen 1.5 percentage points to 17.1 percent in 2011-2015. Poverty increased throughout the Region—in all subregions and among both rural and urban counties. The rise in poverty rates was especially high (more than two percentage points) in the Appalachian portions of Georgia, Maryland, North Carolina, and South Carolina.
Every age group under age 65 experienced an increase in poverty: Child poverty in Appalachia rose almost three percentage points (to 24 percent), and poverty among working-age adults increased nearly two percentage points. Although the overall rise in the poverty rate among Appalachian young adults (ages 18 to 24) of 1.2 percentage points was less than the national average of 1.8 percentage points, it was significantly higher in some parts of Appalachia—more than three percentage points higher in the Appalachian sections of Maryland and Virginia; and more than four percentage points greater in Appalachian North Carolina.
Overall, Appalachia’s population grew less than 2 percent between the two periods, less than half the national average. Growth was even slower in large parts of the Region: The Appalachian sections of Kentucky, New York, Ohio, Pennsylvania, and Virginia have actually lost population since 2006-2010.
Appalachia’s residents are older, on average, and less racially and ethnically diverse than the U.S. population as a whole, but these and other demographic, health, and socioeconomic patterns vary widely within the Region, the report shows.
The full report includes detailed tables and county-level maps, covering state- and county-level data on population, age, race and ethnicity, housing occupancy and tenure, education, labor force, employment and unemployment, income and poverty, health insurance coverage, disability status, migration patterns, and veteran status.
 ">
">
Appalachia’s residents in their prime working years are less likely to be in the labor force or to hold college degrees than the U.S. population as a whole, but these and other demographic, health, and socioeconomic patterns vary widely within the region, according to The Appalachian Region: A Data Overview From the 2009-2013 American Community Survey, prepared by the Population Reference Bureau (PRB) for the Appalachian Regional Commission.
The region—encompassing 205,000 square miles along the spine of the Appalachian Mountains from southern New York to northern Mississippi, including portions of 12 states and all of West Virginia—has continued to see its population grow. The latest estimates show the region had 25.4 million residents in 2013 (out of 316.1 million Americans nationwide), reflecting an increase of 200,000 people since the 2010 Census.
This report—co-authored by Kelvin Pollard, PRB senior demographer, and Linda A. Jacobsen, PRB vice president of U.S. Programs—found that during the 2009-2013 period, 73 percent of Appalachia’s civilians in the prime working ages (ages 25 to 64) were in the civilian labor force, slightly below the U.S. average of 78 percent. The share was noticeably lower in some parts of the region: Just 60 percent of working-age residents in central Appalachia and 65 percent of those in the region’s rural areas were in the labor force.
The authors suggest a possible connection between educational attainment and labor force participation. For example, in most of the counties with labor force participation rates matching or exceeding that of the nation, the share of working-age adults with at least a high school diploma was also at or above the U.S. average.
At nearly 22 percent, the share of adults with a bachelor’s degree or more was seven percentage points lower in Appalachia during the 2009-2013 period than in the nation as a whole. And the rate was lower than the national average in 400 of the region’s 420 counties.
However, the authors point out that the share of adults (both in Appalachia and nationwide) with a four-year degree was four percentage points higher in 2009-2013 than it was in 2000, suggesting a continued trend toward greater educational attainment.
The researchers also examined newly available American Community Survey data on fields of study. They found that among the adults in the region with at least a bachelor’s degree, 31 percent held an undergraduate degree in science or engineering—slightly lower than the national share of 35 percent. Science and engineering are key to U.S. competitiveness in the global economy, the authors note.
The full report includes detailed tables and county-level maps.
 ">
">
Appalachia’s residents remain older and have a higher disability prevalence than Americans as a whole, but overall demographic, health, and socioeconomic patterns vary widely within the region, according to The Appalachian Region: A Data Overview From the 2008-2012 American Community Survey, prepared by the Population Reference Bureau for the Appalachian Regional Commission.
The report also found that Appalachian residents had income and educational attainment levels that were below those for the nation. For example, at $43,600, median household income in the region was lower than the national median of $53,000. And 23 percent of working-age adults (ages 25 to 64) in Appalachia had at least a bachelor’s degree—the U.S. average was 30 percent. Homeownership, on the other hand, remained more common in Appalachia than in the rest of the country; nearly 72 percent of the region’s housing units were owner-occupied, compared with 66 percent for the U.S. as a whole.
This report also contains chapters on health insurance coverage in the region, disability status, and veteran status of the adult civilian population.
The Appalachian region covers 205,000 square miles along the Appalachian Mountains from southern New York to northern Mississippi, including parts of 12 states and all of West Virginia: a total of 420 counties. This report—co-authored by Kelvin Pollard, PRB senior demographer, and Linda A. Jacobsen, PRB vice president of U.S. Programs—finds that this region’s population has continued to grow: The latest population estimates indicate the region had 25.4 million residents in 2012 (out of 314 million Americans nationwide), compared to 25.2 million in the 2010 Census.
During the 2008-2012 period (a period of both economic decline and slow recovery), 18 percent of Appalachia’s prime working-age population (ages 25 to 64) were not covered by health insurance, slightly below the U.S. average of 19 percent. But the uninsured varied greatly by region: one-fifth of 25-to-64-year-olds in Central, Southern, and South Central Appalachia were uninsured. By comparison, northern Appalachia accounted for 56 of the region’s 68 counties where less than 15 percent of the working-age residents were uninsured.
Also during this period, 16 percent of Appalachia’s working-age residents reported having a disability, higher than the U.S. average of 12 percent. The American Community Survey defines disability as having difficulty in at least one of the following areas: hearing, vision, cognition, walking or climbing, self-care, or attending to the functions of independent living. Disability prevalence was particularly high in some parts of the region; the rate was 20 percent or more in 133 counties, nearly half of which were in Central Appalachia. The region’s relatively high disability rate corresponds to the population’s older age structure: In 112 of the Appalachian counties with the highest disability prevalence levels, at least 14.3 percent of the residents were age 65 or older.
The report also identifies the region’s adult civilians who were veterans (men and women who served on active duty in the U.S. Armed Forces, the National Guard or Reserves, or in the U.S. Merchant Marine during World War II). In the Appalachian region, slightly more than 10 percent of adult civilians were military veterans in 2008-2012, slightly greater than the U.S. rate of 9 percent. The prevalence was even higher in some counties: In 57 counties, at least 12 percent of civilian residents were veterans. Conversely, the veteran prevalence rate was lower than the national average in 121 counties.
The full report includes detailed tables and county-level maps.
 ">
">
In 2007, with the onset of the deepest economic recession in the United States since the Great Depression, Americans lost jobs and experienced sharp declines in the value of their homes and investments. Decreases in household wealth affect not only individual and household financial security, but also community and regional economic prosperity and growth. Given the history of economic difficulties in the Appalachian region, the Appalachian Regional Commission commissioned the Population Reference Bureau to analyze the effects of the recent recession on household wealth and economic well-being in Appalachia and to assess whether Appalachia has been disproportionately affected by the economic downturn.
The Appalachian region covers 205,000 square miles along the Appalachian Mountains from southern New York to northern Mississippi, including parts of 12 states and all of West Virginia.
Using data from the 2000 Census (1999 data for income) and the Census Bureau’s American Community Survey for the period from 2005 through 2011, the report, Household Wealth and Financial Security in Appalachia, examined changes in indicators of household wealth and economic well-being for Appalachian counties, subregions, county types, and economic status categories; analyzed the most current (2007-2011) indicators of household wealth and economic well-being in Appalachia to assess the degree of recovery from the recession; and identified how closely county differences in housing value are associated with county differences in economic status.1
The report’s findings suggest that housing wealth is just as important to county economic well-being as employment. Higher housing wealth in a county is associated with better economic status, and a county’s economic conditions affect its wealth accumulation. Thus, counties with higher aggregate wealth might have a buffer when economic conditions begin to deteriorate, and counties with a history of worse economic status will not only suffer immediately but will experience more-difficult economic conditions for a longer period than counties that have historically been better off.
During the recent recession, the Appalachian region did experience a disproportionate decline in median household income and an increase in the poverty rate, compared with the United States as a whole. However, although homeownership rates and average home values did decline in Appalachia, these declines were not as steep as for the rest of the nation. In contrast, the share of homeowners spending more than 30 percent of their income on housing (the average spending on housing for the country) increased in Appalachia. And both the share of households with interest and other nonwage income and the average amount of such income declined more in Appalachia than in the rest of the United States.
References
- Linda A. Jacobsen, Marlene Lee, and Kelvin Pollard, Household Wealth and Financial Security in Appalachia, (Washington, DC: Appalachian Regional Commission, 2013), accessed at www.arc.gov/assets/research_reports/HouseholdWealthandFinancialSecurityinAppalachia.pdf, on March 5, 2014
 ">
">
Appalachia’s residents remain older, less educated, and less racially diverse than the United States as a whole, but those demographic and socioeconomic patterns vary widely within the region, according to The Appalachian Region: A Data Overview From the 2007-2011 American Community Survey, prepared by the Population Reference Bureau for the Appalachian Regional Commission.
The Appalachian region encompasses 205,000 square miles along the spine of the Appalachian Mountains from southern New York to northern Mississippi, including portions of 12 states and all of West Virginia. This report—co-authored by Kelvin Pollard, PRB senior demographer, and Linda A. Jacobsen, PRB vice president of Domestic Programs—finds that this region’s population has continued to grow: The latest population estimates indicate the region had 25.3 million residents in 2011 (out of 312 million Americans nationwide), compared to 25.2 million in the 2010 Census.
During the 2007-2011 period (a period of both economic growth and decline), nearly 74 percent of Appalachia’s civilians in the prime working ages (ages 25 to 64) were in the civilian labor force, slightly below the U.S. average of 78 percent. In 36 Appalachian counties (scattered throughout the region), the share was at or above the national average; two-thirds of those counties were in metropolitan areas.
The report also identifies 51 counties where less than 60 percent of 25-to-64-year-olds were in the civilian labor force. Nearly all of these counties were outside of metropolitan areas, and 40 were in central Appalachia. Indeed, just 60 percent of working-age residents in central Appalachia and 65 percent of those in rural areas were in the labor force. The authors suggest a possible connection between educational attainment and labor force participation. For example, in most of the counties with labor force participation rates matching or exceeding that of the nation, the share of working-age adults with at least a high school diploma was also at or above the U.S. average.
The full report includes detailed tables and county-level maps.
 ">
">
In 218 of 420 Appalachian counties, the share of working-age adults (ages 25 to 64) with at least a bachelor’s degree failed to reach more than half the national average of 30 percent, according to The Appalachian Region: A Data Overview From the 2006-2010 American Community Survey, a 2012 Appalachian Regional Commission report prepared by the Population Reference Bureau.
“This is a striking indicator of the lower educational level of the Appalachian workforce,” said Kelvin Pollard, PRB senior demographer and co-author of the report. Just 13 percent of working-age adults in central Appalachia (which includes counties in eastern Kentucky, southwestern West Virginia, and western Virginia) had at least a bachelor’s degree, as did only 15 percent of residents of rural Appalachian counties that were not adjacent to metro areas.
The report finds that overall only 23 percent of the working-age population in the Appalachian region had a bachelor’s degree or more—7 percentage points lower than the U.S. average (see figure). (The Appalachian region encompasses 205,000 square miles along the spine of the Appalachian Mountains from southern New York to northern Mississippi, including portions of 12 states and all of West Virginia.)
Percent of Working-Age Adults (Ages 25 to 64) With a Bachelor’s Degree or More, by Appalachian County Type, 2006-2010
Source: Appalachian Regional Commission, The Appalachian Region: A Data Overview From the 2006-2010 American Community Survey (Washington, DC: Appalachian Regional Commission, 2012.
Although unemployment in the region among working-age adults was only slightly higher than the national average of 6.4 percent during the period, it was at least 10 percent in 36 counties. All but two of these counties were outside metropolitan areas, and nearly half were in central Appalachia. “We see indications of a connection between unemployment and educational attainment,” noted Pollard. “In 25 of the 36 Appalachian counties with double-digit unemployment, more than one in five working-age adults lacked a high school diploma.”
Additionally, the report found that in most of the counties with labor force participation rates matching or exceeding the U.S. average, the share of working-age adults with at least a high school diploma was also at or above the national average. Pollard noted that unemployment during the 2006 to 2010 period reflects not just patterns during the 2007 to 2009 economic downturn and post-recession recovery, but also patterns during the years of prerecession economic growth.
There is some good news. The data suggest positive trends in educational attainment, with slight increases in the shares of the population ages 25 and older with a high school diploma and a bachelor’s degree in the 2006 to 2010 period. “The trend toward high school and college completion among young adults is likely continuing,” noted Linda Jacobsen, report co-author and vice-president of Domestic Programs at PRB.
The report examined a variety of social and economic indicators. Other key findings include:
- The percentage of working-age adults in the region with at least a high school diploma was only slightly below the national average of just over 87 percent. In 127 of Appalachia’s 420 counties, the share matched or exceeded the national average. Nearly half of these 127 counties were outside metropolitan areas, and most were in northern or north-central Appalachia. At the other end of the spectrum, fewer than three in four working-age adults had finished high school in 53 Appalachian counties—almost all of which were outside metropolitan areas, and more than half of which were in central Appalachia.
- Median household income in Appalachia during the 2006 to 2010 period was $42,498—82 percent of the U.S. median of $51,914. Just 19 Appalachian counties (almost all of them in metropolitan areas) had household incomes at or above the national median. In contrast, median household income was less than $30,000 in 56 Appalachian counties. Most of these counties were either in the most remote rural areas or in central Appalachia.
- About one in six Appalachian residents lived below the poverty level during 2006 to 2010 (income below $22,113 for a family of two adults and two children in 2010)—nearly 2 percentage points above the U.S. average. The report identified regional and urban/rural patterns: Nearly all of the counties with poverty rates exceeding 20 percent were outside of metropolitan areas, with about half in central Appalachia. In contrast, most of the counties with poverty levels below the U.S. rate were in metropolitan areas, and nearly half were in northern Appalachia.
The full report includes detailed tables and county-level maps.
 ">
">
This report, prepared by PRB for the Appalachian Regional Commission, has a wealth of charts and maps that describe the population of Appalachia. Of the 308.7 million Americans in 2010, 25.2 million lived in the Appalachian region. Yet the population size of Appalachia’s 420 counties varied greatly. While two-thirds of the counties had populations of less than 50,000 people, there are pockets clustered in large and mid-sized metropolitan areas, including Pittsburgh, Birmingham, and the Atlanta suburbs. Allegheny County, Pa. (where Pittsburgh is located) had 1.2 million residents in 2010.
 ">
">
This report examines the convergence between Appalachia’s economic fortunes and those in the rest of the United States since 1960, particularly among men and women of prime working age. It also examines the effect of social and demographic factors have had on this convergence. This report was published by the Population Reference Bureau and the Appalachian Regional Commission.
 ">
">
This report addresses improvements in living standards in Appalachia, whether these living standards are approaching the typical standards for families in the rest of the United States. Poverty rates in Appalachia are still high, particularly in more isolated rural areas, but conditions have improved dramatically relative to national averages. This report was published by the Population Reference Bureau and the Appalachian Regional Commission.