Charlotte Greenbaum
Former Senior Policy Advisor
Advocates, service providers, and governments are increasingly focused on improving access to and use of contraception among young people. To tailor program efforts, it is critical to understand how young women’s access to and use of family planning varies by socioeconomic status and other measures.
PRB’s new Population Bulletin looks at whether demand satisfied for family planning, as a key indicator of universal access to sexual and reproductive health, is equitable among young women ages 15 to 24 in low- and middle-income countries, and to what extent that inequity has changed over time. We consider these questions at the global, regional, and national levels using survey data from 33 countries. Our analysis demonstrates that:

The level of well-being of young American women (ages 16 to 34) rose significantly for members of the Baby Boom generation but hit a wall for women in subsequent generations, the Population Reference Bureau (PRB) concludes in a new report.
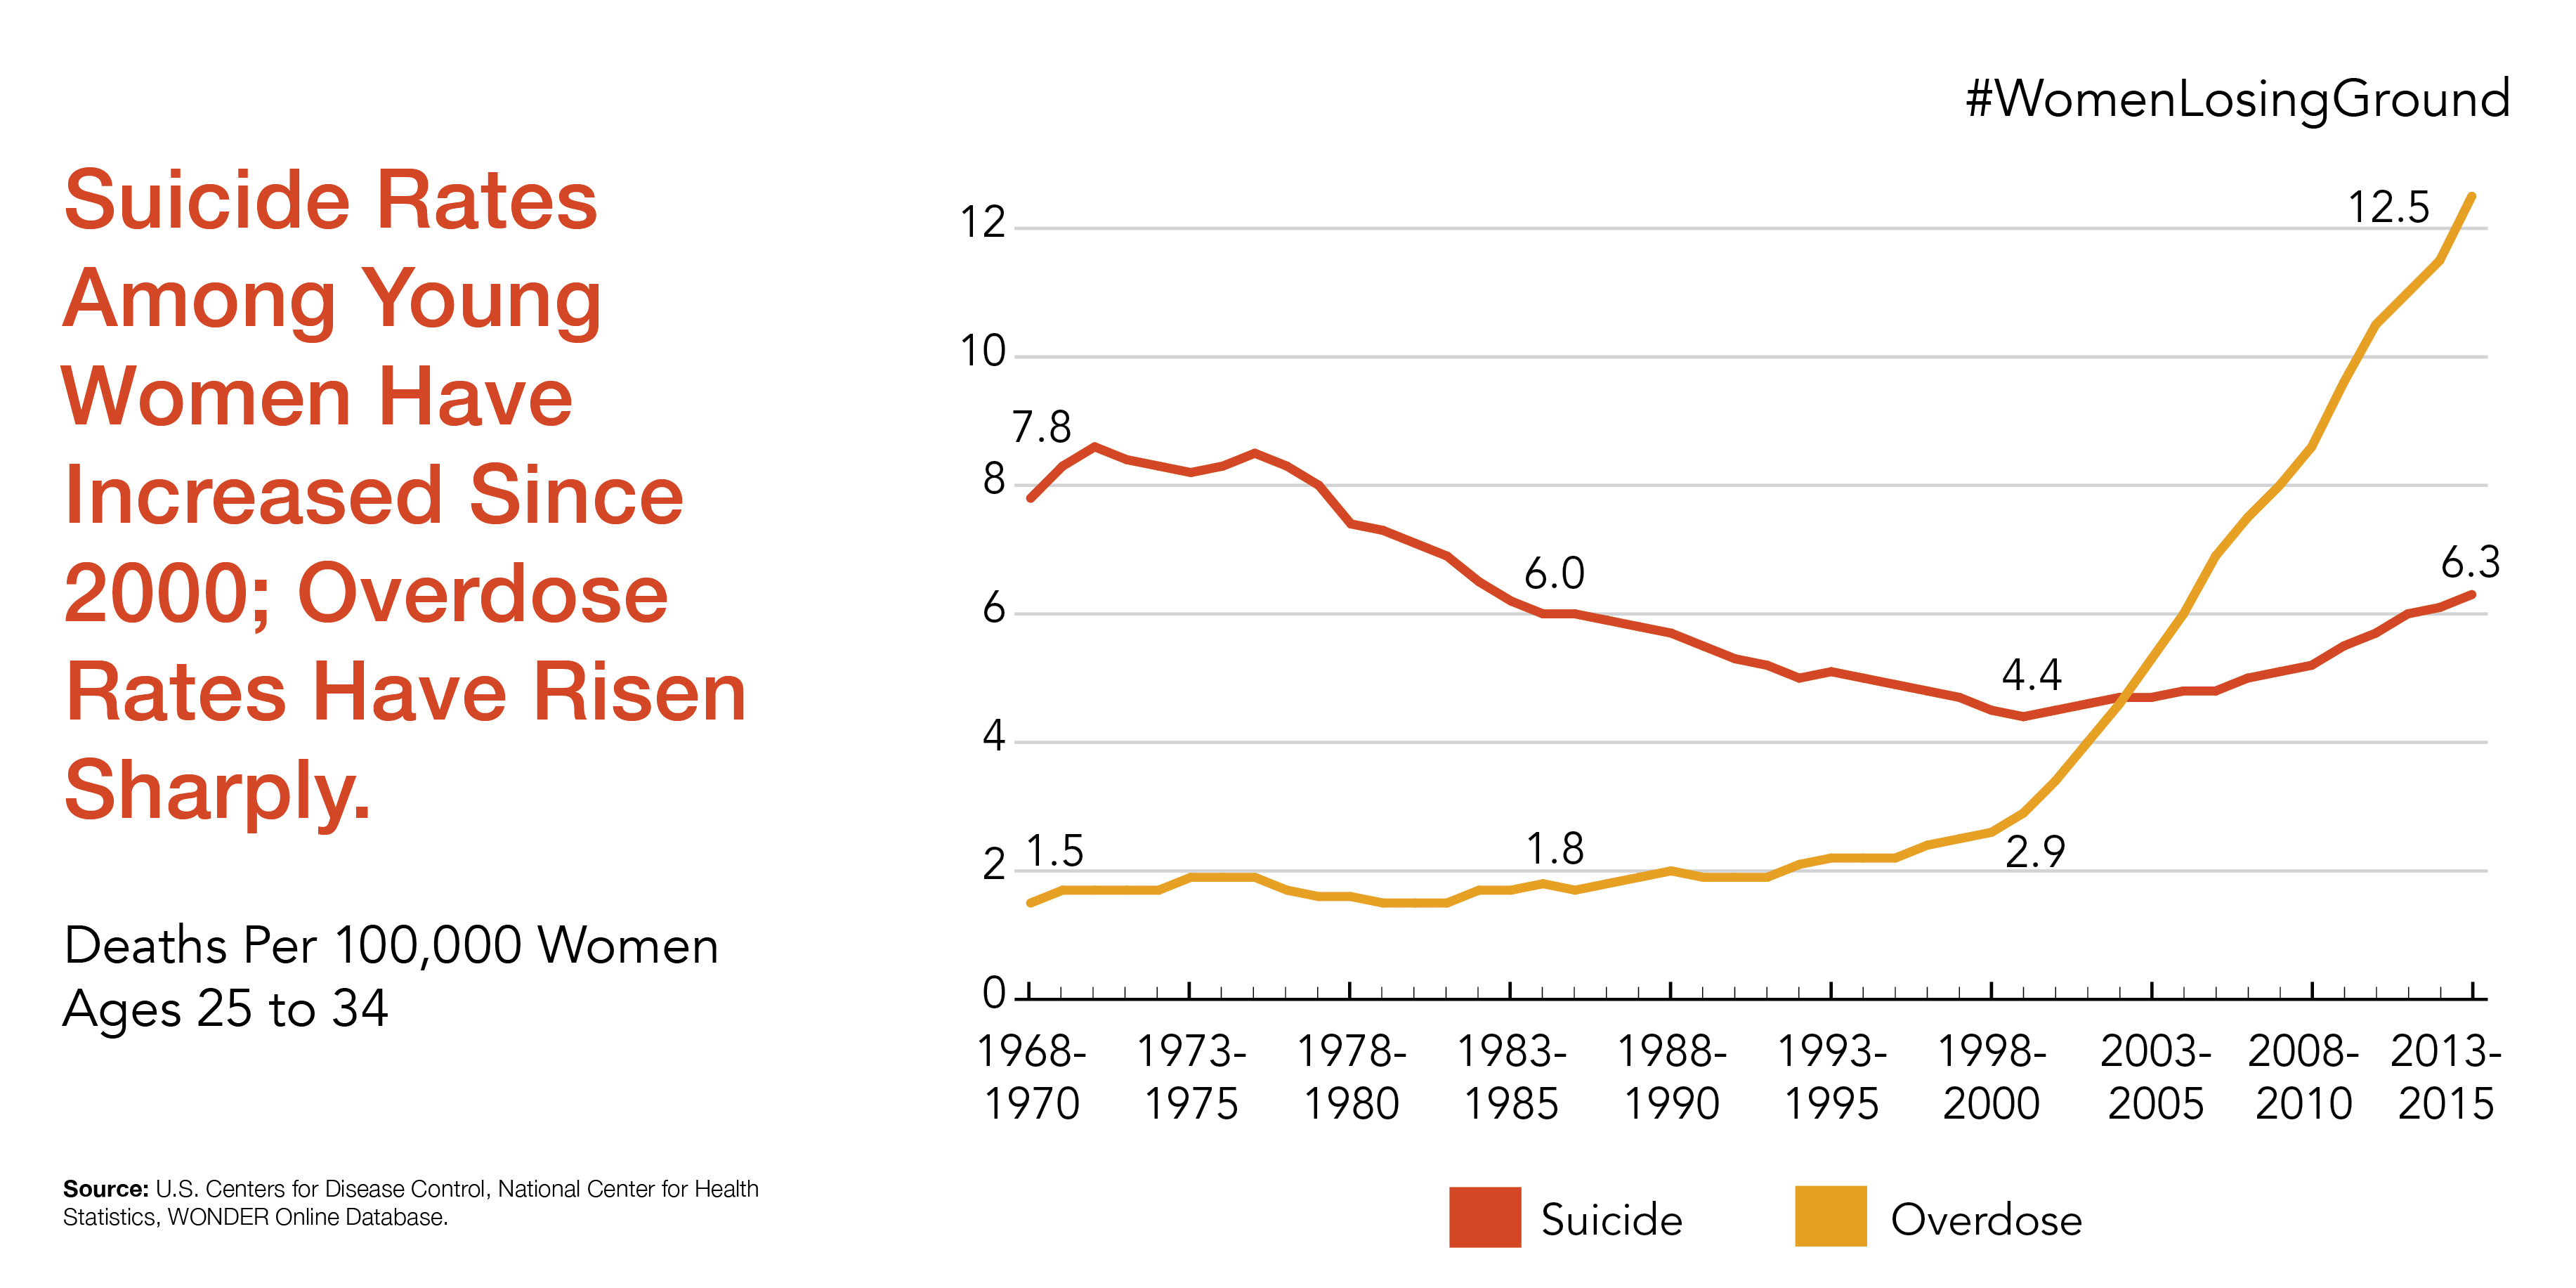
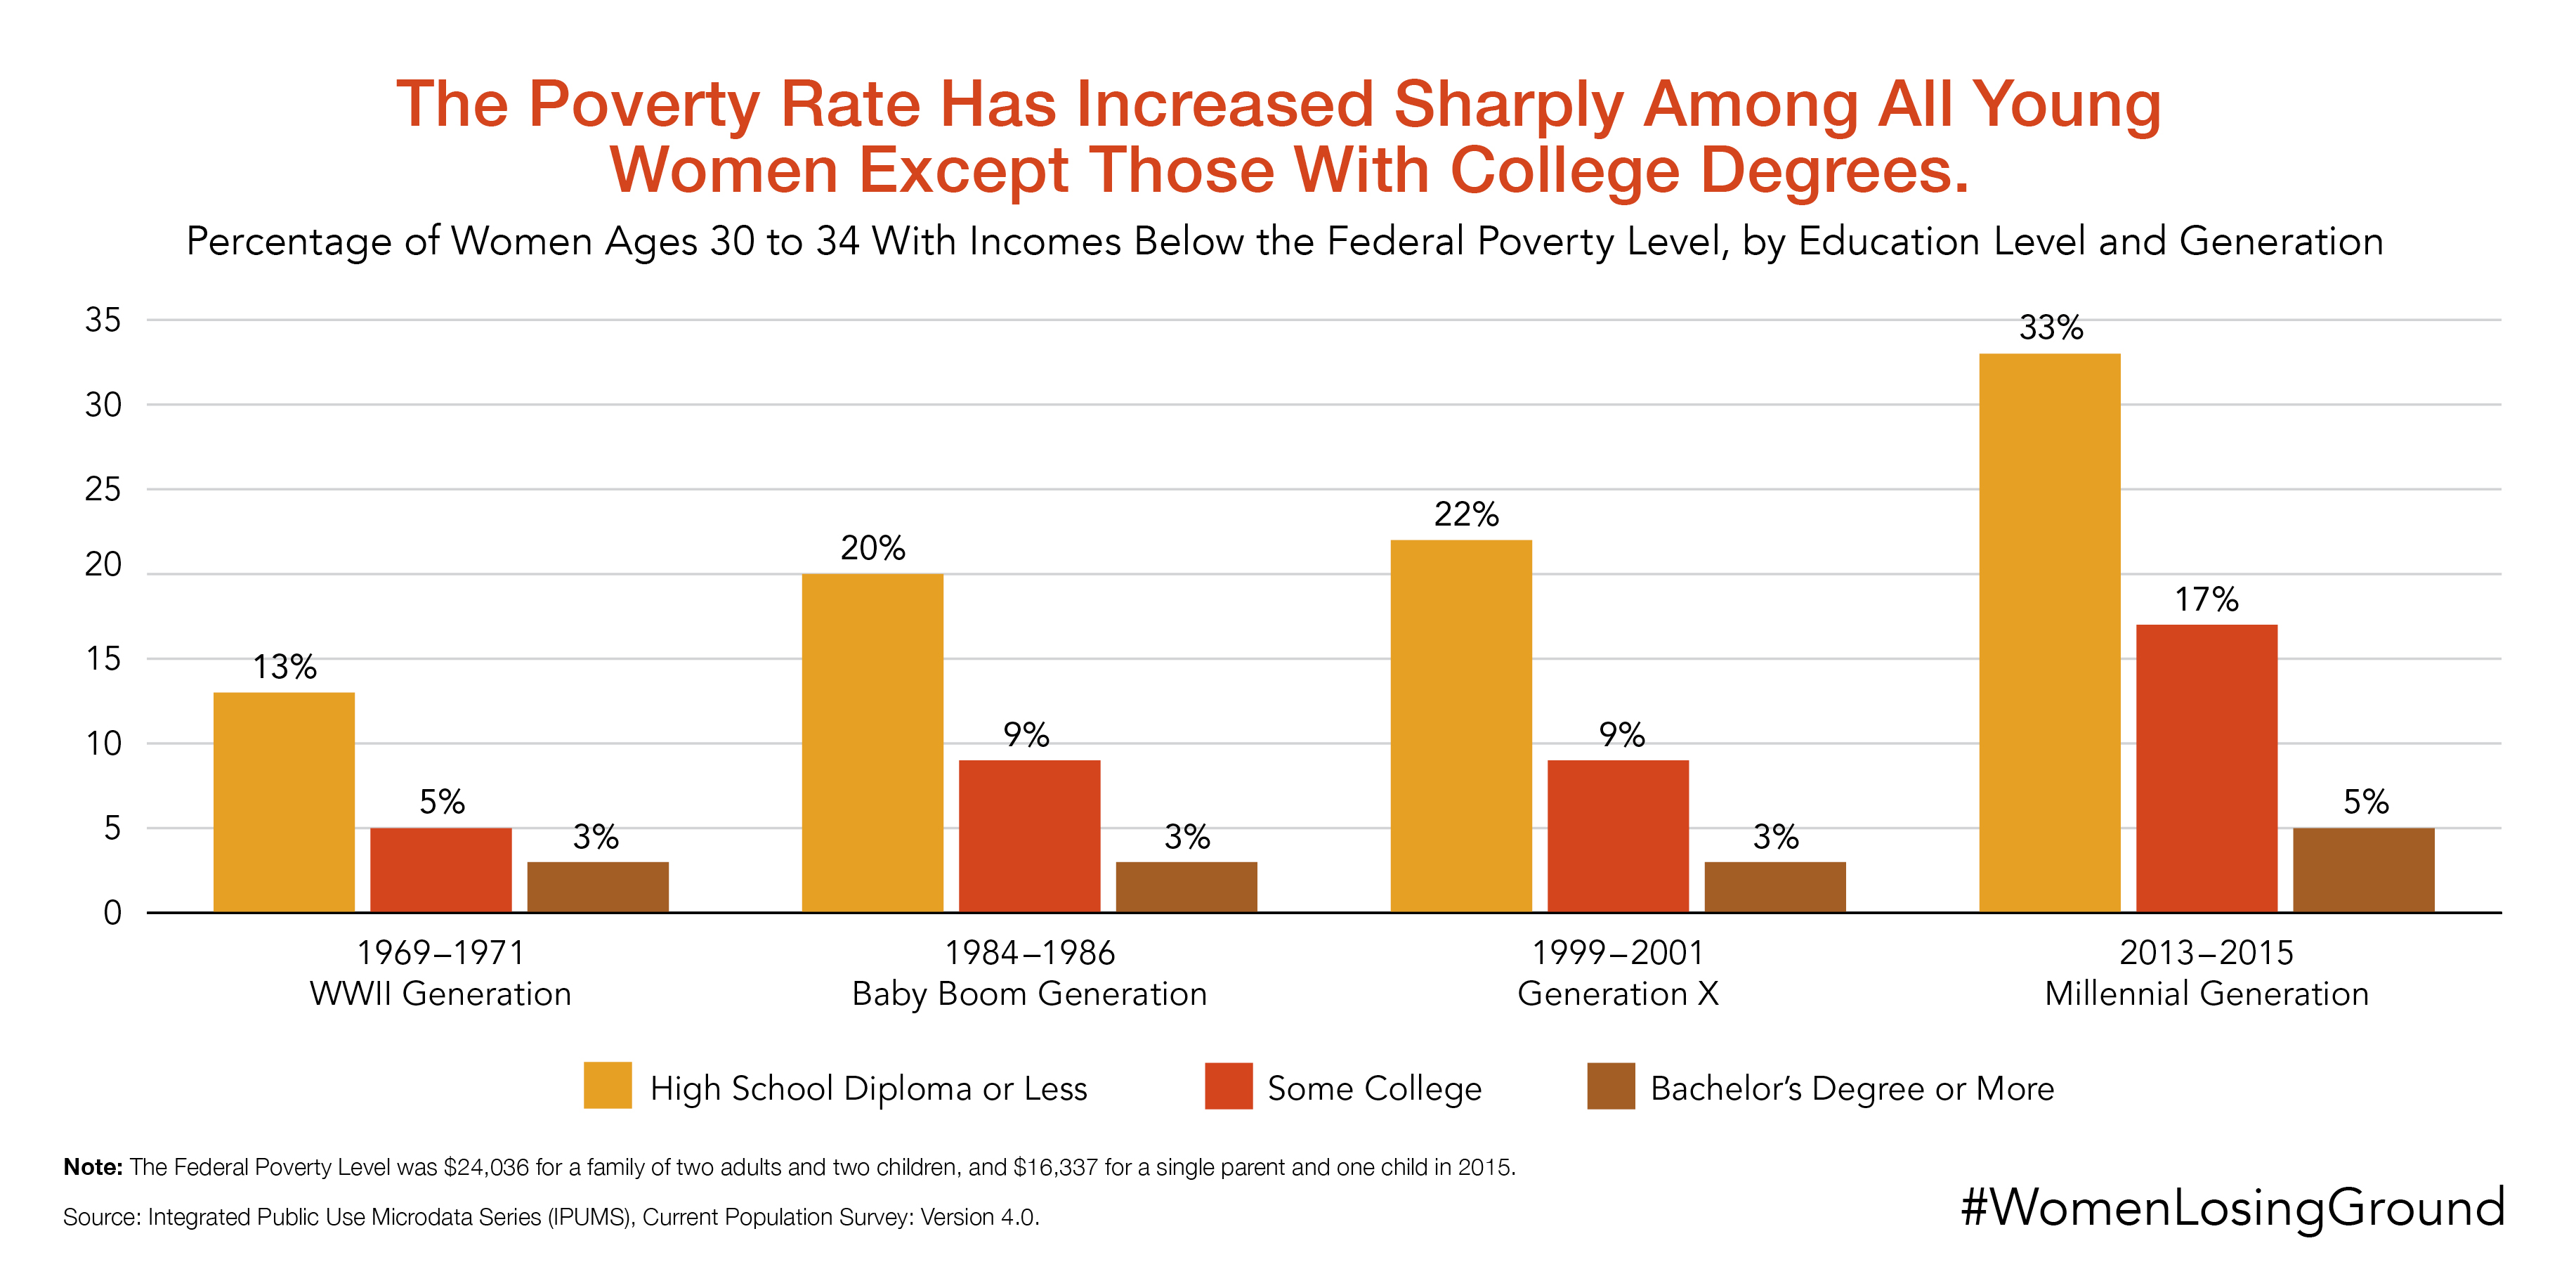
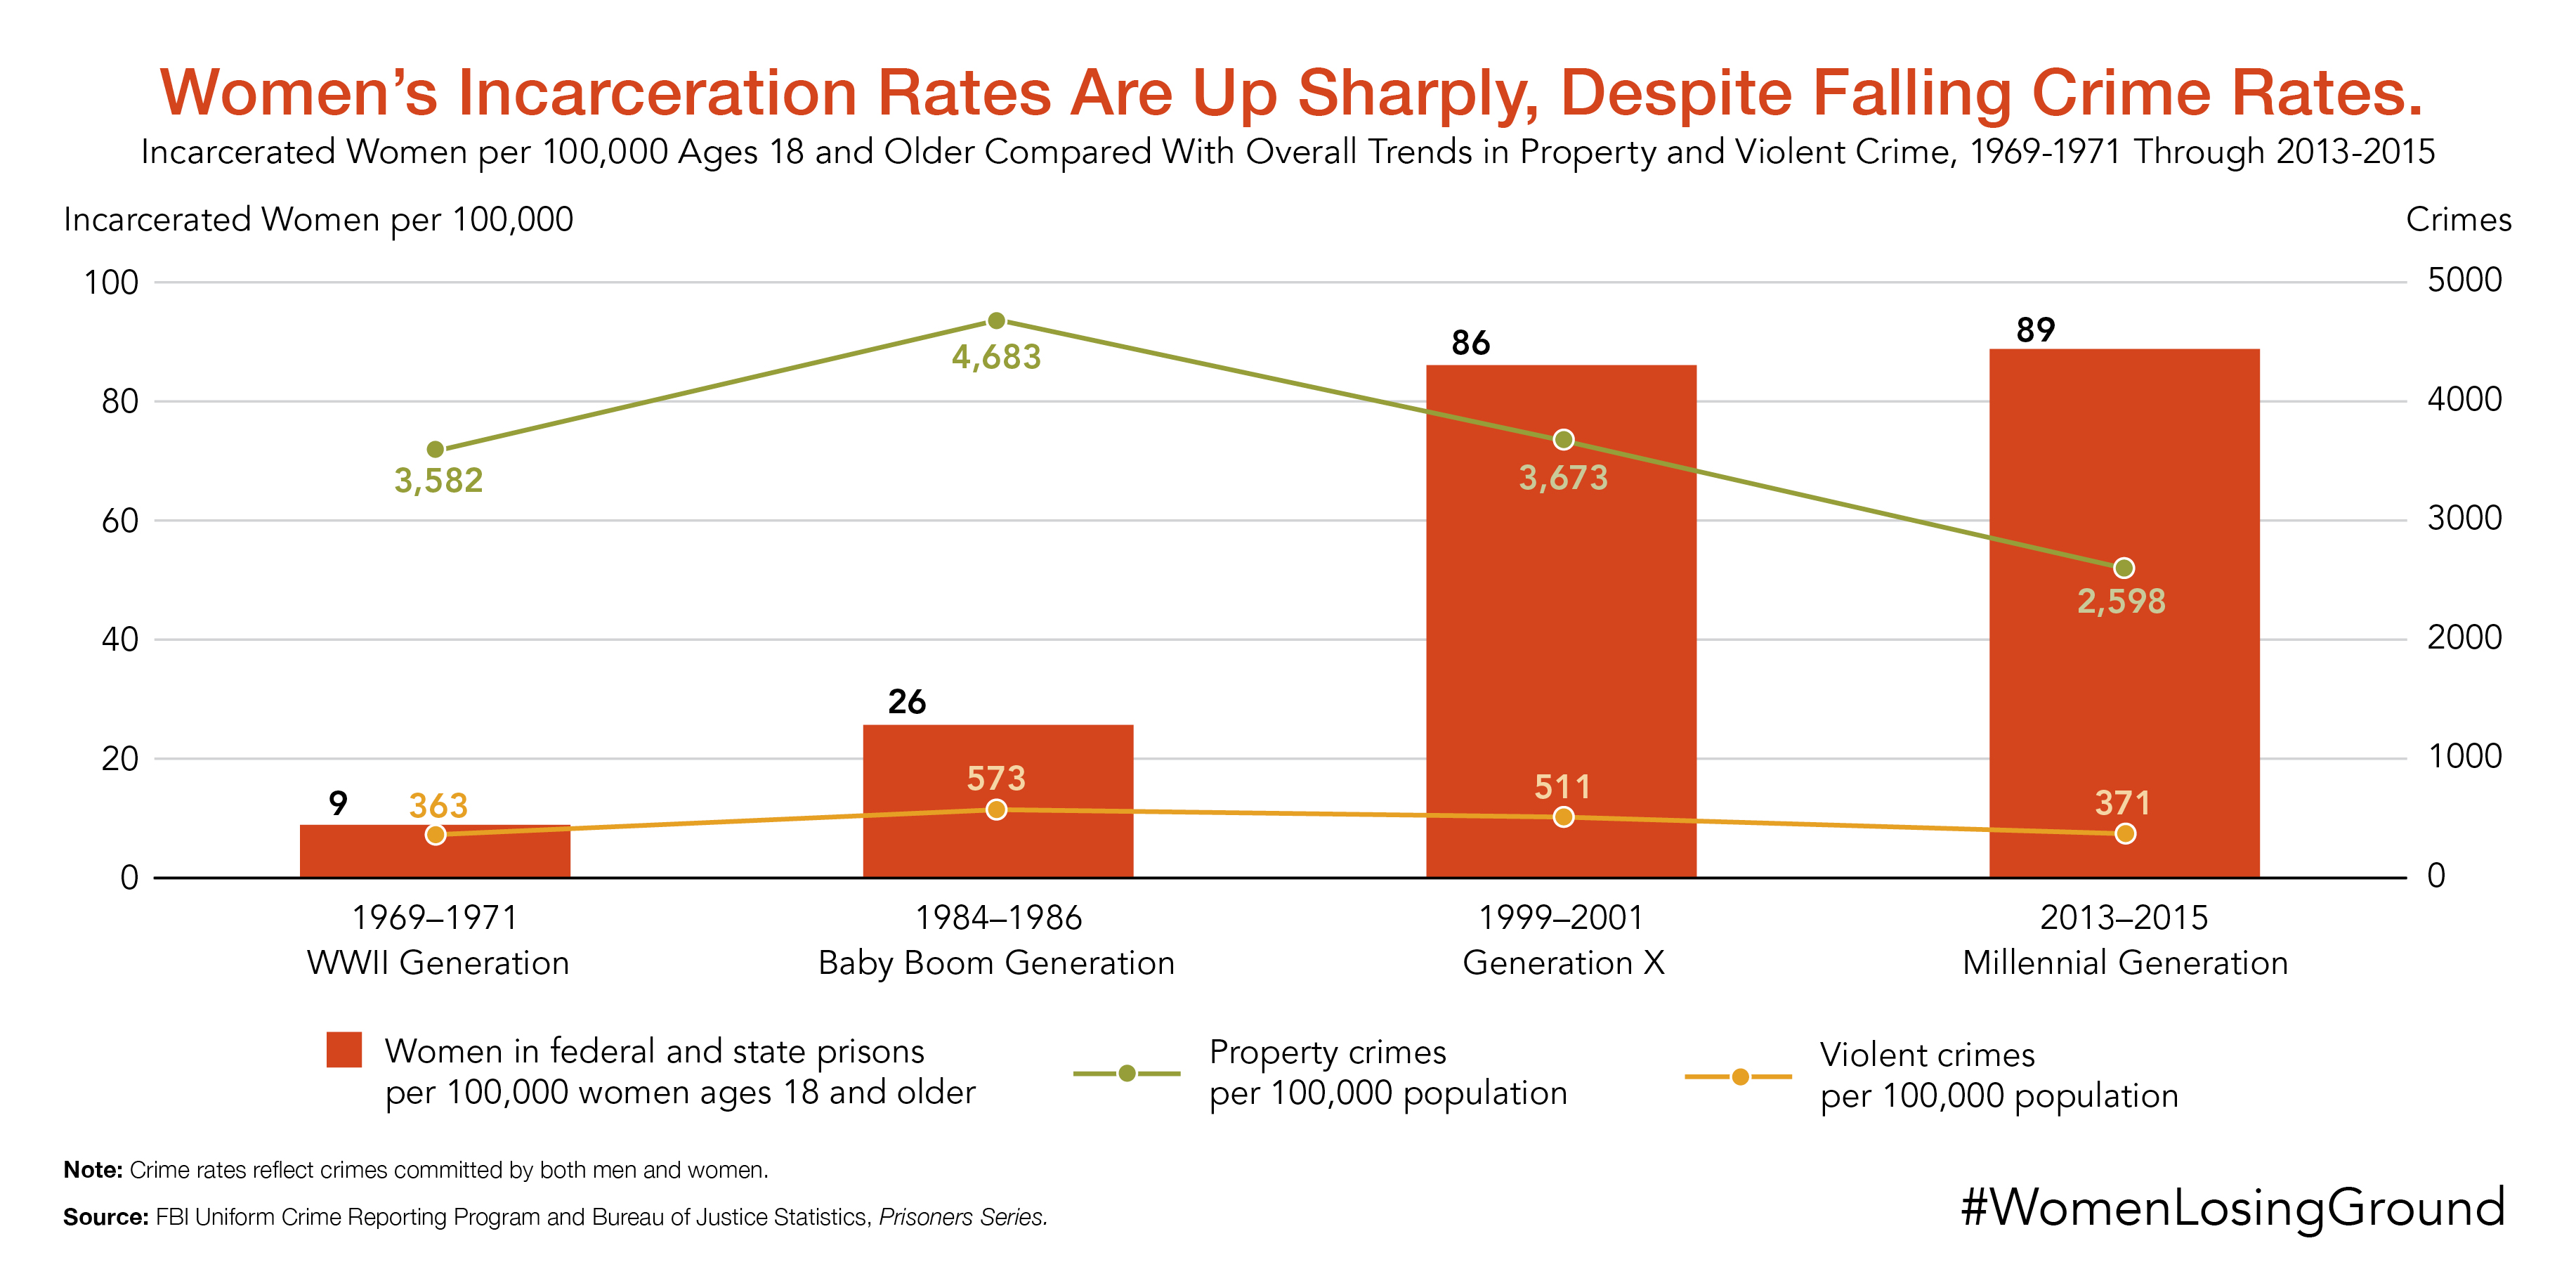
In its latest Population Bulletin, “Losing Ground: Young Women’s Well-Being Across Generations in the United States,” PRB analysts present a comprehensive new Index of Young Women’s Well-Being to show how social and structural barriers to progress for young women in Generation X and the Millennial generation have contributed to women’s persistently high poverty rates, a declining share of women in high-wage/high-tech jobs, a dramatic rise in women’s incarceration rates, and increases in maternal mortality and women’s suicide.
“By looking at a collection of 14 indicators of well-being, PRB’s index provides a unique perspective on women’s path of progress during the past half-century,” said Beth Jarosz, a senior research associate at PRB and co-author of the Bulletin.
“While some measures are improving, overall the index paints a picture of lost momentum. Too many women lack the resources and supportive environments they need to live healthier lives and achieve their full potential,” Jarosz said.
Momentum has stalled or reversed on several key measures of well-being:
The PRB analysts also identified several positive trends for young women, even though these did not outweigh the negative trends in the overall index:
“The share of women with bachelor’s degrees is at an all-time high, but these educational gains have not led to similar gains in the workforce or in political leadership,” said Mark Mather, associate vice president of PRB’s U.S. Programs department and a co-author of the Bulletin.
Women still earn less than men in nearly every occupation and at every education level. In fact, women need to complete a higher level of education than men to achieve equivalent earnings.
The PRB index comprises 14 key social, economic, and health measures to compare outcomes for each generation of young women (up to age 34) with the previous generation. The results show that the progress made by those in the Baby Boom generation (born 1946 to 1964) compared with the previous World War II generation (born 1930-1945) has not continued among women of Generation X (born 1965 to 1981) and the Millennial generation (born 1982 to 2002).
PRB calculates an overall index score by comparing each generation with the preceding generation and taking into account the magnitude of improvement or decline. Young women of the Millennial generation experienced a slight decline (1 percent) in overall well-being compared with women of Generation X, and women of Generation X experienced only a modest gain (2 percent) in well-being relative to women of the Baby Boom generation. In contrast, women of the Baby Boom generation experienced a substantial gain (66 percent) in overall well-being relative to women of the World War II generation.

Beginning in the 1960s—and accelerating over the last two decades—changes in marriage, divorce, cohabitation, and nonmarital childbearing have transformed family life in the United States. The family continues to serve a primary role in raising children and caring for elderly relatives. But new family patterns and increased instability are creating complex family and economic ties that often span multiple households, according to a new Population Reference Bureau (PRB) report, “Understanding the Dynamics of Family Change in the United States.”
Unstable living arrangements and complex family relationships create challenges for families and policymakers alike as more children are at risk of growing up poor and more adults reach old age without a spouse or ties to an adult child to provide care, reports Alicia VanOrman, PRB research associate and lead author.
Compared to the 1950s, men and women today have more socially acceptable choices about how, when, and with whom to form intimate relationships and in what context to have children. No longer do marriage, co-residence, and parenting always go together, nor is marriage necessarily viewed as a life-long commitment.
The prevalence of marriage has continued to decline in the United States. In 2014, about half of all U.S. adults were currently married, compared with nearly three-quarters in 1960. Multiple factors are driving this decline, including young adults delaying marriage to older ages, more couples cohabiting before or instead of marrying, more couples divorcing, and fewer adults remarrying following a divorce or the death of a spouse.
Cohabitation rather than marriage is now the setting of a majority of first live-in romantic relationships. Yet, cohabiting unions tend to be short and unstable. Only about two in five cohabiting couples now marry within three years, down from three in five in the early 1990s. Previously married people are not remarrying as quickly or as often as in the past; rather they are cohabiting. In nearly half (47 percent) of cohabiting couples in 2014, at least one member had been previously married.
The share of children born to unmarried parents has doubled since the 1980s, reaching 43 percent in 2009-2013 from 21 percent in 1980-1984. Births to cohabiting couples (whose relationships tend to be less stable than those of married couples) now represent 25 percent of all U.S. births and account for nearly all of the recent increase in nonmarital births.
While divorce has declined slightly among people in their 20s and 30s, it has increased dramatically among those ages 50 and older. In 2010, close to half of Americans ages 50 and older who had ever married had also divorced or separated. Family demographers point to a variety of reasons such as higher expectations for marital relationships, the instability of remarriages, and higher women’s earnings that make divorce more economically feasible.
However, the number of same-sex married couples has more than doubled from an estimated 230,000 in 2013 to 486,000 by late 2015; the U.S. Supreme Court legalized same-sex marriage in all states in June 2015.
A growing share of children experience unstable living arrangements—moving from families with two biological parents to families with a single parent, with a cohabiting parent, or with a stepparent—as more parents split up and form relationships with new partners.
In 2009, two in five children did not live with both biological parents in a nuclear or traditional family household. Instability has made family ties more complex, making it harder for parents to invest time and money in their children—especially those who live in different households. And surveys show that as adults, children feel less obligation to care for elderly stepparents or fathers with whom they did not reside during childhood.
Contemporary couples tell interviewers that they view financial security as a prerequisite for marriage. But the decline in family-supporting jobs, particularly for those without a college education, along with the rise in home prices and mounting student debt, all pose barriers to marriage.
However, marriage is associated with many benefits for children and adults, including higher income, better health, and longer life expectancy. Indeed, research shows that children raised outside of stable, two-biological-parent families are more likely to be poor and to receive lower-quality parenting—which can hinder their healthy development and future life chances.
The retreat from marriage and increased instability have been more heavily concentrated among disadvantaged groups—including racial/ethnic minorities and those with lower levels of education. About half of children with noncollege-educated parents are in complex families (a single-parent family, a cohabiting or married stepparent family, or a family with half-siblings or stepsiblings) compared with one in five children with a college-educated parent.
Unless policymakers, researchers, and others address the causes and consequences of family change, progress in reducing social and economic inequalities among children may be undermined and existing disparities across racial/ethnic groups may widen, the authors argue.
The current growth of the population ages 65 and older is one of the most significant demographic trends in the history of the United States. Baby boomers—those born between 1946 and 1964—have brought both challenges and opportunities to the economy, infrastructure, and institutions as they have passed through each major stage of life. Although U.S. policymakers and others have had many decades to plan for the inevitable aging of the baby boom cohort, it is not clear that sufficient preparations have been made to meet baby boomers’ anticipated needs in old age.
The aging of the baby boom generation could fuel a 75 percent increase in the number of Americans ages 65 and older requiring nursing home care, to about 2.3 million in 2030 from 1.3 million in 2010, the Population Reference Bureau (PRB) projects in a new report.
The report, “Aging in the United States,” examines recent trends and disparities among adults ages 65 and older, and how baby boomers will reshape America’s older population. In 2016, baby boomers will be between ages 52 and 70.
The report notes that the number of Americans ages 65 and older is on course to more than double from 46 million today to over 98 million by 2060, while the 65-and-older age group’s share of the total population will rise to nearly 24 percent from 15 percent.
PRB observes that baby boomers are living longer than previous generations. They also have, on average, higher levels of education and more work experience, which bode well for their economic security in old age.
“The growth in the older population is fundamentally a success story from a public health perspective—new advances in medicine and living standards have led to longer life expectancies,” says Mark Mather, associate vice president for U.S. programs at PRB and principal author of the new report.
But potential problem areas are coming into focus:
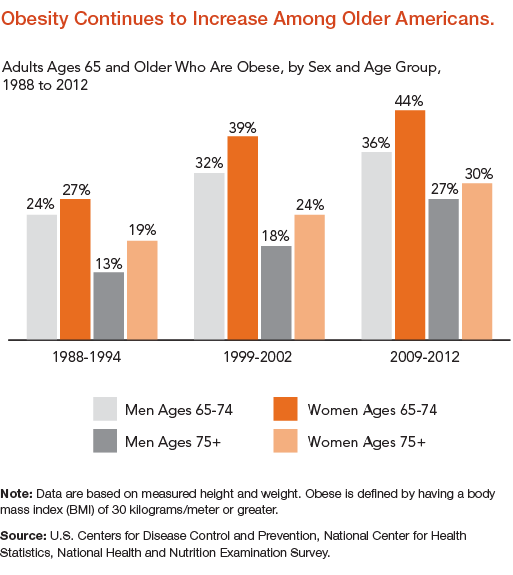
Obesity rates among older adults have been increasing, standing at about 40 percent of 65-to-74-year-olds in 2009-2012, and putting more people at risk of chronic disease and disability (see image below).
More older adults are divorced compared with previous generations. The share of divorced women ages 65 and older increased from 3 percent in 1980 to 13 percent in 2015, and for men from 4 percent to 11 percent during the same period. The rise in divorce, single-parent families, and “blended families” that include children from previous relationships may lead to weaker family ties and less caregiving support for aging spouses and parents.
There are also wide economic gaps between older adults in different racial/ethnic groups. While just 8 percent of non-Hispanic whites ages 65 and older lived in poverty in 2014, the comparable figure for Latinos was 18 percent, and for African Americans, it was 19 percent.
In addition to the rising need for nursing home slots, demand for elder care will also be fueled by a steep rise in the number of Americans living with Alzheimer’s disease, which could nearly triple by 2050 to 14 million, from 5 million in 2013.
The large share of elderly also means that Social Security and Medicare expenditures will increase from a combined 8 percent of gross domestic product today to 12 percent by 2050. “These challenges could be managed through structural changes to existing entitlement programs, an increase in retirement savings among workers, and by providing incentives to shift retirement to later ages,” Mather says.
The authors point out that lower-income households headed by older adults rely on Social Security for the majority of their income, while higher-income elderly households rely on a mix of Social Security, earnings, and asset income.

The U.S. population is undergoing significant racial/ethnic change, with rapidly growing Latino, Asian American, and multiracial populations.
Immigration has played a key role in these racial/ethnic changes, putting the United States on a path to become “majority minority” by 2043. But the population under age 18 is projected to reach this milestone much sooner—by 2018 or 2019, depending on future levels of immigration. Some of the fastest-growing groups—especially Latinos—are also the most vulnerable, lagging behind other groups on many measures of social and economic well-being.
The good news is that, over the long term, the economic divide between different racial/ethnic groups has narrowed. In 2013, there was a 13 percentage-point gap between the poverty rate of non-Hispanic whites (10 percent) and racial and ethnic minorities (23 percent). This represents a 7-percentage point decrease in the poverty gap since 1987, when the poverty rate for minorities was much higher, at 29 percent. While the poverty rate for whites increased slightly during this 25-year period, from 9 percent to 10 percent, the poverty rates for blacks, Latinos, and Asians declined (see Figure 6).
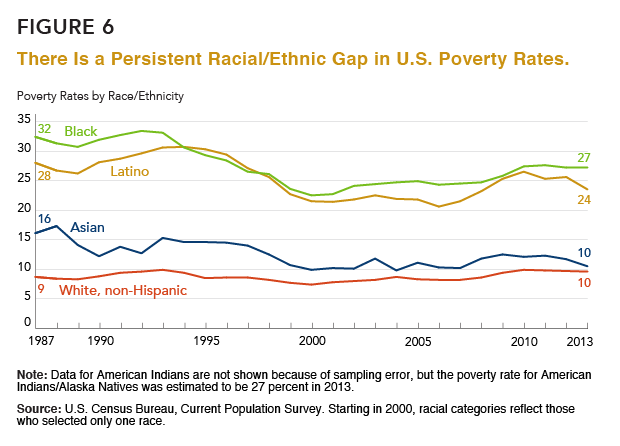
The bad news is that, in the short term, the recession contributed to a growing poverty gap between Asians and whites versus blacks and Latinos, who were disproportionately affected by job losses during the economic downturn. But the gap also reflects longer-term demographic changes in the U.S. population. Baby boomers, who are mostly white, are reaching retirement age and can receive Social Security income, while young children and their families are more likely to be racial/ethnic minorities and are at a higher risk of being poor. The racial/ethnic divide between generations may contribute to a growing economic gap across different racial/ethnic groups—with an aging white population eligible for benefits that help keep them above the official poverty line, and a younger and racially diverse population entering the workforce during a period of economic instability. If current disparities persist, the number of people living in poverty is projected to increase with the rising share of lower-income racial/ethnic minorities (see Box 3).
White households are also wealthier, on average, compared with black and Latino households. Data from the Survey of Income and Program Participation show that median net worth of whites was over $110,000 in 2011, compared with just $6,300 for black households and $7,700 for Latino households (see Figure 7).
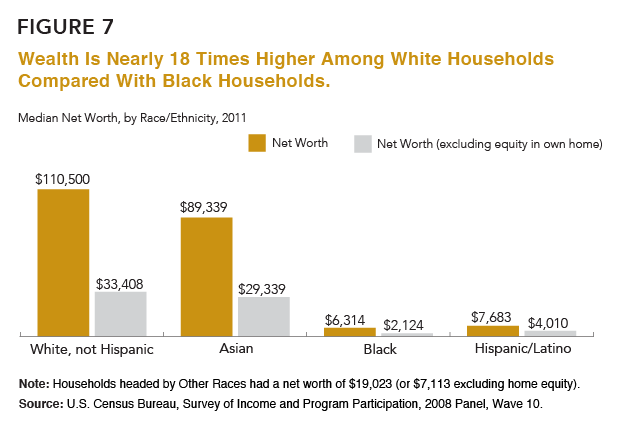
The wealth gap can be explained largely by differences in homeownership and home values between groups, as well as higher levels of private transfers of wealth (for example, through large gifts or inheritances) among whites compared with blacks and Latinos.24 With higher incomes, white families are able to purchase homes eight years earlier, on average, compared with black families, generating more equity and potential for growth in assets.25 Finally, although buying a home remains an important first step toward economic security, homeownership became a liability for many lower-income families during the recent recession. High interest rates, falling home prices, and the rise in foreclosures wiped out trillions of dollars of accumulated wealth.
Box 3
Projecting U.S. Poverty
Reducing poverty will be difficult unless the economic circumstances of blacks, Latinos, and American Indians improve. Between 1980 and 2013, the proportion of racial/ethnic minorities in the U.S. population increased from roughly 20 percent to 37 percent. By 2030, minorities are expected to make up 45 percent of the population. Based on this projection and assuming current poverty levels persist in the future, the number of people in poverty could increase to 68 million by 2050, up from 45 million in 2013 (see figure). However, if the poverty gaps were eliminated, so that poverty rates for all racial/ethnic groups were no higher than those for non-Hispanic whites in 2013, the number of people in poverty in 2050 would drop below the level in 2013, to 44 million.
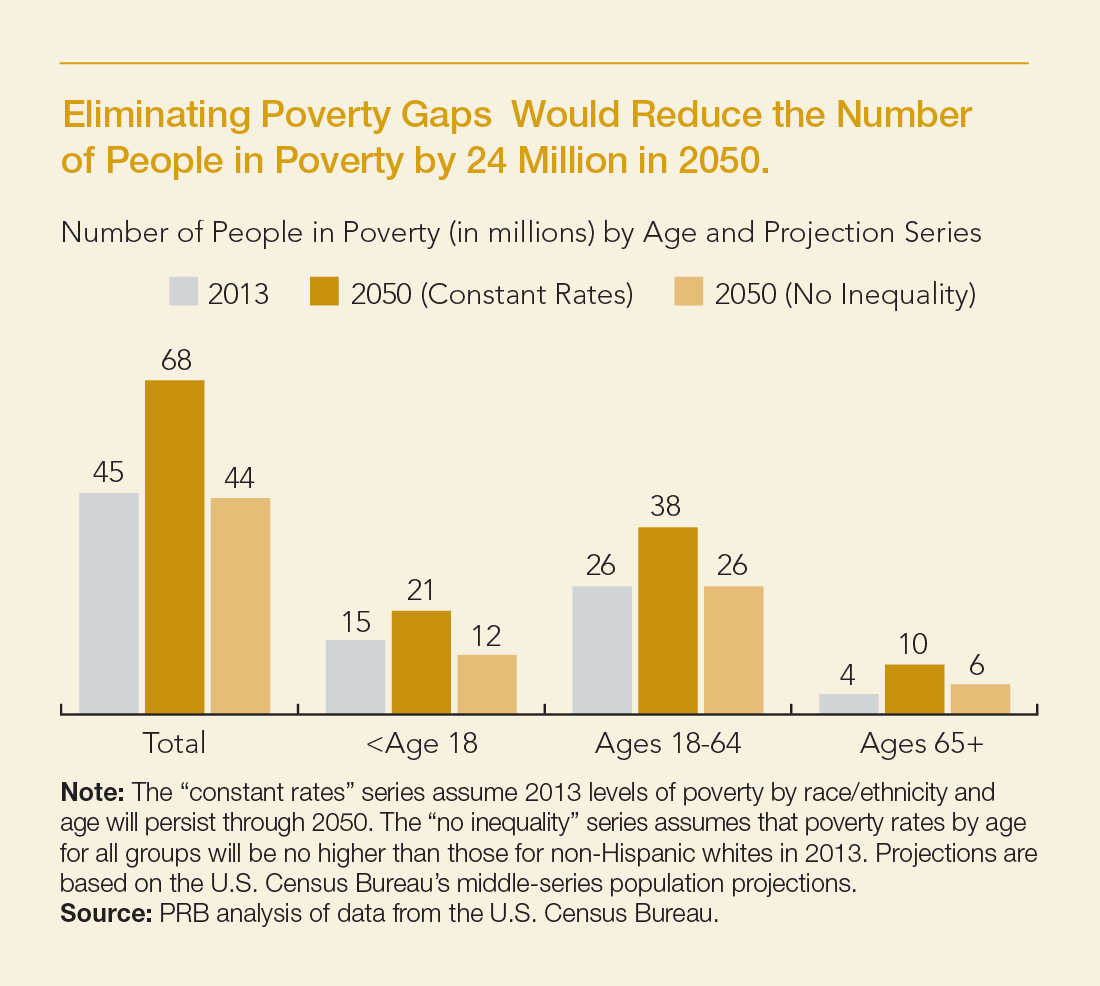
Closing poverty gaps across different racial/ethnic groups would benefit children more than working-age adults or the elderly, because of the changing racial/ethnic composition of the population under age 18. Eliminating racial/ethnic poverty gaps would reduce the number of children in poverty by 45 percent in 2050, compared with the projected number of poor children if current disparities persist until 2050. For the population ages 18 to 64, the number of poor people would be 30 percent lower in 2050 if poverty gaps were eliminated, while the number of poor people ages 65 and older would be 35 percent lower, compared with the projected number if current racial/ethnic gaps persist until 2050.
These numbers are important because of the high individual and social costs of poverty in the United States, especially among children. It is estimated that each year, nearly 4 percent of the U.S. gross domestic product ($500 billion) is spent on crime and health issues associated with childhood poverty in the United States.1
Reference
1. Harry J. Holzer et al., “The Economic Costs of Poverty in the United States: Subsequent Effects of Children Growing Up Poor,” accessed at www.irp.wisc.edu/publications/dps/pdfs/dp132707.pdf, on Aug. 5, 2014.
POPULATION BULLETIN CHAPTERS
Introduction
The Backdrop: Rising Inequality
Where Poverty and Inequality Intersect
The Generational Divide
Persistent Racial/Ethnic Gaps
Women Making Progress, But Gaps Remain
Education: The Great Equalizer?
Looking Ahead
24. Signe McKernan et al., “Do Racial Disparities in Private Transfers Help Explain the Racial Wealth Gap? New Evidence From Longitudinal Data,” Demography 51, no 3 (2014): 949-74.
25. Thomas Shapiro, Tatjana Meschede, and Sam Osoro, The Roots of the Widening Racial Wealth Gap: Explaining the Black-White Economic Divide (Waltham, MA: Institute on Assets and Social Policy, Brandeis University, 2013).

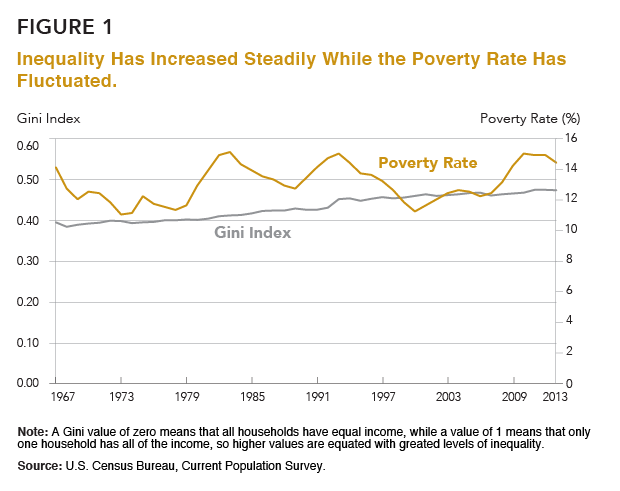
The poverty rate is one of the most widely reported measures of economic well-being in the United States, but rising income inequality has been a defining characteristic of the U.S. economy during the past 50 years.
Poverty rates have fluctuated over time, increasing during periods of job loss and decreasing when the economy recovers (see Figure 1). But In 2013, the national Gini Index—the most widely used measure of inequality—stood at .476, up from .463 in 2007 and .397 in 1967. A Gini value of zero means that all households have equal income, while a value of 1 means that only one household has all of the income, so higher values are equated with greater levels of inequality. In 2012, the Gini Index value matched the highest level ever recorded in the United States. Another measure of inequality, based on the share of income received by the top 20 percent of households, shows a similar increase. In 2013, the top 20 percent of households controlled over half (51 percent) of all household income.
The Occupy Movement drew attention to rising income inequality in the United States with their slogan, “We are the 99%.” During the recession, income among the top 1 percent of families fell with the stock market crash and declines in earnings from capital gains. However, this decline was only temporary. By 2012, the top 1 percent of families—those with annual incomes over $394,000—controlled 22 percent of U.S. income, up from 18 percent in 2009.6
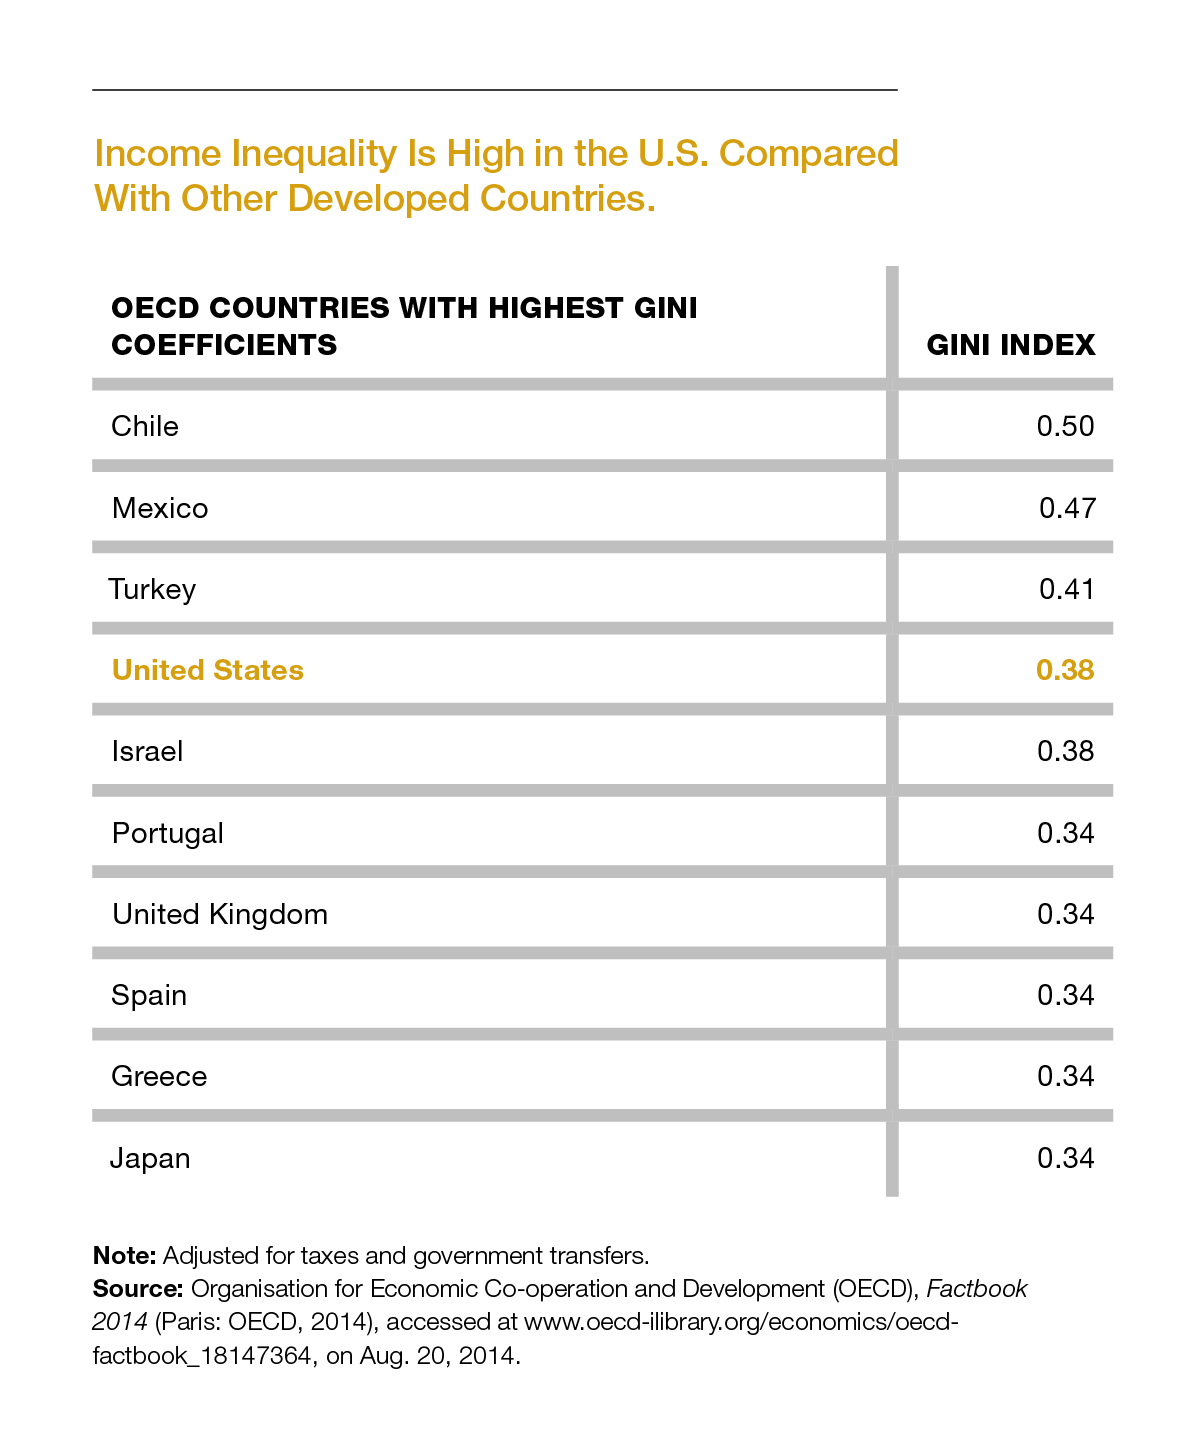
The increase in income inequality is not unique to the United States. Many other countries have seen growing income gaps—especially Estonia, France, Greece, Ireland, Japan, Slovenia, and Spain.7 But today the United States has one of the highest levels of income inequality among developed nations (see table). With an adjusted Gini Index of .38, the United States ranks just slightly below Turkey and is tied with Israel. Levels of income inequality are substantially lower in Canada (.32), France (.30), and Germany (.29).8
Gaps in household net worth, or wealth, are not reported as widely as differences in income, but in some respects, wealth is a better marker of family well-being. Among more-affluent households, wealth is mainly tied up in the stock market, but for most Americans, and especially those living in lower-income families, a home is the most valuable asset they will ever own. Homeownership provides a basic source of economic security and can shield families against material hardship by providing a cushion in the case of sudden loss of income. Owning a home also contributes to residential stability, civic engagement, psychological well-being, and children’s educational success.9
In the United States, the wealth gap is larger than the income gap, sharply dividing those at the top and bottom of the economic ladder. The Great Recession led to broad, across-the-board declines in wealth, but those at the top experienced smaller declines, in relative terms, compared with those at the bottom. As a result, the level of wealth inequality in the United States increased in the aftermath of the recession. Between 2007 and 2013, average wealth among the top 5 percent of households fell by 16 percent, compared with a 43 percent decline among middle-class households at the 50th percentile. By 2013, the top 5 percent of households had an average net worth 24 times that of households at the 50th percentile ($1.36 million compared with $56,000).10
How did this wealth gap come about? During the late 1990s, median household wealth sharply increased as the stock market boomed. Stock prices declined during the early 2000s, but wealth continued to grow with the increase in home values, benefitting the middle class as well as those in more-affluent households. But in 2007, home prices dropped sharply, wiping out trillions of dollars of assets. The middle class, which had more of their wealth tied up in their homes, was hit harder by the drop in housing prices compared with wealthier households. Foreclosures hit record levels, with 3 million homes receiving foreclosure notices in 2010.11 Between 2007 and 2013, home equity fell 61 percent among homeowners in the bottom half of the wealth distribution, compared with only a 20 percent decline among the top 5 percent of households.12 In the meantime, the stock market recovered most of its losses, fueling a rapid increase in assets among the wealthiest households.
POPULATION BULLETIN CHAPTERS
Introduction
The Backdrop: Rising Inequality
Where Poverty and Inequality Intersect
The Generational Divide
Persistent Racial/Ethnic Gaps
Women Making Progress, But Gaps Remain
Education: The Great Equalizer?
Looking Ahead

A convergence of demographic trends and disparities is contributing to a new economic reality for the U.S. population, characterized by higher levels of poverty and inequality.
Population aging, growing racial/ethnic diversity, changing family structure, and regional population shifts are changing the U.S. demographic landscape and exacerbating differences between the haves and the have-nots.
The United States is undergoing rapid demographic change. Baby boomers, who are mostly non-Hispanic white, have started to reach retirement age, exit the labor force, and collect Social Security benefits. But young adults, who are just starting to enter the workforce, look very different than their parents’ and grandparents’ generations. Historical trends in immigration and fertility have contributed to growing racial/ethnic diversity among young adults and their children. Families are changing, with fewer married couples and more single-parent families and cohabiting unions. And the U.S. population is shifting away from parts of the Northeast and Midwest to new areas of job growth in the South and West.
These demographic trends are occurring against a backdrop of rising inequality in the United States. Since the Great Recession, public discourse has focused primarily on the earnings of chief executives in comparison with low-wage workers. But broader measures of income inequality also show a growing gap between those at the top and those at the bottom. The Gini Index, which measures inequality across households, recently registered its first significant year-to-year increase since 1993; and since 1967, household income inequality has increased by 20 percent.1
From a demographic perspective, these gaps matter because as groups at the bottom of the income distribution make up a growing share of the population, income inequality and poverty levels are projected to increase—even if the gaps between groups remain unchanged. If current trends continue, the U.S. income distribution will become increasingly “bimodal,” characterized by a shrinking middle class and a growing number of people at the top and bottom.
Why should we care if income inequality increases? Before the most recent recession, there was little public discussion about the gap between the rich and poor. While some argue that inequality creates economic and political instability, others point to the positive role of inequality in fostering innovation and economic growth. But the level of inequality in the United States may be reaching a tipping point.
High levels of inequality have been linked to a greater likelihood of economic boom and bust cycles, deeper recessions, and a slowdown in overall economic growth.2 Evidence from the current economic slowdown suggests that the United States is approaching, and may already have reached, a tipping point where inequality is limiting social mobility, consumer spending, educational attainment, and the ability of the United States to compete in the global economy.3 Unemployment peaked at 10 percent in October 2009 and still exceeds prerecession levels. Many discouraged workers have left the labor force, and young adults—especially those without college degrees—have a hard time finding secure, full-time work. Today, about 45 percent of adults are dissatisfied with “Americans’ opportunities to get ahead by working hard,” compared with just 22 percent in 2001.4
Rising poverty levels have reduced opportunities for millions of children compared with previous generations. Today, children who are born to families in the bottom fifth of the income distribution have a 36 percent chance of remaining stuck in that same income quintile when they reach adulthood. For African American children born in the bottom income quintile, the figure is 51 percent.5
In this Population Bulletin, we investigate the intersection between demography and inequality in the United States, with a focus on regional patterns and differences by age, race/ethnicity, gender, and family structure. We stress the importance of closing gaps in education to put the next generation of workers and their children on a path to succeed in the labor force and advance the U.S. economy.
1. U.S. Census Bureau, “Table H-4. Gini Ratios for Households, by Race and Hispanic Origin of Householder: 1967 to 2013,” accessed at www.census.gov/hhes/www/income/data/historical/inequality/, on Aug. 5, 2014.
2. Andrew G. Berg and Jonathan D. Ostry, “Inequality and Unsustainable Growth: Two Sides of the Same Coin?” accessed at www.imf.org/external/pubs/ft/sdn/2011/sdn1108.pdf, on Sept. 2, 2014.
3. Standard & Poor’s Financial Services LLC, “How Increasing Income Inequality Is Dampening U.S. Economic Growth, And Possible Ways To Change The Tide,” accessed at www.globalcreditportal.com, on Sept. 2, 2014.
4. Rebecca Riffkin, “In U.S., 67% Dissatisfied With Income, Wealth Distribution,” accessed at www.gallup.com/poll/166904/dissatisfied-income-wealth-distribution.aspx, on Aug. 5, 2014.
5. Richard Reeves, “Saving Horatio Alger: Equality, Opportunity, and the American Dream,” accessed at www.brookings.edu/research/essays/2014/saving-horatio-alger#, on Oct. 21, 2014.
Inequality can be measured in many different ways, based on differences in poverty and income, wealth and assets, consumption patterns, health, and other measures of well-being. Regardless of the measure, the data generally point to rising levels of inequality in the United States. However, the choice of measures can affect conclusions about the magnitude of the increase as well as the size of the gaps between different population groups.
In this report we focus primarily on income inequality, as measured through gaps in poverty and income in the U.S. Census Bureau’s Current Population Survey and American Community Survey. The most common measures of inequality are the Gini Index and the share of aggregate income received by different subgroups of the population, often broken down by income quintile. The Census Bureau’s Gini Index—a measure of income inequality across households—is useful because it provides a long, consistent time series. However, it is limited to pretax income and does not include noncash benefits, government transfers, and tax benefits or payments that can affect a household’s disposable income. Many researchers are looking at alternative measures of inequality that can provide a slightly different picture of disparities and change over time.
For example, inequality based on consumption patterns— spending on goods and services—is lower than inequality based on income and wealth, and while most measures of inequality showed an increase in disparities during the Great Recession, consumption inequality declined during that period.1 Levels and trends in inequality also vary depending on whether researchers have controlled for government taxes and transfers, household size, and—in the case of geographic comparisons—differences in the cost of living. Several different data sources have been used to measure trends in income inequality in the United States, including the Current Population Survey, Survey of Consumer Finance, Internal Revenue Service tax records, and the American Community Survey.2
POPULATION BULLETIN CHAPTERS
Introduction
The Backdrop: Rising Inequality
Where Poverty and Inequality Intersect
The Generational Divide
Persistent Racial/Ethnic Gaps
Women Making Progress, But Gaps Remain
Education: The Great Equalizer?
Looking Ahead
1. Jonathan D. Fisher, David S. Johnson, and Timothy M. Smeeding, “Measuring the Trends in Inequality of Individuals and Families: Income and Consumption,” American Economic Review, 103, no. 3 (2013): 184-88.
2. For a comprehensive review of measures of inequality, see David S. Johnson and Timothy M. Smeeding, “Inequality Measurement,” in International Encyclopedia of the Social and Behavioral Sciences, 2d ed., ed. James D. Wright (London: Elsevier, forthcoming).
Countries around the world are paying more attention to inequality as an indicator of social and economic well-being.
According to the United Nations, it will not be possible to achieve the Millennium Development Goals unless nations first address the “widening gap between skilled and unskilled workers.” The European Union has set a goal to reduce the number of people at risk of poverty by 20 million by 2020. And U.S. mayors of 36 cities, including New York, Philadelphia, and Chicago, recently pledged to address income inequality.50
Major demographic challenges loom for U.S. policymakers. Racial/ethnic minorities are projected to account for 99 percent of U.S. population growth between 2015 and 2030, and minority youth and young adults will make up a rapidly growing share of students and workers. At the other end of the age distribution is a population of mostly white baby boomers. By 2030, all of the baby boomers will have reached retirement age and will put significant demands on Social Security and Medicare.
Racial/ethnic minorities will play an important role in keeping elderly entitlement programs afloat in the coming decades. If current levels of inequality persist, younger workers and their families will struggle to earn the middle-class wages needed to replace baby boomers in the workforce and fewer funds will flow into Social Security. Reducing disparities—especially by reducing gaps in education—will not only improve economic conditions for millions of lower-income parents and their children, but will also fuel economic growth by creating a well-qualified workforce.
POPULATION BULLETIN CHAPTERS
Introduction
The Backdrop: Rising Inequality
Where Poverty and Inequality Intersect
The Generational Divide
Persistent Racial/Ethnic Gaps
Women Making Progress, But Gaps Remain
Education: The Great Equalizer?
Looking Ahead
50. Erin Carlyle, “American Mayors Pledge to Fight Income Inequality, Low Wages,” Forbes, Aug. 11, 2014.

Levels of income inequality depend on where you live—higher in California and parts of the Northeast and South, and lower in states in the Midwest and Mountain West. Many of the states with high levels of income inequality also have large, diverse populations and high levels of residential segregation. In 2013, only eight states had Gini indices higher than the national average—California, Connecticut, Florida, Georgia, Illinois, Louisiana, Massachusetts, and New York—but over one-third of the U.S. population (36 percent) lived in these eight states. Income inequality was highest in New York, where the top 20 percent of households controlled 54 percent of household income. States with the lowest levels of inequality included Alaska, Hawaii, Idaho, New Hampshire, Utah, and Wyoming.13
Since 1979, income inequality has increased in all 50 states and the District of Columbia. From 1979 to 1999, the increase in inequality was largest in California and several states in the Northeast, including Connecticut, Massachusetts, New Jersey, and New York. But since 1999, Illinois, Indiana, Montana, North Dakota, Vermont, and Wisconsin experienced the largest increases in inequality. The rise in Montana and North Dakota may be linked to the recent oil rush in those states, which boosted incomes but also led to a growing gap between higher-income workers in the oil industry and those in lower-paying jobs. The decline in unions, especially in Rust-Belt states, has also played a role in the rise in inequality. Up to three-fourths of the increase in inequality between white-collar and blue-collar men from 1978 to 2011 has been linked to the decrease in collective bargaining.14
Like inequality, poverty has increased in recent years, but at 14.5 percent, the rate is well below levels recorded 50 years ago when President Lyndon Johnson declared a war on poverty. Poverty rates have fluctuated over time, increasing during recessions and decreasing during periods of economic growth.
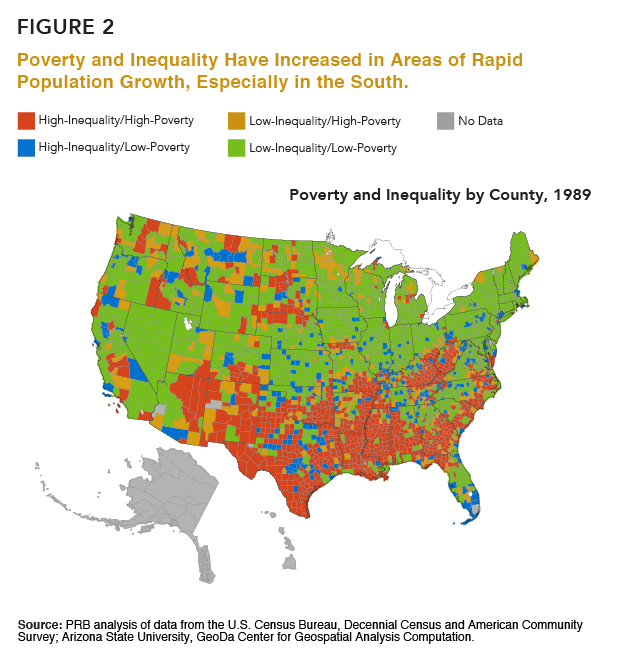
However, in many areas, poverty and inequality have increased in tandem in recent years. In the 1980s and 1990s, income inequality and poverty intersected primarily in Appalachia, the Deep South, and parts of California and the Southwest (see counties shaded orange in Figure 2). But during the past decade, poverty and inequality spread to new areas in Alabama, the Carolinas, Georgia, Michigan, and Tennessee. By 2008-2012, the majority of counties in the South (59 percent) had high levels of inequality combined with high poverty. In this analysis, counties are classified as “high poverty” if they have poverty rates greater than 15.4 percent—the average poverty rate across all of the counties and years. “High-inequality” counties are those with Gini indices greater than 0.43 (the average Gini Index across all counties and years). Nationwide, 37 percent of counties fell into this high-inequality/high-poverty category in 2008-2012, up from 31 percent in 1999 and 29 percent in 1989. In 2013, 136 million people (43 percent of the total U.S. population) lived in high inequality/high-poverty counties, more than twice the number of people who lived in high-inequality/high-poverty counties in 2000 (63 million).
In recent years, population growth has been fastest in areas with high inequality but low poverty, especially parts of the upper Midwest. Between 2010 and 2013, North Dakota was the fastest-growing state in the country, with a 7.6 percent increase in population. Among all high-inequality/low-poverty counties, the population increased by 2.7 percent from 2010 to 2013, compared with 2.2 percent growth in low-inequality/low-poverty counties, 2.0 percent growth in high-inequality/high-poverty counties, and just 0.5 percent growth in low-inequality/high-poverty areas.
These regional patterns also have a racial/ethnic component. African Americans and Latinos made up 29 percent of the U.S. population in 2013, but accounted for 41 percent of the population living in high-poverty/high-inequality counties, which are disproportionately located in the South and southwestern United States (see Figure 2). Many counties in the South are characterized by high poverty rates, high levels of residential segregation, and low levels of intergenerational mobility (economic outcomes for children relative to those of their parents). For example, in the Atlanta Metro area, only 4.5 percent of children growing up in the bottom income quintile reach the top income quintile as adults.15
Note: There are three maps in the gif.
The share of low-inequality/low-poverty counties has dropped steadily over time, from 50 percent of counties in 1989 to 44 percent of counties in 1999, to just 34 percent of counties in 2008-2012 (see Figure 3). Today, most of the remaining low-inequality/low-poverty counties are located in the upper Midwest, Mountain, Mid-Atlantic, and northeastern states.
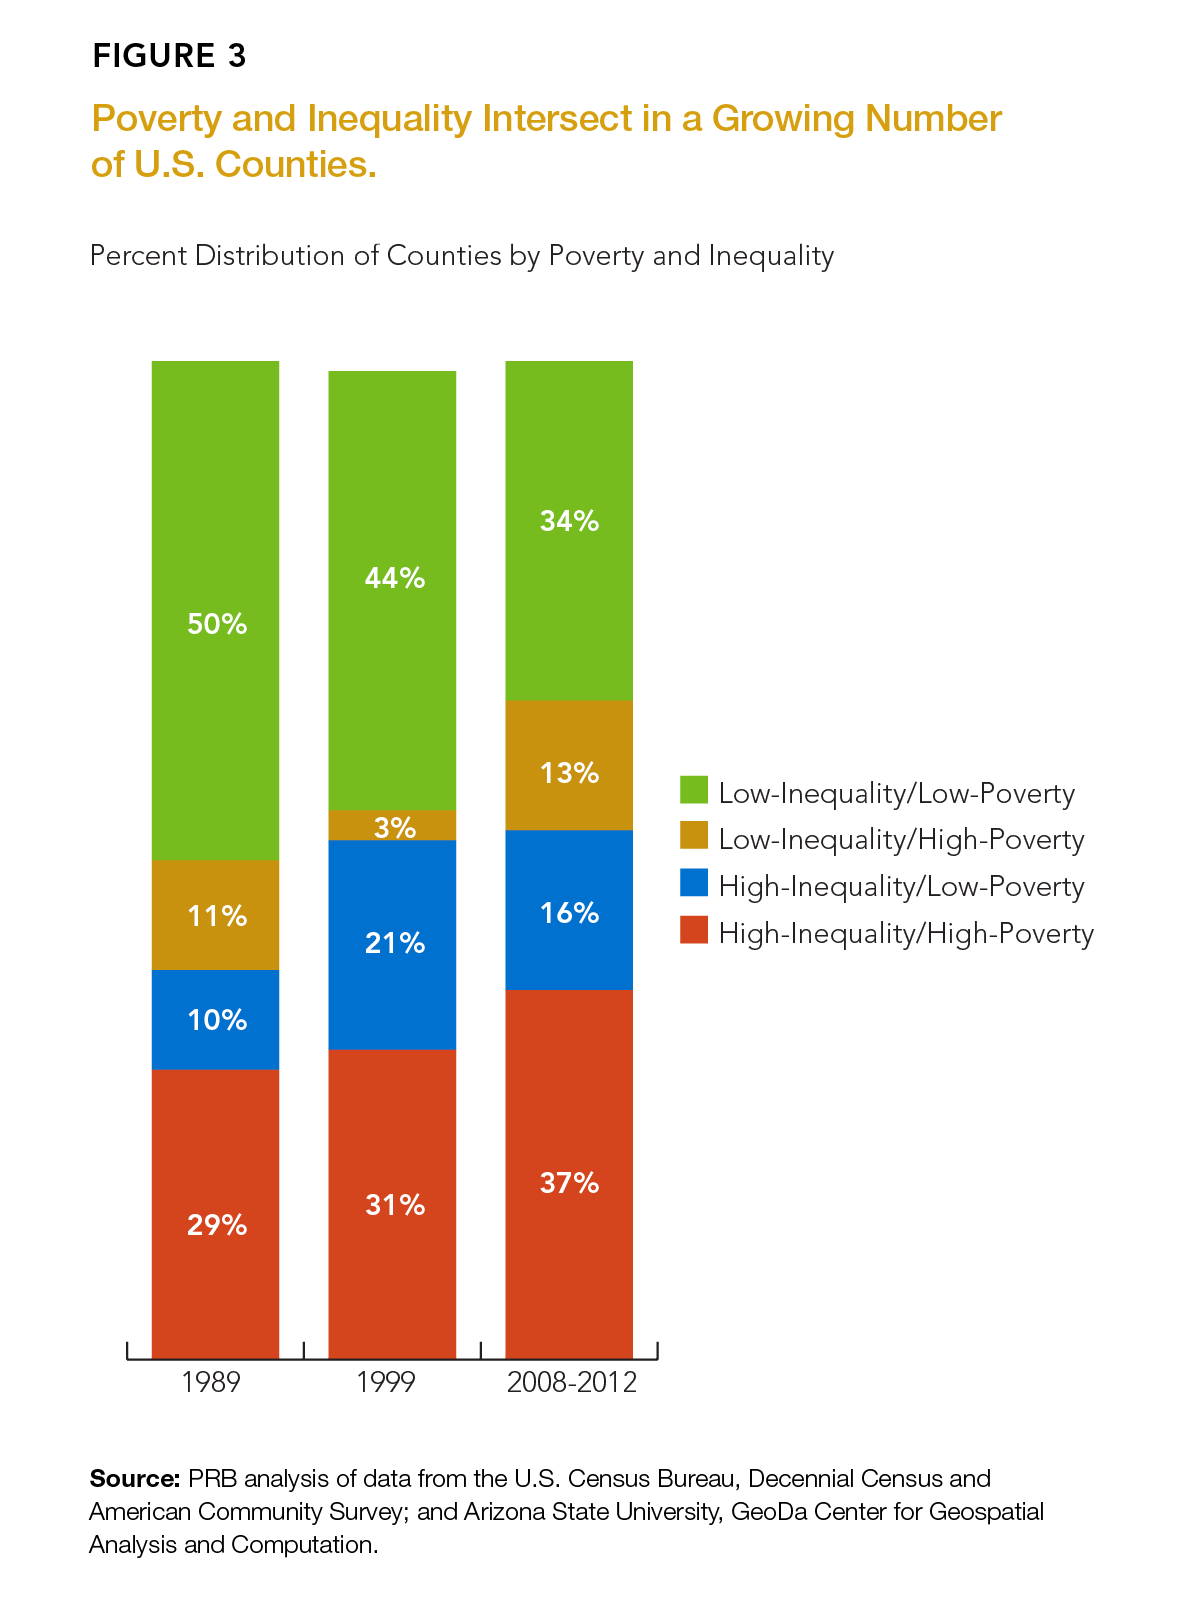
Inequality is most often discussed in the context of lower-income families but income disparities also exist in affluent communities, dividing middle-class and high-income families. The number of high-inequality/low-poverty counties peaked in 1999 during a period of rapid economic expansion and relative economic prosperity. About 21 percent of counties were classified as high-inequality/low-poverty in 1999. By 2008-2012, the share of high-inequality/low-poverty counties had dropped to 16 percent. Many of these counties are located in high-cost metropolitan areas on the East and West coasts, but there has also been a sharp increase in inequality in oil-rich North Dakota, where poverty rates remain relatively low.16
Finally, some counties have widespread poverty but a fairly narrow gap between higher-income and lower-income families. These low-inequality/high-poverty areas, almost nonexistent in 1999, made up 13 percent of counties in 2008-2012, due to job losses associated with the Great Recession, especially in parts of Maine, Michigan, Missouri, and Oregon. Also included in this group are many American Indian areas, such as Buffalo County, South Dakota, which has one of the highest poverty rates in the nation (33 percent).17
POPULATION BULLETIN CHAPTERS
Introduction
The Backdrop: Rising Inequality
Where Poverty and Inequality Intersect
The Generational Divide
Persistent Racial/Ethnic Gaps
Women Making Progress, But Gaps Remain
Education: The Great Equalizer?
Looking Ahead

Changes in racial/ethnic composition, immigration, family composition, and age structure are linked to rising income inequality but they are not the primary or root causes. Increasingly, education separates those at the top from those at the bottom.
During the past several decades, incomes have risen rapidly at the top of the income distribution, driven by technological changes combined with a slowdown in the supply of highly educated workers that has increased the returns to education.37 At the same time, structural changes in the U.S. economy have reduced real income for those with less education and fewer skills. Higher-paid manufacturing jobs have been replaced by lower-paid service jobs, resulting in stagnant or declining wages for those without college degrees.38 The recession exacerbated this trend by disproportionately affecting less-educated workers.39
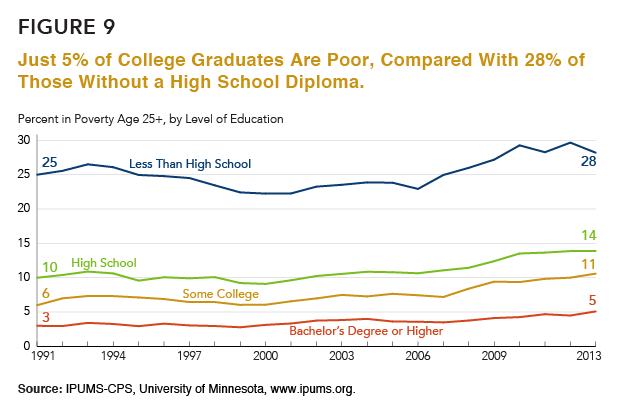
A persistent economic gap exists between college graduates and those without college degrees (see Figure 9). The poverty rate for adults ages 25 and older without a high school diploma fell slightly in 2013, but at 28 percent, is still double the poverty rate among high school graduates (14 percent). Just 5 percent of college graduates were poor in 2013.
In the United States, more than six out of every 10 jobs require some postsecondary education and training.40 Although there are many jobs that do not require college degrees, with increasing globalization in a knowledge-based economy, the demand for highly educated and skilled workers in the United States will only continue to grow. For most young people, going to college is one of the most important steps they can take to become financially independent adults. College graduates have significantly higher lifetime earnings ($2.3 million) compared with those who have no education beyond high school ($1.3 million).41 College graduates are also much less likely to be unemployed and they enjoy a wide range of other social, economic, and health benefits.42 Parents who have completed college are also much more likely to have children who go to college, so the benefits of education are transferred from one generation to the next. Increasing college completion rates also boosts potential innovation, economic output, and productivity.43
In recent years, college enrollment and “persistence” rates have declined, and some policymakers and others are concerned that future generations of young adults may have less education than their parents and grandparents—a trend that could undermine economic growth and exacerbate levels of income inequality in the United States.
Recent estimates suggest that demand for college-educated workers has outstripped supply since the early 1990s, and some experts warn that educational progress could stall in the coming decades. Slower gains in college enrollment and completion are projected with the changing racial/ethnic composition of the U.S. population. A growing share of young adults are Latino, including many first- and second-generation immigrants who are less likely to graduate from high school or college compared with those in U.S.-born families. Among young adults ages 25 to 29, Latinos are the least likely to finish four years of college (16 percent), while college completion rates are highest among Asian Americans (59 percent) and whites (40 percent).44 With the Latino population projected to continue its rapid growth, the deficit in college-educated workers may increase unless these gaps are reduced.
Lower-income families often struggle to cover the costs of education for their children, especially at the college level. Students in low-income families are more likely to be enrolled in community colleges, with fewer resources and less institutional support than students from more-affluent families. One study showed that the college completion rate for students starting at community colleges is only 18 percent, compared with a 90-percent completion rate among students at selective private colleges and universities.45
Investments in education are key to reducing disparities between population groups. From preschool through college, education provides necessary stepping stones for success later in life. For young children, attending preschool prior to kindergarten leads to better cognitive outcomes, social skills, and school achievement.46 Finishing high school puts children on the path to becoming productive adults. Many teen dropouts are disconnected from both school and the workforce, and they are twice as likely to be poor as their peers who are in school or working. A college degree generally leads to a good job, higher earnings, and upward mobility.
Education is also a key predictor of health and longevity.People with higher levels of education have higher earnings; live in better neighborhoods; and can afford to buy better medical care, health insurance, and healthier foods.47
In the coming decades, college completion rates will most likely continue to increase, although at a slower pace than policymakers and education advocates would like. The White House has set an ambitious goal of increasing the share of U.S. adults ages 25 to 34 with college degrees from roughly 40 percent today to 60 percent by 2020.48 However, the National Center for Education Statistics projects that the United States will fall well short of this goal.49
Policymakers can take steps to boost educational attainment by increasing tuition assistance to lower-income families, so that children growing up in these families have the same access to college as those in higher-income families; reaching out to potential college students living in remote or underserved communities, especially those in high-poverty urban and rural areas; providing child care, housing, and transportation assistance to lower-income families, so that parents can reach their own educational and occupational goals—and then pass those same aspirations and expectations on to their children; and ensuring that children in middle and high school are academically prepared for college, to create a stronger education pipeline.
POPULATION BULLETIN CHAPTERS
Introduction
The Backdrop: Rising Inequality
Where Poverty and Inequality Intersect
The Generational Divide
Persistent Racial/Ethnic Gaps
Women Making Progress, But Gaps Remain
Education: The Great Equalizer?
Looking Ahead
References
 ">
">


 ">
">
 ">
">
 ">
">
 ">
">