
– A –
Abortion Rate The number of abortions per 1,000 women ages 15-44 or 15-49 in a given year.
Abortion Ratio The number of abortions per 1,000 live births in a given year.
Acquired Immunodeficiency Syndrome (AIDS) Applies to the most advanced stages of HIV infection. It is defined by the occurrence of any of more than 20 opportunistic infections or HIV-related cancers.
Age-Dependency Ratio The ratio of persons in the ages defined as dependent (under 15 years and over 64 years) to persons in the ages defined as economically productive (15-64 years) in a population.
Age Structure The proportion of the total population in each age group.
Age-Sex Structure The composition of a population as determined by the number or proportion of males and females in each age category. The age-sex structure of a population is the cumulative result of past trends in fertility, mortality, and migration. Information on age-sex composition is essential for the description and analysis of many other types of demographic data. See also population pyramid.
Age-Specific Rate Rate obtained for specific age groups (for example, age-specific fertility rate, death rate, marriage rate, illiteracy rate, or school enrollment rate).
Aging of Population A process in which the proportions of adults and elderly increase in a population, while the proportions of children and adolescents decrease. This process results in a rise in the median age of the population. Aging occurs when fertility rates decline while life expectancy remains constant or improves at the older ages.
Antinatalist Policy The policy of a government, society, or social group to slow population growth by attempting to limit the number of births.
Antiretroviral therapy (ART) Treatment of people infected with human immunodeficiency virus (HIV) using anti-HIV drugs. The standard treatment consists of a combination of at least three drugs (often called “highly active antiretroviral therapy” or HAART) that suppress HIV replication. Three drugs are used in order to reduce the likelihood of the virus developing resistance. ART has the potential both to reduce mortality and morbidity rates among HIV-infected people, and to improve their quality of life.
– B –
Baby Boom A dramatic increase in fertility rates and in the absolute number of births in the United States, Canada, Australia, and New Zealand during the period following World War II (1947-1961).
Baby Bust A rapid decline in U.S. fertility rates to record-low levels during the period immediately after the baby boom.
Balancing Equation A basic demographic formula used to estimate total population change between two points in time — or to estimate any unknown component of population change, provided that the other components are known. The balancing equation includes all components of population change: births, deaths, immigration, emigration, in-migration, and out-migration.
Birth Control Practices employed by couples that permit sexual intercourse with reduced likelihood of conception and birth. The term birth control is often used synonymously with such terms as contraception, fertility control, and family planning. But birth control includes abortion to prevent a birth, whereas family planning methods explicitly do not include abortion.
Birth Rate (or crude birth rate) The number of live births per 1,000 population in a given year. Not to be confused with the growth rate.
Birth Rate for Unmarried Women The number of live births per 1,000 unmarried women (never married, widowed, or divorced) ages 15-49 in a given year.
Brain Drain The emigration of a significant proportion of a country’s highly skilled, highly educated professional population, usually to other countries offering better economic and social opportunity (for example, physicians leaving a developing country to practice medicine in a developed country).
– C –
Carrying Capacity The maximum sustainable size of a resident population in a given ecosystem.
Case Fatality Rate The proportion of persons contracting a disease who die from it during a specified time period.
Case Rate The number of reported cases of a specific disease per 100,000 population in a given year.
Cause-Specific Death Rate The number of deaths attributable to a specific cause per 100,000 population in a given year.
Census A canvass of a given area, resulting in an enumeration of the entire population and often the compilation of other demographic, social, and economic information pertaining to that population at a specific time. See also survey.
Childbearing Years The reproductive age span of women, assumed for statistical purposes to be 15-44 or 15-49 years of age.
Child-Woman Ratio The number of children under age 5 per 1,000 women ages 15-44 or 15-49 in a population in a given year. This crude fertility measure, based on basic census data, is sometimes used when more specific fertility information is not available.
Closed Population A population with no migratory flow either in or out, so that changes in population size occur only through births and deaths.
Cohort A group of people sharing a common temporal demographic experience who are observed through time. For example, the birth cohort of 1900 is the people born in that year. There are also marriage cohorts, school class cohorts, and so forth.
Cohort Analysis Observation of a cohort’s demographic behavior through life or through many periods; for example, examining the fertility behavior of the cohort of people born between 1940 and 1945 through their entire childbearing years. Rates derived from such cohort analyses are cohort measures. Compare with period analysis.
Completed Fertility Rate The number of children born per woman to a cohort of women by the end of their childbearing years.
Consensual Union Cohabitation by an unmarried couple for an extended period of time. Although such unions may be quite stable, they are not regarded as legal marriages in official statistics.
Contraceptive Prevalence Percentage of couples currently using a contraceptive method.
Contraceptive Use The percentage of currently married or “in union” women (unless otherwise indicated) of reproductive age who are currently using any form of contraception. Modern methods comprise clinic and supply methods, including the pill, injectable, implant, IUD, condom, and sterilization.
Crude Rate Rate of any demographic event computed for an entire population.
– D –
Death Rate (or crude death rate) The number of deaths per 1,000 population in a given year.
Demographic Transition The historical shift of birth and death rates from high to low levels in a population. The mortality decline usually precedes the fertility decline, resulting in rapid population growth during the transition period.
Demography The scientific study of human populations, including their sizes, compositions, distributions, densities, growth, and other characteristics, as well as the causes and consequences of changes in these factors.
Dependency Ratio A dependency ratio is the ratio of people in a dependent age group (those under age 15 or ages 65 and older) to those in the economically productive age group (ages 15 to 64) of a population. For instance, a child dependency ratio of 0.45 means there are 45 children for every 100 working-age adults.
Depopulation The state of population decline.
Divorce Rate (or crude divorce rate) The number of divorces per 1,000 population in a given year.
Double Dependency Moderate child dependency and relatively high old-age dependency reflect above or near replacement fertility and declining mortality.
Doubling Time The number of years required for the population of an area to double its present size, given the current rate of population growth.
– E –
Economic Infrastructure Economic infrastructure includes the internal facilities of a country that make business and financial activity possible, such as communication, transportation, and distribution networks; financial institutions and markets; and energy supply systems.
Economic Security The condition of having stable income or other resources to support a standard of living now and in the foreseeable future.
Emigration The process of leaving one country to take up permanent or semipermanent residence in another.
Emigration Rate The number of emigrants departing an area of origin per 1,000 population in that area of origin in a given year.
Ethnicity The cultural practices, language, cuisine, and traditions — not biological or physical differences — used to distinguish groups of people.
– F –
Family Usually two or more persons living together and related by birth, marriage, or adoption. Families may consist of siblings or other relatives as well as married couples and any children they have.
Family Planning The conscious effort of couples to regulate the number and spacing of births through artificial and natural methods of contraception. Family planning connotes conception control to avoid pregnancy and abortion, but it also includes efforts of couples to induce pregnancy.
Fecundity The physiological capacity of a woman to produce a child.
Fertility The actual reproductive performance of an individual, a couple, a group, or a population. See general fertility rate.
– G –
Gender refers to the economic, social, political, and cultural attributes, constraints and opportunities associated with being a woman or a man. The social definitions of what it means to be a woman or a man vary among cultures and change over time. Gender is a sociocultural expression of particular characteristics and roles that are associated with certain groups of people with reference to their sex and sexuality.
Gender Equity is the process of being fair to women and men. To ensure fairness, measures must be taken to compensate for historical and social disadvantages that prevent women and men from operating on a level playing field.
Gender Equality is the state or condition that affords women and men equal enjoyment of human rights, socially valued goods, opportunities, and resources.
General Fertility Rate The number of live births per 1,000 women ages 15-44 or 15-49 years in a given year.
Gross National Income (GNI) GNI (formerly GNP) is the sum of value added by all resident producers plus any product taxes (less subsidies) not included in the valuation of output plus net receipts of primary income (compensation of employees and property income) from abroad. Data are in current U.S. dollars. GNI, calculated in national currency, is usually converted to U.S. dollars at official exchange rates for comparisons across economies, although an alternative rate is used when the official exchange rate is judged to diverge by an exceptionally large margin from the rate actually applied in international transactions.
Gross Reproduction Rate (GRR) The average number of daughters that would be born alive to a woman (or group of women) during her lifetime if she passed through her childbearing years conforming to the age-specific fertility rates of a given year. See also net reproduction rate and total fertility rate.
Growth Rate The number of people added to (or subtracted from) a population in a year due to natural increase and net migration expressed as a percentage of the population at the beginning of the time period.
– H –
High Child Dependency High fertility and relatively high mortality contribute to a large young population and a small old-age population.
High-risk pregnancies Pregnancies occurring under the following conditions: too closely spaces, too frequent, mother too young or too old, or accompanied by such high-risk factors as high blood pressure or diabetes.
High-Old-Age Dependency Moderate child dependency and relatively high old-age dependency reflect above or near replacement fertility and declining mortality.
Household One or more persons occupying a housing unit.
Human Immunodeficiency Virus (HIV) Retrovirus that infects cells of the immune system, destroying or impairing their function. As the infection progresses, the immune system becomes weaker, and the person becomes more susceptible to infections.
HIV is transmitted through unprotected sexual intercourse, transfusion of contaminated blood, sharing of contaminated needles, and between a mother and her infant during pregnancy, childbirth and breastfeeding.
– I –
Immigration The process of entering one country from another to take up permanent or semipermanent residence.
Immigration Rate The number of immigrants arriving at a destination per 1,000 population at that destination in a given year.
Incidence Rate The number of persons contracting a disease per 1,000 population at risk, for a given period of time.
Infant Mortality Rate The number of deaths of infants under age 1 per 1,000 live births in a given year.
In-migration The process of entering one administrative subdivision of a country (such as a province or state) from another subdivision to take up residence.
– L –
Least Developed Countries Following United Nations’ definitions, the term “least developed countries” includes as of March 2018: Afghanistan, Angola, Bangladesh, Benin, Bhutan, Burkina Faso, Burundi, Cambodia, Central African Republic, Chad, Comoros, Democratic Republic of the Congo, Djibouti, Eritria, Ethiopia, Gambia, Guinea, Guinea-Bissau, Haiti, Kiribati, Lao People’s Democratic Republic, Lesotho, Liberia, Madagascar, Malawi, Mali, Mauritania, Mozambique, Myanmar, Nepal, Niger, Rwanda, São Tomé and Príncipe, Senegal, Sierra Leone, Solomon Islands, Somalia, Sudan, Timor-Leste, Togo, Tuvalu, Uganda, Vanuatu, Yemen, and Zambia. These countries are also “less developed” in United Nations’ terminology.
Less Developed Countries Following United Nations’ definitions, the term “less developed countries” (or regions) refers to countries in Africa, Asia (except Japan), Latin America and the Caribbean, and Oceania (except Australia and New Zealand).
Life Expectancy The average number of additional years a person could expect to live if current mortality trends were to continue for the rest of that person’s life. Most commonly cited as life expectancy at birth.
Life Span The maximum age that human beings could reach under optimum conditions.
Life Table A tabular display of life expectancy and the probability of dying at each age (or age group) for a given population, according to the age-specific death rates prevailing at that time. The life table gives an organized, complete picture of a population’s mortality.
Low Overall Dependency Sustained immigration of working-age adults, with a small share of the population ages 65+, results in low overall dependency.
– M –
Male Involvement means engaging men in actively promoting gender equity with regard to reproductive health, increases men’s support for women’s reproductive health and children’s well-being, and advances the reproductive health of both men and women.
Malthus, Thomas R. (1766-1834) English clergyman and economist famous for his theory (expounded in the ‘Essay on the Principle of Population’) that the world’s population tends to increase faster than the food supply and that unless fertility is controlled (by late marriage or celibacy), famine, disease, and war must serve as natural population restrictions. See neo-Malthusian.
Marital Fertility Rate Number of live births to married women per 1,000 married women ages 15-44 or 15-49 in a given year.
Marriage Rate (or crude marriage rate) The number of marriages per 1,000 population in a given year.
Maternal Mortality Ratio The number of women who die as a result of pregnancy and childbirth complications per 100,000 live births in a given year.
Mean Age The mathematical average age of all the members of a population.
Median Age The age that divides a population into two numerically equal groups; that is, half the people are younger than this age and half are older.
Megalopolis A term denoting an interconnected group of cities and connecting urbanized bands.
MENA Countries The Middle East and North Africa (MENA) is an economically diverse region that includes both the oil-rich economies in the Gulf and countries that are resource-scarce in relation to population. The region’s economic fortunes over much of the past quarter century have been heavily influenced by two factors: the price of oil and the legacy of economic policies and structures that had emphasized a leading role for the state. The MENA region includes: Algeria, Bahrain, Djibouti, Egypt, Iran, Iraq, Israel, Jordan, Kuwait, Lebanon, Libya, Malta, Morocco. Oman, Qatar, Saudi Arabia, Syria, Tunisia, United Arab Emirates, West Bank and Gaza, and Yemen.
Metropolitan Area A large concentration of population, usually an area with 100,000 or more people. The area typically includes an important city with 50,000 or more inhabitants and the administrative areas bordering the city that are socially and economically integrated with it.
Migration The movement of people across a specified boundary for the purpose of establishing a new or semipermanent residence. Divided into international migration (migration between countries) and internal migration (migration within a country).
Millennium Development Goals (MDGs) The United Nations Millennium Development Goals are eight goals that all 191 UN member states have agreed to try to achieve by the year 2015. The United Nations Millennium Declaration, signed in September 2000, commits world leaders to combat poverty, hunger, disease, illiteracy, environmental degradation, and discrimination against women. The MDGs are derived from this declaration, and all have specific targets and indicators.
Mobility The geographic movement of people.
Moderate Child Dependency Declining fertility lowers child dependency to a moderate level; relatively high mortality keeps old-age dependency low.
More Developed Countries Following United Nations’ definitions, “more developed countries,” or industrialized countries (or regions), include Europe (including all of Russia), the United States, Canada, Australia, New Zealand, and Japan.
Mortality Deaths as a component of population change.
– N –
Natality Births as a component of population change.
Natural Increase (or Decrease) The surplus (or deficit) of births over deaths in a population in a given time period.
Neo-Malthusian An advocate of restricting population growth through the use of birth control. (Thomas Malthus himself did not advocate birth control as a remedy for rapid population growth.)
Neonatal Mortality Rate The number of deaths to infants under 28 days of age in a given year per 1,000 live births in that year.
Net Migration The estimated rate of net migration (immigration minus emigration) per 1,000 population. For some countries, data are derived as a residual from estimated birth, death, and population growth rates.
Net Migration Rate The net effect of immigration and emigration on an area’s population, expressed as an increase or decrease per 1,000 population of the area in a given year.
Net Reproduction Rate (NRR) The average number of daughters that would be born to a woman (or a group of women) if she passed through her lifetime conforming to the age-specific fertility and mortality rates of a given year. This rate is similar to the gross reproduction rate but takes into account that some women will die before completing their childbearing years. An NRR of one means that each generation of mothers is having exactly enough daughters to replace itself in the population. See also total fertility rate and replacement-level fertility.
Nuptiality The frequency, characteristics, and dissolution of marriages in a population.
– O –
“Old” Population A population with a relatively high proportion of middle-age and elderly persons, a high median age, and thus a lower growth potential.
Out-migration The process of leaving one subdivision of a country to take up residence in another.
– P –
Parity The number of children previously born alive to a woman; for example, ‘two-parity women’ are women who have had two children and ‘zero-parity women’ have had no live births.
Percent Urban Percentage of the total population living in areas termed “urban” by that country or by the UN.
Perinatal Mortality Rate The number of fetal deaths after 28 weeks of pregnancy (late fetal deaths) plus the number of deaths to infants under 7 days of age per 1,000 live births.
Period Analysis Observation of a population at a specific period of time. Such an analysis in effect takes a ‘snapshot’ of a population in a relatively short time period — for example, one year. Most rates are derived from period data and therefore are period rates. Compare to cohort analysis.
Population A group of objects or organisms of the same kind.
Population Control A broad concept that addresses the relationship between fertility, mortality, and migration, but is most commonly used to refer to efforts to slow population growth through action to lower fertility. It should not be confused with family planning. See also family planning.
Population Density Population per unit of land area; for example, people per square mile or people per square kilometer of arable land.
Population Distribution The patterns of settlement and dispersal of a population.
“Population Explosion” (or “Population Bomb”) Expressions used to describe the 20th century worldwide trend of rapid population growth, resulting from a world birth rate much higher than the world death rate.
Population Increase The total population increase resulting from the interaction of births, deaths, and migration in a population in a given period of time.
Population Momentum The tendency for population growth to continue beyond the time that replacement-level fertility has been achieved because of the relatively high concentration of people in the childbearing years.
Population Policy Explicit or implicit measures instituted by a government to influence population size, growth, distribution, or composition.
Population Projection Computation of future changes in population numbers, given certain assumptions about future trends in the rates of fertility, mortality, and migration. Demographers often issue low, medium, and high projections of the same population, based on different assumptions of how these rates will change in the future.
Population Pyramid A bar chart, arranged vertically, that shows the distribution of a population by age and sex. By convention, the younger ages are at the bottom, with males on the left and females on the right.
Population Register A government data collection system in which the demographic and socioeconomic characteristics of all or part of the population are continuously recorded. Denmark, Sweden, and Israel are among the countries that maintain universal registers for demographic purposes — recording the major events (birth, marriage, moves, death) that happen to each individual so that up-to-date information on the whole population is readily available. Other countries, like the United States, keep partial registers, such as social security and voter registration, for administrative purposes.
Post-Neonatal Mortality Rate The annual number of deaths of infants ages 28 days to 1 year per 1,000 live births in a given year.
Prevalence Rate The number of people having a particular disease at a given point in time per 1,000 population at risk.
Pronatalist Policy The policy of a government, society, or social group to increase population growth by attempting to raise the number of births.
Purchasing Power The ability of consumers to acquire goods and services based on their possession of money and/or their recourse to credit.
“Push-Pull” Hypothesis A migration theory that suggests that circumstances at the place of origin (such as poverty and unemployment) repel or push people out of that place to other places that exert a positive attraction or pull (such as a high standard of living or job opportunities).
– R –
Race Race is defined primarily by society, not by genetics, and there are no universally accepted categories.
Rate of Natural Increase (or Decrease) The rate at which a population is increasing (or decreasing) in a given year due to a surplus (or deficit) of births over deaths, expressed as a percentage of the base population.
Remarriage Rate The number of remarriages per 1,000 formerly married (that is, widowed or divorced) men or women in a given year.
Replacement–Level Fertility The level of fertility at which a couple has only enough children to replace themselves, or about two children per couple.
Reproductive Age See childbearing years.
Reproductive Health Reproductive health is a state of complete physical, mental, and social well-being and not merely the absence of disease or infirmity, in all matters relating to the reproductive system and to its functions and processes.
– S –
Sex Ratio The number of males per 100 females in a population.
Social Mobility A change in status (for example, an occupational change).
Stable Population A population with an unchanging rate of growth and an unchanging age composition as a result of age-specific birth and death rates that have remained constant over a sufficient period of time.
Survey A canvass of selected persons or households in a population usually used to infer demographic characteristics or trends for a larger segment or all of the population. See also census.
Survival Rate The proportion of persons in a specified group (age, sex, or health status) alive at the beginning of an interval (such as a five-year period) who survive to the end of the interval.
– T –
Total Fertility Rate (TFR) The average number of children that would be born alive to a woman (or group of women) during her lifetime if she were to pass through her childbearing years conforming to the age-specific fertility rates of a given year. This rate is sometimes stated as the number of children women are having today. See also gross reproduction rate and net reproduction rate.
– U –
Under 5 (U5) Child Mortality Probability of a child born in a specific year or period dying before reaching the age of 5.
Undocumented Immigrant A foreigner who has entered a country without inspection or without proper documents, or who has violated the terms of legal admission to the country, for example, by overstaying the duration of a tourist or student visa.
Unmet Need Women with unmet need for spacing births are those who are able to become pregnant and sexually active but are not using any method of contraception (modern or traditional), and report wanting to delay the next child or limit their number of births. The concept of unmet need points to the gap between women’s reproductive intentions and their contraceptive behavior.
Urban Countries differ in the way they classify population as ‘urban’ or ‘rural.’ Typically, a community or settlement with a population of 2,000 or more is considered urban. A listing of country definitions is published annually in the United Nations Demographic Yearbook.
Urbanization Growth in the proportion of a population living in urban areas.
– V –
Vital statistics Demographic data on births, deaths, fetal deaths, marriages and divorces.
– W –
Women’s Empowerment means improving the status of women to enhance their decisionmaking capacity at all levels, especially as it relates to their sexuality and reproductive health.
– Y –
“Young” Population A population with a relatively high proportion of children, adolescents, and young adults; a low median age; and thus a high growth potential.
– Z –
Zero Population Growth A population in equilibrium, with a growth rate of zero, achieved when births plus immigration equal deaths plus emigration.

While we have much to learn yet about the novel coronavirus SARS-CoV2, and the COVID-19 disease it causes, evidence to date suggests that deaths among people who have tested positive for the coronavirus are highest at older ages and near zero for young children. Higher mortality rates at older ages may be associated with the increased prevalence of chronic conditions at older ages, such as cardiovascular diseases, diabetes, and chronic respiratory diseases. These chronic conditions appear to be associated with more severe illness and worse patient outcomes. The age pattern of mortality means that areas with higher proportions of older adults are likely at risk of higher rates of severe illness or death than those with younger populations.
Many factors may affect the intensity of a COVID-19 outbreak in a given country, including underlying health conditions in the population, the effectiveness of government response, and the availability of health care resources. Age structure (the share of the total population in each age group) alone cannot tell us which countries will be hardest hit in the pandemic but can provide important context in understanding and responding to the crisis. If two countries have the same age-specific mortality rates from COVID-19, the country with an older population would have more deaths per 1,000 people—a higher crude death rate—from the disease than the country with the younger population.
For example, social distancing measures in Italy may have helped that country reduce transmission of the disease, but its high proportion of older adults, in combination with high case fatality rates (proportion of the confirmed cases with COVID-19 that were fatal) at older ages has contributed to a large number of COVID-19-related deaths. In 2020, Italy was one of the oldest countries in the world; nearly 30% of Italy’s population is ages 60 and older and nearly 4% is ages 85 and older (see table). In contrast, China—where the virus started and the number infected spiraled until recently—has 17% of population ages 60 and older and less than 1% ages 85 and older. With the death rate from the disease reported to be six times higher among those above age 80 compared with the rate overall, the number of COVID-19-related deaths could have been much higher if China had an older age structure.1
Click on the table and interactive figure to compare age structures across countries.
Table. Comparing Age Structures Across Countries, 2020
| wdt_ID | Country | Ages 60 and Older | Ages 85 and Older |
|---|---|---|---|
| 1 | Argentina | 15.5 | 1.2 |
| 2 | Australia | 21.8 | 2.1 |
| 3 | Brazil | 14.0 | 0.9 |
| 4 | Chile | 17.4 | 1.4 |
| 5 | China | 17.4 | 0.7 |
| 6 | Egypt | 8.2 | 0.3 |
| 7 | France | 26.8 | 3.4 |
| 8 | Germany | 28.6 | 3.1 |
| 9 | Iran | 10.3 | 0.4 |
| 10 | Italy | 29.8 | 3.7 |
| 11 | Japan | 34.3 | 4.8 |
| 12 | Kenya | 4.2 | 0.1 |
| 13 | Nigeria | 4.5 | 0.0 |
| 14 | Peru | 12.5 | 0.7 |
| 15 | South Africa | 8.5 | 0.2 |
| 16 | South Korea | 23.2 | 1.5 |
| 17 | United Kingdom | 24.4 | 2.5 |
| 18 | United States | 22.9 | 2.0 |
Source: PRB analysis of data by the United Nations, Department of Economic and Social Affairs, World Population Prospects: 2019 Revision, https://population.un.org/wpp/.
Figure. Population by Age Group, 2020
Click on image to view interactive.


 ">
">
(July 2015) PRB welcomes 10 Policy Communication Fellows from around the world to our Washington office for the summer workshop, kicking off the year-long program. This year’s Fellows come from 10 countries: Bangladesh, Burkina Faso, Ethiopia, Ghana, India, Malawi, Nigeria, Pakistan, South Africa, and Tanzania. Following training by PRB staff and guests and visits to USAID and the World Bank, the workshop will close with each fellow delivering a policy presentation they have developed from their research.
PRB started the Policy Communication Fellows program to bridge the gap that often exists between the research and policy environments. Research often has profound implications for policy, but without proper communication between the research community and policy audiences, the significance of research findings may be lost. The responsibility to address this gap lies with both policymakers and researchers. The main objective of the program is to train future researchers (current Ph.D. students) from developing countries who are involved in health and population issues to:
- Understand the process by which research informs the policy environment;
- Identify and communicate the policy implications of their research; and
- Learn various ways to communicate findings to policy audiences.
Participants begin the fellowship year with a two-week workshop, during which they learn the skills necessary to effectively communicate their research to policy audiences. During the course of the fellowship year, participants apply those skills through several written assignments. The program year concludes with a short workshop prior to the Population Association of America Annual Meeting, during which the Fellows make formal policy presentations on the results and recommendations of their research.
The Policy Communication Fellows program began in 1987. The program has changed over time, but a few core pieces remain the same: The program has always begun with a two-week program during the summer; a shorter one-day or two-day workshop in conjunction with the Population Association of America annual meeting in the spring; mentorship from PRB staff through the year; and a strong focus on writing for policy audiences.
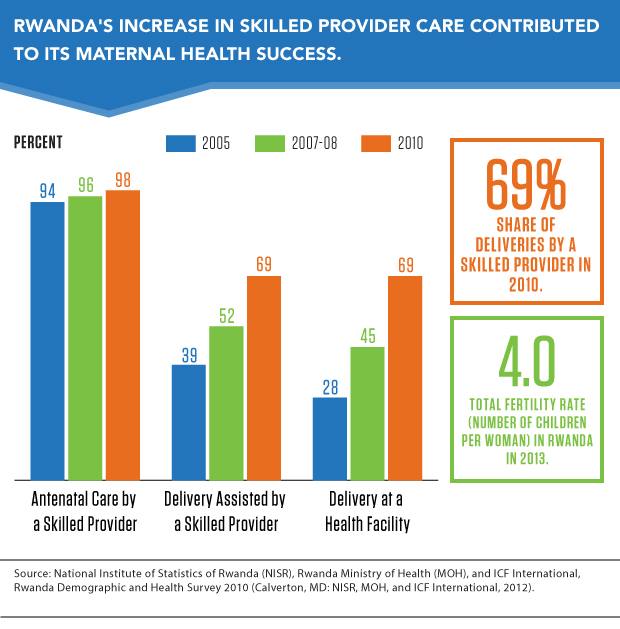
(February 2015) Less than a generation after the genocide in Rwanda that claimed 1 million lives, left 2 million displaced, and destroyed health systems, Rwanda today has been hailed as one of the few countries on a fast track to reducing child and maternal mortality—thus meeting two of the United Nations Millennium Development Goals in 2015.
Rwanda’s maternal mortality ratio decreased by 77 percent between 2000 and 2013 and currently stands at 320 deaths per 100,000 live births.1 Under-5 child mortality has been reduced by more than 70 percent and is well on the way to meet the goal of 54 deaths per 1,000 live births.2
Many factors created this success story. The increase in skilled providers during childbirth over a decade has been especially important for women; and for children, improvements in immunization coverage and exclusive breastfeeding are important factors.
Maternal Health a Priority in Postwar Rebuilding
After the genocide, Rwanda faced a severe health worker shortage, as well as limited health infrastructure and high rates of maternal and child mortality. The government prioritized reproductive, maternal, newborn, and child health as a way to rebuild basic systems and services through several complementary policies:
- Health workforce and infrastructure development.
- Strong community involvement.
- A comprehensive community-based health insurance scheme.
- System strengthening through innovative data collection tools.
Declines in maternal mortality are linked to skilled birth attendance and improvements in the contraceptive coverage rate. Rwanda bolstered its workforce to address maternal and child mortality. By 2012, there was one doctor per 16,000 people and one nurse per 1,300 people. Before 1997, Rwanda had no trained midwives, but now there are around 1,000.3 Rwanda established new standards for quality of care, and in 2010, delivery by a skilled provider was at 69 percent, as was delivery in a health facility (see figure).
The government decentralized the health sector to strengthen community involvement and trained 45,000 community health workers to provide primary health services at the village level. Elected by their community, these workers connect communities to health services, especially in remote areas, and monitor health at the village level. Each village elects three volunteers who are trained by the Ministry of Health: a male and a female, who are in charge of integrated case management of childhood illness and family planning; and a female who is in charge of maternal and newborn care. They all play a key role in expanding the coverage of family planning, antenatal care, and childhood immunization, and they also provide services for malaria, pneumonia, and diarrheal diseases.
Rwanda’s national performance-based financing system rewards community health workers according to selected indicators, including the proportion of women delivering at health facilities and the percentage of children receiving a full course of basic immunizations. Such incentives have helped boost the use of maternal and child health services, according to Paul Farmer, a U.S. physician living in Rwanda, known for his work with underserved populations.4
Maternal and Child Health Core of Community-Based Health Insurance
Rwanda’s government is committed to providing universal health care as part of its Vision 2020 Strategy. Since 2000, the core of this commitment has been its community-based health insurance scheme known as Mutuelle de Santé. The system lowers catastrophic out-of-pocket payments and ensures access for vulnerable populations, focusing on maternal and child health services.
Community committees are responsible for mobilizing and registering members, collecting fees, and clearing bills from health facilities. Annual premiums are based on wealth categories. Ambulance transport is also covered, thus reducing a significant barrier to emergency care for pregnant women who have complications.5 With specially programmed mobile phones, community health workers can contact health facilities for referrals.
From 2000 to 2007, growth in use of health services was greatest among the poorest people. Health insurance was made compulsory in 2008 and by 2012, 90 percent of the population had enrolled.6
Hand-in-hand with its comprehensive insurance program, Rwanda has adopted a number of innovative tools to strengthen its health systems. All maternal and child health services are integrated under one national monitoring and evaluation framework to improve priority setting, planning, and resource allocation. Rwanda has developed a web-based Health Management Information System to collect data from a variety of sources and has scaled up maternal death reviews as part of their efforts to strengthen data collection.7
Family Planning Key to Sustained Success in Maternal Health
The success story in maternal health is also a story about increased family planning coverage. Modern contraceptive prevalence increased in Rwanda from 4 percent to 45 percent in 10 years. Research shows that family planning can prevent as many as one in three maternal deaths by allowing women to delay motherhood, space births, avoid unintended pregnancies, and stop childbearing when they have reached their desired family size.
Rwanda’s total fertility rate decreased from 6.2 children per woman in 1992 to 4.0 in 2013.8 Community health workers have much to do with these successes. They can provide condoms, pills, injectables, and cycle beads. The fast-improving uptake of maternal health services has been linked to a strong positive response to community health workers; the push to subscribe to the community-based insurance scheme; and an effective public education campaign that reached three-quarters of women, supported by a system of fines imposed on those who fail to attend antenatal care and deliver in health care centers.9
Challenges Remain
Rwanda still faces challenges. The country needs 586 more midwives to reach 95 percent skilled birth attendance.10 Rural areas are still underserved: Forty percent of women live more than an hour away from a health facility. Even with the increase in family planning and decline in the total fertility rate, contraception remains unavailable to or underused by many Rwandans. And nearly one in every two children under 5 are stunted.
In 1995, most development agencies were ready to give up on Rwanda, then one of the poorest and most vulnerable countries in the world. But now, Rwanda is one of the few countries on track in 2015 to meet the Millennium Development Goals for reducing child and maternal health.
References
- World Health Organization, Trends in Maternal Mortality: 1990 to 2013 (Geneva: WHO, 2014).
- Rwanda Ministry of Health et al., Success Factors for Women’s and Children’s Health: Rwanda (Geneva: Partnership for Maternal, Newborn, & Child Health and World Health Organization, 2014).
- Rwanda Ministry of Health et al., Success Factors for Women’s and Children’s Health.
- Paul Farmer et al., “Reduced Premature Mortality in Rwanda: Lessons From Success,” British Medical Journal 346, no. f65 (2013), accessed at www.bmj.com/content/346/bmj.f65.full.pdf+html, on Jan. 12, 2015.
- Overseas Development Institute, Delivering Maternal Health: Why Is Rwanda Doing Better Than Malawi, Niger, and Uganda? (London: Overseas Development Institute, 2012).
- Farmer et al., “Reduced Premature Mortality in Rwanda.”
- Daphrose Nyirasafali, Maternal Mortality Reduction Programme in Rwanda (Kigali, Rwanda: UNFPA, 2010).
- Carl Haub and Toshiko Kaneda, 2014 World Population Data Sheet (Washington, DC: Population Reference Bureau, 2014).
- Overseas Development Institute, Delivering Maternal Health.
- Rwanda Ministry of Health et al., Success Factors for Women’s and Children’s Health.
Globally, an estimated one in four children under age 5 suffer from stunting, a form of malnutrition in which children are shorter than normal for their age.1 In India, almost 62 million children (48 percent) across all income groups are stunted (see figure). Stunting, or chronic malnutrition, is accompanied by a host of problems—weak immune systems, risk of sickness and disease, arrested cognitive and physical development, and a greater risk of dying before age 5.
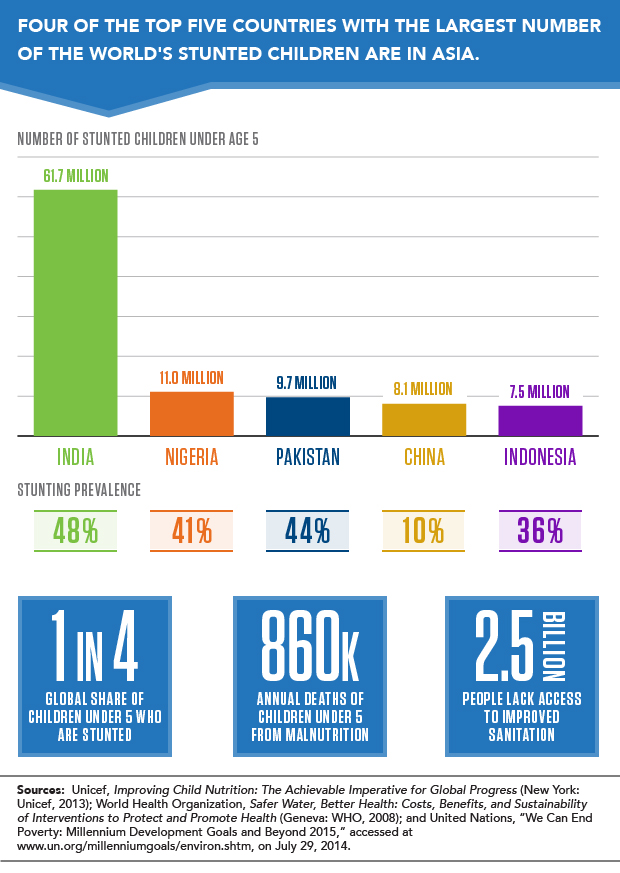
Stunting happens over time and can be caused by inadequate maternal nutrition, poor feeding practices, or substandard food quality as well as frequent infections. The high rate of stunting in India is surprising given its economic growth, especially in contrast to sub-Saharan Africa where GDP is lower.
Sanitation a Potential Contributor to Malnutrition
A recent story in the New York Times explored the link between high rates of child malnutrition in India and the country’s poor sanitation, shedding light on a potential cause of a protracted problem. For India, the issue is not a lack of food, but rather a lack of toilets for its population—one-half of India’s population, at least 620 million people, defecates outside.
The interaction between diarrheal disease and malnutrition is well established. Diarrhea is often caused by a lack of clean water for proper hand-washing. A lack of toilets further exacerbates the problem as feces on the ground contribute to contaminated drinking water and water resources in general.
The World Health Organization estimates that 50 percent of malnutrition is associated with repeated diarrhea or intestinal worm infections from unsafe water or poor sanitation or hygiene.2
Stunting can stem from enteropathy, a chronic illness caused by inflammation that keeps the body from absorbing calories and nutrients. Children who are exposed to open defecation or who don’t have a clean water supply may ingest bacteria, viruses, fungi, or parasites that cause intestinal infection; chronic inflammation in a child’s gastrointestinal track is linked to stunting and anemia, and puts children at risk for poor early childhood development.3
Many organizations have adopted an integrated approach to improve water, sanitation, and hygiene, known as WASH programs. One of the United Nation’s Millennium Development Goals is to halve by 2015 the proportion of the population without sustainable access to safe drinking water and basic sanitation. However, despite progress, 2.5 billion people in developing countries still lack access to improved sanitation facilities.4
Women’s Roles Affect Children’s Nutrition
“The story is not so simple,” says Rhonda Smith, associate vice president for International Programs at the Population Reference Bureau (PRB), who leads PRB’s efforts to reduce malnutrition in pregnant women and children under the RENEW project. According to Smith, several factors contribute to stunting. “Women’s low status in many segments of Indian society can have a significant effect on children’s nutrition. Limited decisionmaking authority means less control over food purchases and less ability to control how food is distributed among family members.”
Indeed, researchers have found that women’s relative bargaining power within the household determined how resources are directed to support feeding practices, prenatal and birthing care, and treatment for illness and immunizations.5 In India, studies found that a higher share of children whose mothers had below primary education or were younger than 20 were stunted, but that children living in female-headed households were less stunted, and that reduced stunting was associated with whether women were able to make decisions to travel outside the home and whether they were able to make decisions about household purchases.6
The Challenges Ahead for India
Diarrhea prevalence drops substantially only if open defecation is completely eliminated.7 Narendra Modi, India’s prime minister, pledged to add 5 million toilets by the end of September of this year.8
Unfortunately, the toilets that have been built in India have sometimes gone unused or have been used to store tools, grain, or building materials.9 Changes in social norms and behaviors must change too. According to Unicef, India has revamped its national sanitation program to focus less on subsidized toilet construction and more on helping the population understand the benefits of toilets. Dean Spears, an economist and visiting researcher at the Delhi School of Economics, writes, “Open defecation is everybody’s problem. It is the quintessential ‘public bad’ with negative spillover effects even on households that do not practice it.”
References
- Unicef, Improving Child Nutrition: The Achievable Imperative for Global Progress (New York: Unicef, 2013).
- World Health Organization, Safer Water, Better Health: Costs, Benefits, and Sustainability of Interventions to Protect and Promote Health (Geneva: WHO, 2008).
- Francis M. Ngure et al., “Water, Sanitation, and Hygiene (WASH), Environmental Enteropathy, Nutrition, and Early Childhood Development: Making the Links,” Annals of the New York Academy of Sciences 1308 (2014): 118-28.
- United Nations, “We Can End Poverty: Millennium Development Goals and Beyond 2015,” accessed at www.un.org/millenniumgoals/environ.shtml, on July 29, 2014.
- Unicef, Gender Influences on Child Survival, Health, and Nutrition: A Narrative Review (New York: Unicef, 2011).
- Monal Shroff et al., “Maternal Autonomy Is Inversely Related to Child Stunting in Andhra Pradesh, India,” Maternal and Child Nutrition 5, no. 1 (2009): 64-74; and Diane Dancer and Ramu Rammohan, “Maternal Autonomy and Child Nutrition: Evidence From Rural Nepal,” Indian Growth and Development Review 2, no. 1 (2009): 18-38.
- Unicef, Water, Sanitation, and Hygiene: 2012 Annual Report (New York: Unicef, 2013).
- “Sanitation in India: The Final Frontier,” The Economist, July 19, 2014.
- Dean Spears, “Child Stunting and Open Defecation: How Much of the South Asian Height ‘Enigma’ Is a Toilet Gap?” (February 2013), accessed at www.ideasforindia.in/article.aspx?article_id=108, on July 30, 2014.
Twenty years after its civil war ended in 1992, Mozambique has made significant progress. Economic growth has remained steady for over a decade. Malaria prevalence in children has declined and households are more protected by insecticide-treated nets or indoor spraying. More than one-half of all childbirths occur in health facilities. And early childhood mortality is declining dramatically, with half as many deaths among children under 5, compared to 14 years ago (see figure).
Early Childhood Mortality Is on the Decline in Mozambique.
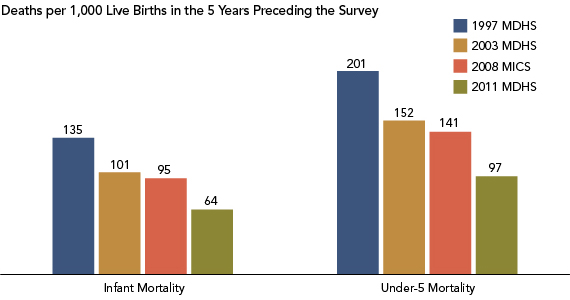
Note: MDHS refers to the Mozambique Demographic and Health Survey; MICS refers to the Multiple Indicator Cluster Survey.
Sources: Instituto Nacional de Estatística, Ministério da Saúde, Maputo, Moçambique, and ICF International, Mozambique Demographic and Health Survey 2011 (Calverton, MD: ICF International, 2013); United Nations Children’s Fund (UNICEF) and Instituto Nacional de Estatística, Maputo, Moçambique, Mozambique Multiple Indicator Cluster Survey 2008-2009 (New York: United Nations Children’s Fund (UNICEF), 2009); Instituto Nacional de Estatistica, Ministerio da Saude, Maputo, Moçambique and ORC Macro, Mozambique Demographic and Health Survey 2003 (Calverton, MD: ORC Macro, 2005); andManuel da Costa Gaspar et al., Instituto Nacional de Estatística, Maputo, Moçambique, and Macro International, Mozambique Demographic and Health Survey 1997 (Calverton, MD: Macro International Inc., 1998).
The country recently released a final report from its 2011 Mozambique Demographic and Health Survey (MDHS), lending evidence to this progress but highlighting areas where gaps remain. Fertility rates are still high (average of 5.9 children per woman), and in fact have risen slightly since the last MDHS in 2003 (5.5 children per woman). Fertility is lower for better-educated and wealthier women, and those living in urban areas.1
Knowledge of modern contraceptive methods is common, yet contraceptive use remains low, and unmet need for family planning is generally high across women of all backgrounds, with one in four married women expressing an unmet need for family planning (meaning they do not want to become pregnant for two years or more but are not using a modern contraceptive method). Mozambique continues to have a high level of early childbearing, affecting over one-third of women ages 15 to 19, although as education levels increase, teen pregnancy is less common. This group has the highest unmet need for family planning: While one quarter use modern contraception, over half still express the desire to limit births. And maternal mortality remains high at 408 deaths per 100,000 live births.2
Getting the Word Out
To help inform decisionmakers about these gaps, PRB was asked, through its IDEA project, to develop a policy communications strategy to disseminate the 2011 MDHS to refocus attention on population, family planning, and health policies and programs. IDEA (Informing Decisionmakers to Act) provides information about family planning and reproductive health to policy audiences around the world. IDEA received support from USAID/Mozambique to partner with the Mozambican Instituto Nacional de Estatistics (INE) that conducted the 2011 survey.
IDEA staff collaborated with the staff from INE and the Mozambique Ministry of Health to develop a set of publications in Portuguese and English for provincial policymakers and other decisionmakers, educators, and journalists. (Several of the publications, in Portuguese, are online and linked below.) These included:
- Mozambique Population Data Sheet with a data table and illustrative graphics on select MDHS findings: fertility and family planning, child health and education, household conditions, malaria, HIV/AIDS knowledge and testing, and gender-based violence.
- Regional brochures for the northern, central, and southern regions with key MDHS findings and trends.
- Thematic brochures on fertility and family planning, maternal and child health, gender, HIV/AIDS, and malaria.
- Teacher’s guide with instructions on interpreting and using the Data Sheet in the classroom to increase statistical literacy.
- Journalist’s guide on using MDHS, adapted from the MEASURE DHS Journalists’ Guide to the Demographic and Health Surveys.
Demand for Materials Is High
On May 2, 2013, the national MDHS launched its findings. Following the launch, the IDEA products were disseminated during provincial-level meetings, sectoral meetings, and one-day media training workshops in 10 provinces and Maputo. At these meetings, INE used the products to raise awareness of areas requiring further attention and investment from local leaders. Toshiko Kaneda, the project leader and a senior research associate at PRB, said of PRB’s role in this process, “A huge amount of effort goes into collecting data, but they (INE) don’t feel like the data get enough use. That’s why a project like ours that tries to promote the use of the data by making the results accessible to policymakers, other decisionmakers, and nontechnical audiences is so important. “
Feedback from these meetings was positive. At least 30 percent of participants gave comments that reflected their intention to further use the data in their work: Requests came for access to more data, district-level disaggregation, and future coverage or content improvements. Kaneda reported, “INE was excited about the excellent feedback they were getting from all the print publications. They said they will be very beneficial as they promote the use of the MDHS results in policy planning, which they are trying to improve at the provincial-level.” Project consultant Marjorie Macieira noted that “INE expressed how helpful to them it was to have PRB participate in the selection and definition of key indicators, and with the actual design and development of the thematic brochures.”
Multiple Uses for MDHS Data
Data from the MDHS, made accessible by PRB, can help decisionmakers and program planners to address health problems. Mozambique is located in southern Africa, the region with the highest prevalence of HIV in the world. More than 10 percent of adults ages 15 to 49 in Mozambique are living with HIV.3 According to the MDHS, neither women nor men have a comprehensive knowledge of HIV/AIDS and its prevention. Three-quarters of men know ways to prevent HIV, such as condom use and limiting sex to one uninfected partner, but only half of women share this knowledge. Risky sexual behavior is common (30 percent of men had two or more sexual partners in the last year before the survey) but few have undergone testing. Young people are a priority group for HIV-prevention activities throughout the region, especially given that early initiation of sexual activity is common: More than three-quarters of women ages 20 to 24 were sexually active before age 18, compared to two-thirds of men.4 The MDHS data can help health educators craft evidence-based programs to address these pressing problems, such as delaying the age of sexual activity initiation as a strategy to reduce the risk of HIV infection among youth.
Journalists, especially those who undergo media training, can use the MDHS data to make the numbers come alive in their stories. Macieira shared, “Another challenge was getting the media’s attention focused on disseminating the 2011 MDHS findings because of the generally less appealing interest of ‘statistical information.’ The media is more likely to cover breaking political developments and will need additional training to get them educated on maximizing use of the MDHS findings in their daily news coverage,” a plan, she noted, that INE already has in process.
References
- Instituto Nacional de Estatística, Ministério da Saúde, Maputo, Moçambique, and ICF International, Mozambique Demographic and Health Survey 2011 (Calverton, MD: ICF International, 2013).
- Instituto Nacional de Estatística, Ministério da Saúde, Maputo, Moçambique, and ICF International, Mozambique Demographic and Health Survey 2011.
- UNAIDS, “HIV and AIDS Estimates 2012 Mozambique,” accessed at www.unaids.org/en/regionscountries/countries/mozambique/, on Oct. 17, 2013.
- Instituto Nacional de Estatística, Ministério da Saúde, Maputo, Moçambique, and ICF International, Mozambique Demographic and Health Survey 2011.
 ">
">
-
- This datasheet also in French and Spanish.
Girls and boys in developing countries are enrolling in secondary school in greater numbers than ever before, giving them knowledge and skills for healthy, productive lives. While this is good news, many young people still face challenges to employment, and they must also navigate serious risks to their health, such as smoking, early marriage and childbearing, or having unprotected sex.
The World’s Youth 2013 Data Sheet provides a comprehensive portrait of the well-being of youth ages 10 to 24 across the globe, including such indicators as the current and projected size of youth populations, educational enrollments, labor force participation, marriage and fertility, and health risks and behaviors.
Key findings include:
Teenage Pregnancy and Childbearing
Around the world, many women ages 15 to 19 are currently pregnant or have already given birth. This scenario is especially true in rural areas, where girls are married young and pressured to start having children immediately. In Zimbabwe, Senegal, and Colombia, more than one in five teenagers from rural areas have begun childbearing. And teenagers from the poorest households are more likely to become pregnant or give birth than those from the wealthiest households. In Zimbabwe, Senegal, Colombia, and Peru, more than one-quarter of teens ages 15 to 19 from the poorest 20 percent of households have begun childbearing. In Peru, the rate of early childbearing is nearly six times greater among those from the poorest households compared to the wealthiest.
Prevalence of Child Marriage
Child marriage, defined as marriage before age 18, is practiced in all regions of the world. This harmful traditional practice not only violates the human rights of girls and young women, but also threatens their health and well-being. Nearly half of all women ages 20 to 24 in South Central Asia and Western Africa were married by age 18, putting them at a higher risk for early pregnancy and maternal disability and death, and limiting their access to education and employment. Although the prevalence of child marriage is lower in other regions, such as Southeast Asia and Western Asia, nearly one in five girls in those two regions was married by age 18. And in the poorest regions of the world—particularly Eastern Africa, Western Africa, and South Central Asia—more than one in 10 girls were married by age 15.
Adolescent Fertility Rates Worldwide
The adolescent fertility rate measures the number of births per 1,000 women ages 15 to 19. Although the number of births among adolescent girls is declining around the world, adolescent childbearing remains common in many countries, particularly in sub-Saharan Africa. Early childbearing poses serious consequences to the health and development of young girls. The risk of maternal death and disability is higher for adolescents than for women in their 20s. At the same time, early childbearing often limits girls’ opportunities for education, training, and livelihood development. Adolescent childbearing is more common in developing countries, where nearly 10 percent of adolescent girls give birth each year, compared to less than 2 percent in developed countries.
Progression to Secondary School
While many countries around the world have seen rapid progress toward universal primary education, ensuring that adolescents start and complete secondary education is crucial to their acquiring the knowledge and skills needed for healthy, productive lives. Progression to secondary school measures the likelihood that children who finish primary school will start their first year of secondary school. In the Philippines, nearly all children progress from primary school to secondary school. In Senegal and Lesotho, fewer than three-quarters of all students start secondary school, with girls less likely to progress compared to boys. While this transition may be more challenging for females than males, young men are also at-risk of leaving school too early. In the Dominican Republic and Mozambique, boys are less likely than girls to start secondary school.
Young People Without Jobs, Education, or Training
Many countries around the world are concerned about young people who are not in education, employment, or training (NEET). While unemployed youth who are in school or receiving training are investing in their future employment prospects and earning potential, NEETs are unemployed and not engaged in education opportunities. When young people are not in contact with the education system or the labor market, they cannot develop key skills for meaningful employment. Across countries with available data, more young women than young men are classified as NEETs. This situation is particularly pronounced in countries like Niger and Pakistan, where more than two of every three young women are NEETs.