 ">
">
The Population Reference Bureau (PRB) is a core partner on the Population Council’s Evidence to End FGM/C: Research to Help Girls and Women Thrive—a UKAID-funded research program to help end female genital mutilation/cutting (FGM/C) within one generation. Our role is to build the consortium’s capacity for research utilization and to develop innovative tools and products to improve how researchers communicate their findings about FGM/C to key decisionmakers.
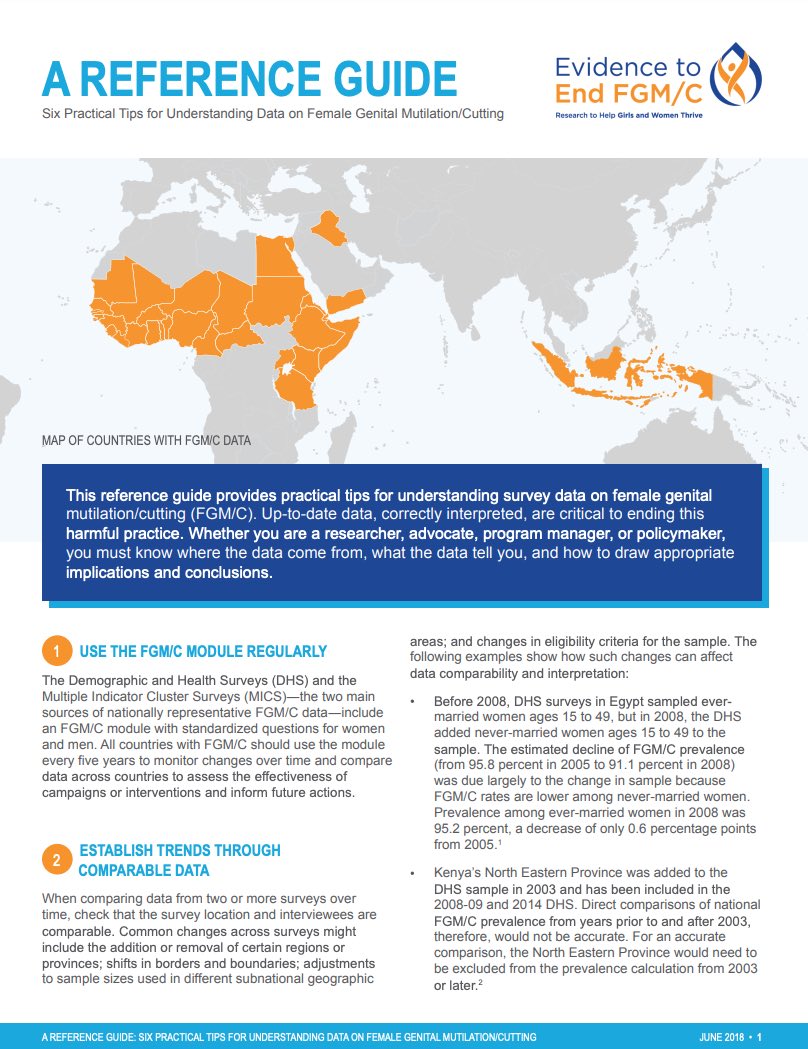
PRB has developed a reference guide titled Six Practical Tips for Understanding Data on Female Genital Mutilation/Cutting. This guide aims to help researchers, advocates, program managers, and policymakers understand, interpret, and use the latest FGM/C data.
Read for tips on:
- Using the FGM/C module regularly.
- Establishing trends through comparable data.
- Being realistic about self-reported data.
- Recognizing that data on daughters have changed.
- Assessing changes in FGM/C rates over time by comparing youngest and oldest cohorts.
- Understanding how the best estimates of girls and women affected by and at risk of FGM/C are derived.


 ">
">
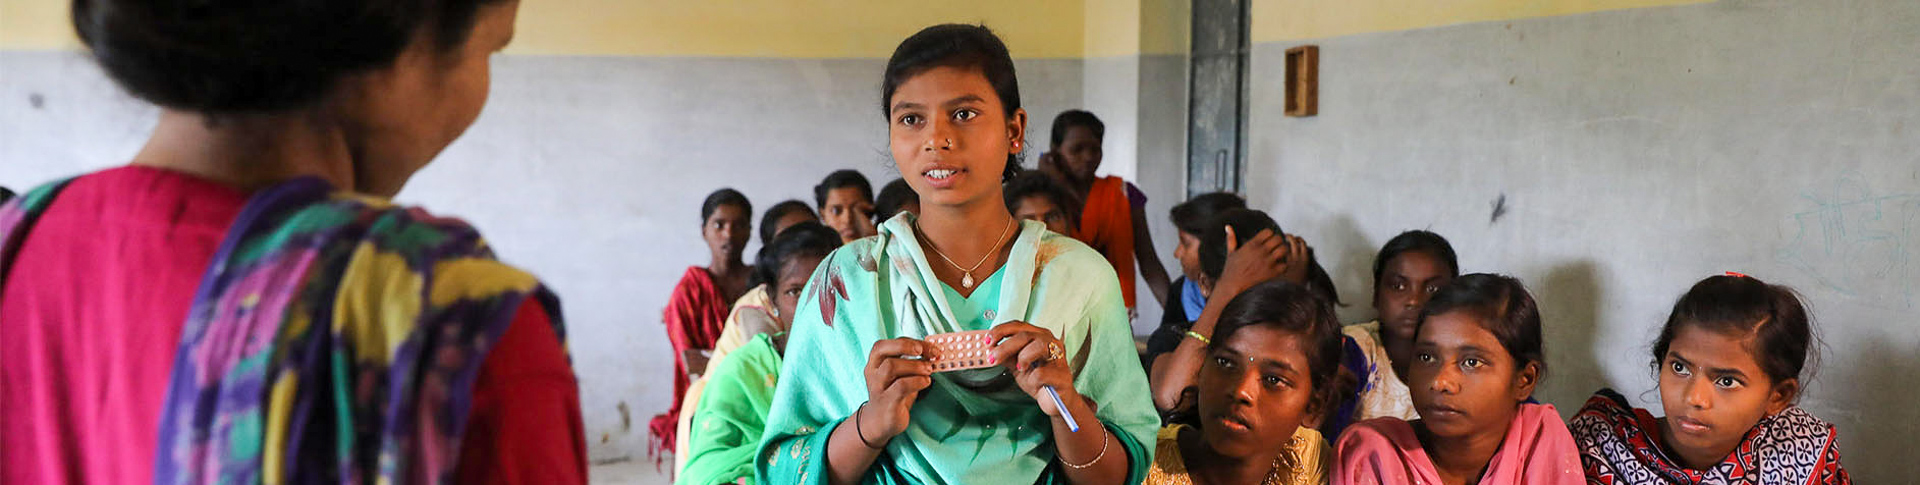
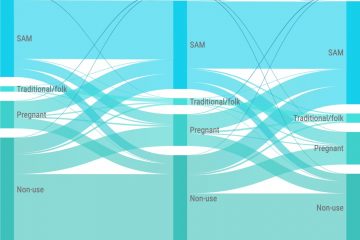
Unmet need for family planning among women ages 15 to 24 is higher than among older women, and meeting their need would significantly reduce unintended pregnancies and maternal deaths.
Advocates, service providers, and governments are increasingly focused on improving access to and use of contraception among young people. To tailor program efforts, it is critical to understand how young women’s access to and use of family planning varies by socioeconomic status and other measures.
PRB’s new Population Bulletin looks at whether demand satisfied for family planning, as a key indicator of universal access to sexual and reproductive health, is equitable among young women ages 15 to 24 in low- and middle-income countries, and to what extent that inequity has changed over time. We consider these questions at the global, regional, and national levels using survey data from 33 countries. Our analysis demonstrates that:
- Inequity in demand satisfied for family planning among young women remains substantial, but is improving over time. We find a strong correlation globally between wealth quintile and the likelihood of a young woman having her demand for modern family planning satisfied. For each increase in wealth quintile (from least to most wealthy), a young woman’s odds of having her demand for modern family planning satisfied increases by 30 percent. The influence of wealth quintile on demand satisfied for family planning among young women is strongest in Eastern Africa, Southern Africa, Western Africa, and Middle East and North Africa. On a positive note, the gap in demand satisfied between the richest and poorest young women has shrunk in most regions.
- Globally and in most regions, education, age, and other factors are at least as strong predictors of demand satisfied for family planning among young women as wealth. At the global level, education, age, and marital status each have at least as strong an impact on the likelihood of demand satisfied for modern family planning as wealth quintile. Controlling for other factors, young women with no education have a 40 percent likelihood of having their family planning demand satisfied, compared to higher likelihoods of above 50 percent among those with secondary education and those with more than secondary education.
- Increases in contraceptive use have been the primary factor driving recent improvements in demand satisfied for family planning among young women, rather than decreases in unmet need. Slightly more than half of countries (17 of the 33 in our sample) demonstrated improvements in both demand satisfied and equity over time. Among this group, most experienced larger proportional increases in the modern contraceptive prevalence rate compared to decreases in unmet need. This finding suggests that an increase in the percentage of young women who use family planning has had a larger effect on demand satisfied than a drop in the proportion of young women who wish to prevent pregnancy but are either unable or unwilling to adopt contraception.
- To overcome inequity among youth, emphasize service provision at the community level. Localized, community- and outreach-based interventions can be most effective in reducing inequities in health by addressing the challenges faced by disadvantaged subgroups in reaching facilities. By focusing on community-level interventions, program designers can ensure that all young women have access to family planning services and pave the way to both more equitable and higher levels of demand satisfied for family planning among youth.


 ">
">
A growing share of Americans are working beyond their 65th birthday, a reversal that began in the mid-1980s. Labor force participation rates for men ages 65 to 69 began to drop in the mid-1960s, bottoming out at 24 percent in 1985, but have risen to about 37 percent in 2017. Among women ages 65 to 69, the labor force participation rate increased from 18 percent in 1964 to 28 percent in 2017.
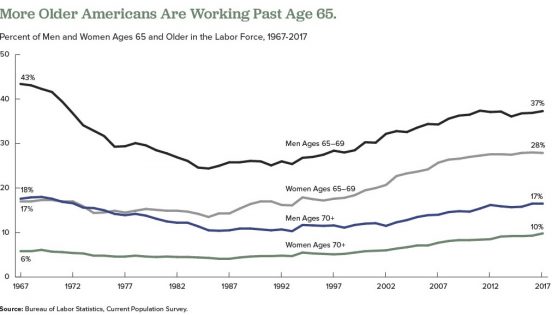
More Older Americans Are Working Past Age 65
Researchers have identified a variety of factors influencing older people’s decisions to postpone retirement over the past 25 years, including the following:
- Increased life expectancy and better health, particularly among those with more education.
- Changes in Social Security program incentives—an increase in the age to receive full benefits, credits for delaying benefit receipt, and a reduced tax penalty for working while receiving benefits.
- The elimination of mandatory retirement ages in most industries.
- A shift in employer-sponsored retirement plans—defined-benefit pensions that provide guaranteed payouts have largely been replaced by 401(k) plans with payouts that depend on how much the retiree saves and how well the investments do.
- Rising education levels—more-educated people are known to remain employed longer.
- Growing numbers of white-collar jobs, which older people are more physically able to perform.
- Declining availability of employer-provided health insurance for retirees.
- More women reaching older ages with longer work histories than previous generations.
- Financial losses and debt related to the Great Recession (2007 to 2009) putting pressure on older workers to stay on the job longer.
- The rising availability of part-time positions—In 2016, about 39 percent of employed adults ages 65 and older worked less than 35 hours per week, according to the U.S. Bureau of Labor Statistics.1
But researchers disagree on whether the upswing in the share of employed older people will continue as more members of the baby boom generation reach traditional retirement ages.
Some analysts argue that most of the factors listed above have played themselves out. Alice Munnell of Boston College points out that defined-benefit pensions and employer-provided retirement health insurance are almost entirely absent from the private sector; educational attainment has plateaued among the those now approaching retirement age; gains in health and longevity related to declines in smoking and improved medical care are being offset by increases in obesity; and blue-collar jobs have been rare for a generation.2
But other researchers argue that high levels of debt remain a powerful force that may contribute to more people postponing retirement. Annamaria Lusardi of George Washington University, Olivia Mitchell of University of Pennsylvania, and Noemi Oggero of the University of Turin find a “dramatic increase” in the amount of debt carried by older Americans nearing retirement ages, mainly the result of “having purchased more expensive homes with smaller down payments than previous generations.”3
They use data from the nationally representative Health and Retirement Study (HRS), an ongoing survey of older Americans, and the National Financial Capability Study (NFCS), a national sample of adults surveyed on financial planning and decisionmaking. Their analysis focuses on the debt of Americans ages 56 to 61 in 1992, 2004, and 2010.
They show that the median debt-to-income ratio (the percentage of income that goes to debt payments) climbed from 14 percent in 1992 to 45 percent in 2004, and to 50 percent in 2010. The median amount of debt rose sharply between 1992 and 2004, from $6,800 to $31,200 in 2015 dollars.
Their findings also indicate that older adults ages 62 to 66 in 2010 carried more debt than their counterparts from earlier years, though they carried less debt than adults ages 56 to 61 in 2010. “While people’s financial situation does seem to improve with age, the older group is still financially distressed,” they write. “Close to half (47 percent) of those ages 62 to 66 are worried about running out of money in retirement and just over half (55 percent) had planned for it [their retirement].”
In another study using HRS and NFCS data, Lusardi and Mitchell find that women in their 50s and 60s in recent generations are more likely to say they plan to work to older ages than their peers from the early 1990s.4 Respondents with plans to delay retirement tend to have higher levels of education, higher divorce rates, and fewer children, but “household finances also play a key role” in retirement decisions, they report. “Older women today have more debt than previously and are more financially fragile than in the past,” they write.
References
1 U.S. Bureau of Labor Statistics, “Table 2. Employed Full- and Part-Time Workers by Disability Status and Age, 2016 Annual Averages,” last modified June 21, 2017, accessed at www.bls.gov/news.release/disabl.t02.htm, on Feb. 14, 2018.
2 Alicia Munnell, “The Average Retirement Age—An Update,” Center for Retirement Research, Boston College, No. 15-4 (March 2015).
3 Annamaria Lusardi, Olivia S. Mitchell, and Noemi Oggero, “Debt and Financial Vulnerability on the Verge of Retirement,” National Bureau of Economic Research Working Paper No.23664 (Aug. 2017).
4 Annamaria Lusardi and Olivia S. Mitchell, “Older Women’s Labor Market Attachment, Retirement Planning, and Household Debt,” National Bureau of Economic Research Working Paper No. 22606 (Sept. 2016).


By 2030, when the last of the large baby boom generation (born 1946 to 1964) has reached their mid-60s, more than 21 percent of the U.S. population is projected to be age 65 or older—up from about 15 percent in 2016.
The greying of America increases the costs of public programs for older adults and shifts the balance between working people supporting those programs and retirees receiving benefits. The old-age support ratio—the number of working-age adults ages 18 to 64 for every adult age 65 or older—is on course to shrink dramatically from 4.1 in 2016 to 2.8 by 2030. To relieve this fiscal pressure, policymakers continue to discuss new financial incentives to encourage people to postpone retirement, such as further raising the eligibility age for Social Security (currently age 67 for those born after 1960) and Medicare (now age 65).
Working longer can reduce public spending and enable some older workers to enter retirement with more financial security. Estimates based on past health trends suggest that most U.S. older adults can work an extra two years before retiring.1But a growing body of research suggests that baby boomers in their 50s and 60s are in poorer health—with more chronic disease and disability—than earlier generations at the same ages, potentially affecting their capacity to work longer.
Evidence of Worsening Health
Older adults ages 51 to 61 had a higher prevalence of six out of eight chronic conditions—including 37 percent higher diabetes prevalence—in 2004-2010 than their peers in 1992-1998, a 2016 study finds.2 Hiram Beltrán-Sánchez of the University of California-Los Angeles, Marsha Jiménez of Brown University, and S.V. Subramanian of Harvard University analyzed self-reported chronic disease in the 1990s and 2000s using data from the nationally representative U.S. Health and Retirement Study (HRS). Based on their findings, they argue that older adults nearing traditional retirement ages appear more burdened by health conditions than several decades ago.
In another recent study, a University of Southern California research team finds Americans are living longer with more disability. Eileen Crimmins, Yuan Zhang, and Yasuhiko Saito examined life expectancy trends and disability rates in the 40-year period from 1970 to 2010.3They show that the average total lifespan increased for both men and women, but so did the proportion of time spent living with a disability. For people ages 65 and older, they identify a “compression of morbidity”—that is, a reduction in the proportion of life spent with disability. However, people in their prime working years (ages 20 to 64) experienced increases in the proportion of life spent with a disability. The researchers argue that there is “little evidence” of improvements in health “that would support increasing the age at retirement.”
In addition, a 2012 study that synthesized the results of five nationally representative surveys finds increasing disability among those ages 55 to 64 between 2000 and 2008 (a group that included the oldest baby boomers).4 During the same period, disability levels continued to decline among the oldest Americans (ages 85 and older) and held steady among those ages 65 to 84.
Linda Martin of the RAND Corporation, and Robert Schoeni of the University of Michigan also document rising disability levels between 1997 and 2010 among middle-age and older Americans (ages 40 to 64).5 Their analysis, based on the nationally representative National Health Interview Survey data, identifies a link between increasing obesity and rising disability.
Martin and Schoeni take this line of research further, teaming up with HwaJung Choi of the University of Michigan for a 2016 study focusing on 55-to-69-year-olds using HRS data for 1998 to 2010.6 They find no improvement in levels of physical functioning and activity limitations during the period, and some evidence of worsening. They show that obese individuals face a greater likelihood of having physical limitations. Although baby boomers are less likely to smoke, have emphysema, or have heart attacks, they are more likely to be obese or have diabetes or high blood pressure than the previous generation at similar ages, they report.
Obesity is a risk factor for a variety of chronic conditions; it may also increase the likelihood of early retirement due to disability. Using HRS data, Francesco Renna and Nidhi Thakur of the University of Akron find that men and women under age 65 who were obese in 1992 were more likely to have a disability and retire early by 2002.7
“Obesity can largely impact labor market decisions directly through impairment of bodily functions and indirectly by being a risk factor for various diseases like hypertension, arthritis, etc.,” they write. About two in five Americans (43 percent) in their 40s and 50s were obese in 2015-2016, and thus face an increased risk of retiring early because of a disability or poor health.8
Examining Health Trends by Generation
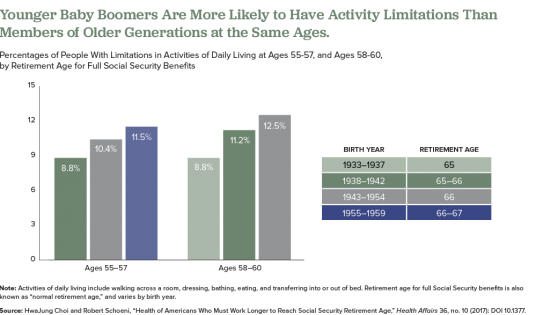
In a 2017 study, Choi and Schoeni examined trends in both physical limitations and cognitive impairment to compare the health of adults nearing retirement by generation.9 They find that adults in their late 50s today are in poorer health than their parents’ generation was at the same age, even though the younger group will have to work longer to collect full Social Security benefits.
For this study, they used HRS and National Health Interview Survey (NHIS) data and divided older Americans into five groups based on the age at which they are eligible to collect full Social Security retirement benefits: those born in 1937 or earlier (age 65); those born 1938 to 1942 (between ages 65 and 66); those born 1943 to 1954 (age 66); those born 1955 to 1959 (between ages 66 and 67), and those born in 1960 to 1962 (age 67).
They find that the younger groups had higher shares of people who had at least one limitation on their ability to perform a basic daily living task by themselves, such walking across a room, dressing, bathing, eating, and transferring into or out of bed (see figure).
Also, they find that those born later tended to have higher rates of poor cognition, such as impaired memory and thinking ability, in their 50s compared with earlier generations at a similar age. Also, at age 50, people in the youngest group (born 1960 to 1962) were more likely to rate their own health as “fair” or “poor” than were people in the middle-three age groups when they were the same age, they report.
The researchers suggest that the increase of workers in their 50s and 60s who are in poor health will create significant challenges for them and their employers, including more people applying for Social Security disability payments. “Given the recent changes in health among the cohorts now approaching typical retirement age, further increases in the normal retirement age would place a substantial and disproportionate burden on these cohorts,” they argue.
The health of Americans in their 50s and early 60s today will shape labor force participation rates among the older population in the future. Understanding and monitoring these trends will be key as policymakers consider incentives to work longer and plan for future increases in the cost of public programs for older people.
 ">
">
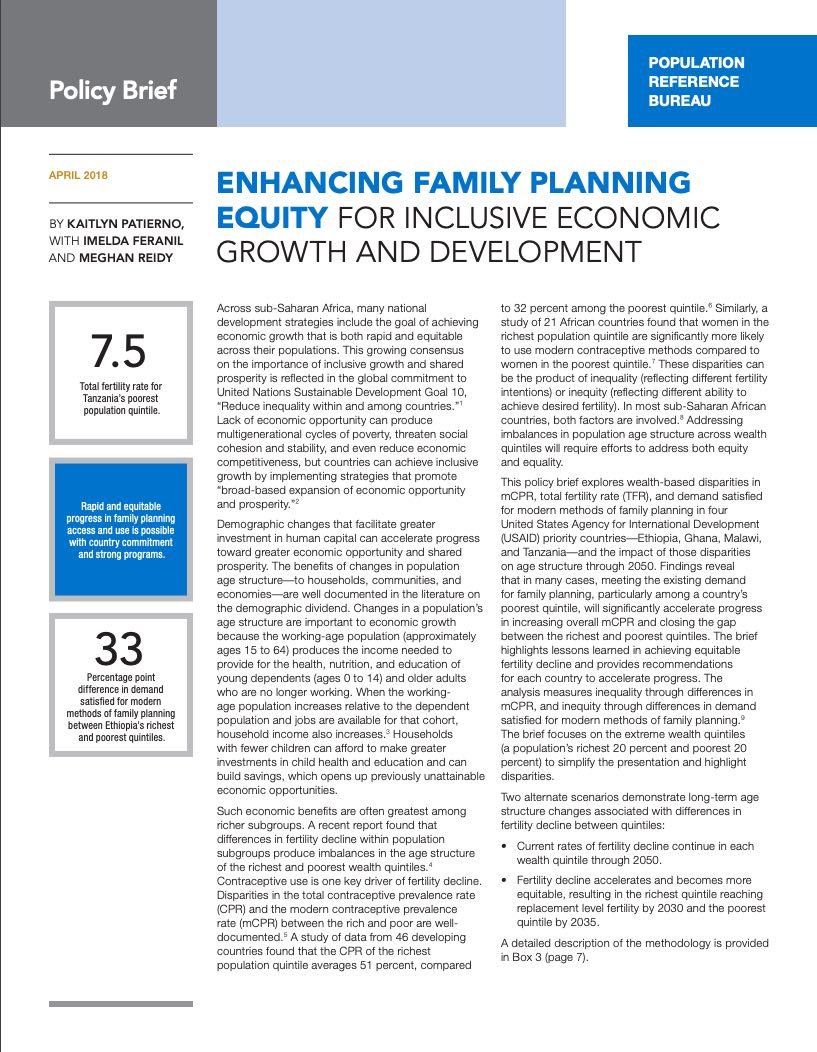
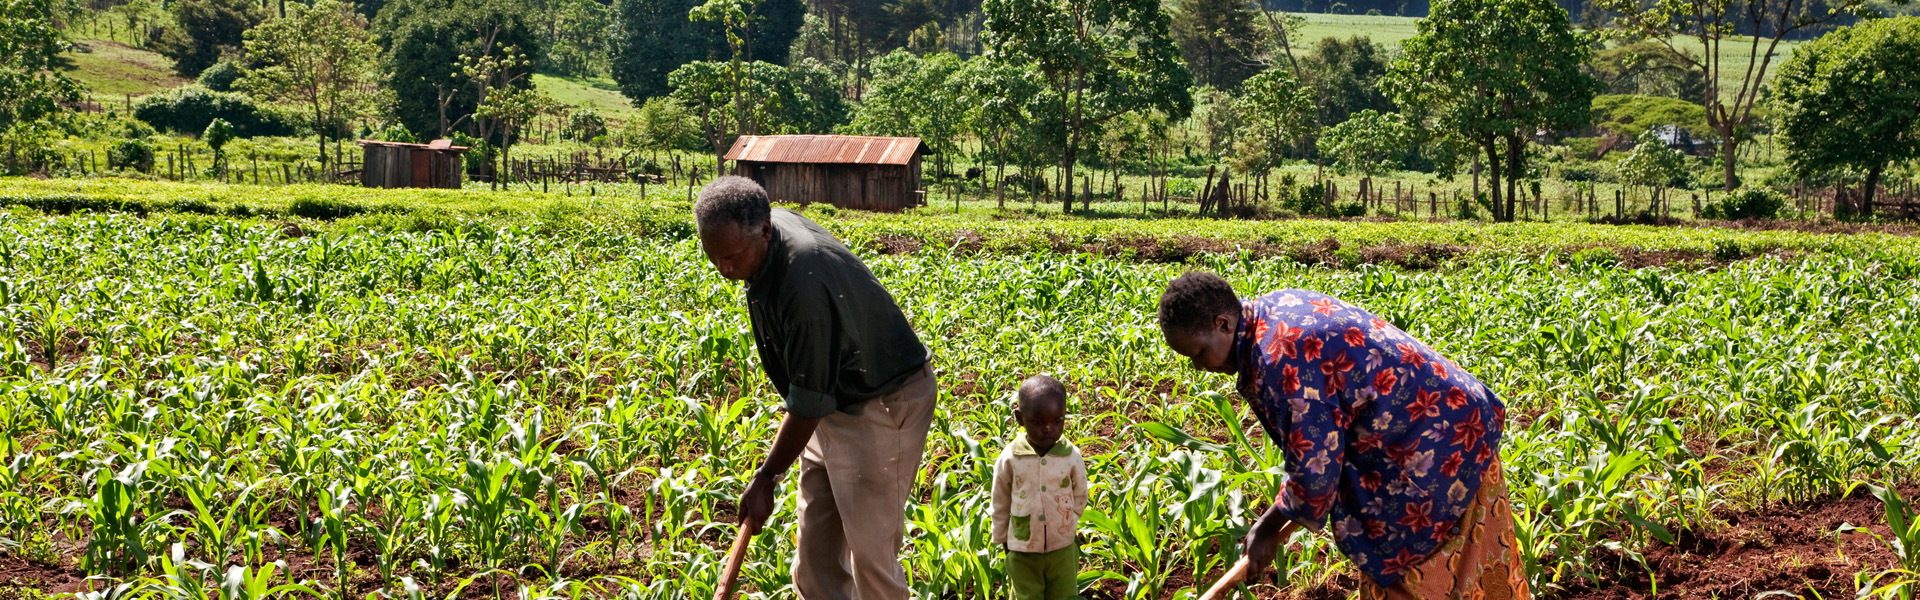
Across sub-Saharan Africa, national development strategies have established the goal of achieving economic growth that is both rapid and equitable across a population. Efforts to promote shared prosperity will be strengthened by demographic changes that facilitate greater investment in human capital. Households with fewer children can afford to make greater investments in child health and education and can build savings. Such benefits are often greatest among richer subgroups.
Differences in fertility decline produce imbalances in the age structure of a country’s richest and poorest wealth quintiles. Disparities in contraceptive use—a key driver of fertility decline—between the rich and poor are well-documented. These disparities can be the product of inequality (reflecting different fertility intentions) or inequity (reflecting different ability to achieve desired fertility). In most sub-Saharan African countries, both factors are involved.
This policy brief explores wealth-based disparities in the modern contraceptive prevalence rate, total fertility rate, and demand satisfied for modern methods of family planning in four United States Agency for International Development priority countries—Ethiopia, Ghana, Malawi, and Tanzania. It explores the impact of those disparities on the age structure of the richest and poorest wealth quintiles through 2050 and highlights lessons learned in achieving equitable fertility decline and recommendations for each country to accelerate progress. While the degree to which countries prioritize family planning varies, ensuring that the benefits of smaller families are available to households regardless of socioeconomic status can accelerate progress toward inclusive economic growth and shared prosperity. All countries striving for such growth should prioritize reducing wealth-based fertility disparities.


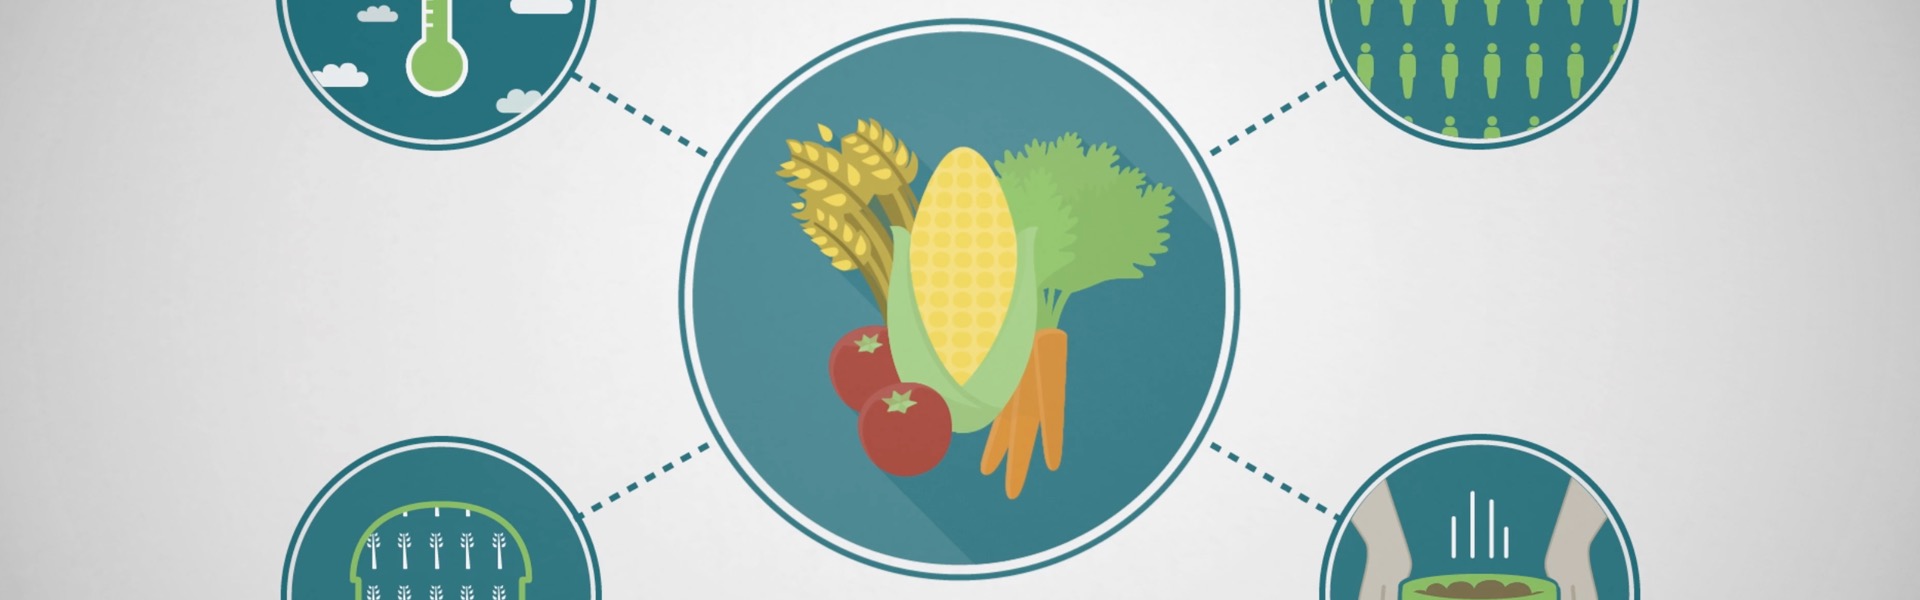
Evaluations of Population, Health, and Environment (PHE) programs have found varying degrees of effectiveness in improving human health and biodiversity outcomes. PHE approaches integrate family planning with other health and environmental interventions, with the intention of addressing the challenges that link all three sectors in a holistic manner. PHE approaches may be effective at improving food security and nutrition through their family planning components, which has been shown to improve both, but little research has been done to examine how improved food security and nutrition may impact the environment and biodiversity conservation.
Improving Food Security and Nutrition Through Integrated Approaches
To strengthen its own PHE pilot projects and further examine these links, the Africa Biodiversity Collaborative Group (ABCG) conducted a literature review and shared their findings in this Africa PHE webinar. Speakers Jimmiel Mandima (African Wildlife Foundation) and Nathalie Simoneau (World Wildlife Fund) shared that despite robust studies on the interactions between population, health, and environment, few PHE projects systematically monitor and measure the impacts of nutrition and food security on biodiversity and health outcomes. Some projects, however, do show evidence that their work improves biodiversity conservation through activities that promote sustainable agricultural techniques, livelihood diversification, conservation agriculture, and other interventions.
More information about the literature review findings, best practices for integrating nutrition and food security interventions into existing PHE projects, and recommendations for incorporating cross-sector indicators in integrated projects is available in the report, “Exploring Cross-Sector Linkages Between Population, Health, Environment, Nutrition, and Food Security: A Review of Best Practices and Lessons Learned.”
This webinar is part of the Africa PHE quarterly webinar series implemented under the Policy, Advocacy, and Communication Enhanced for Population and Reproductive Health (PACE) Project. For regular updates about PHE news, opportunities, resources, and other events, subscribe to the monthly Africa PHE Updates newsletter online and follow @AfricaPHE on Twitter.
“Integrating Population, Health, and Environment for Sustainable Development in Kenya” is an ENGAGE presentation that serves as an advocacy tool to promote integrated population, health, and environment (PHE) approaches, and the value of family planning/reproductive health (FP/RH) investments by decisionmakers in health and nonhealth sectors, such as natural resource management and conservation.
Integrating Population, Health, and Environment for Sustainable Development in Kenya
- English Video: 26 minutes (MP4: 284MB)
- English Video without narration (ZIP: 206MB)
Kujumuisha Idadi ya Watu, Afya na Mazingira kwa Maendeleo Yanayotekelezwa Nchini Kenya
- Swahili Video: 26 minutes (MP4: 294MB)
- Swahili Video without narration (ZIP: 207MB)
- Swahili Script ( PDF:460KB)
- Swahili Presentation Guide (PDF:4MB)
- Swahili Key Messages (PDF:3MB)
- Standard Swahili ENGAGE Country User Guide (PDF:489KB)
- English Script ( PDF:669KB)
- English Presentation Guide (PDF:3.1MB)
- English Key Messages (PDF:2.9MB)
- Standard ENGAGE Country User Guide (PDF:624KB)
The presentation highlights many of Kenya’s development successes, including the national climate change strategy and national population policy. Breaking down complex concepts and using nontechnical language, the presentation shows the connections between people’s access to FP/RH information and services, their health, and their reliance on natural resources. The presentation connects the impacts of FP/RH access for households, communities, and the country, drawing on examples of successful PHE efforts in Kenya.
Stakeholders from diverse sectors within Kenya will use this resource to promote a policy dialogue about the critical role of population dynamics with health and the environment, and the ways that investments in FP/RH can propel progress towards Kenya’s many development goals. The presentation includes recommendations for civil society, and national and county leadership.
“Integrating Population, Health, and Environment for Sustainable Development in Kenya” is available with English and Swahili voiceovers and in an unnarrated format. It can be downloaded from the PRB website or viewed via PRB’s YouTube channel. On the PRB website, the video is accompanied by a key messages handout and a user’s guide, which offer guidance on how to effectively deliver the presentation.
This ENGAGE presentation was developed by the PACE Project in collaboration with Kenya’s National Council for Population and Development (NCPD) and an ENGAGE task force made up of Kenyan experts in the fields of health, FP/RH, conservation, and PHE.
With funding from the U.S. Agency for International Development, PACE—Policy, Advocacy, and Communication Enhanced for Population and Reproductive Health (PACE)—increases support among policy audiences for effective health and population programs around the world. By increasing the flow of accurate, understandable information about population, family planning, and reproductive health to policy audiences, PACE enhances efforts carried out by civil society, the public sector, the development community, and donors. Under PACE and previous projects, PRB has developed a series of dynamic multimedia ENGAGE presentations to engage global leaders and country-level policymakers in issues related to family planning, reproductive health, and other key development issues.
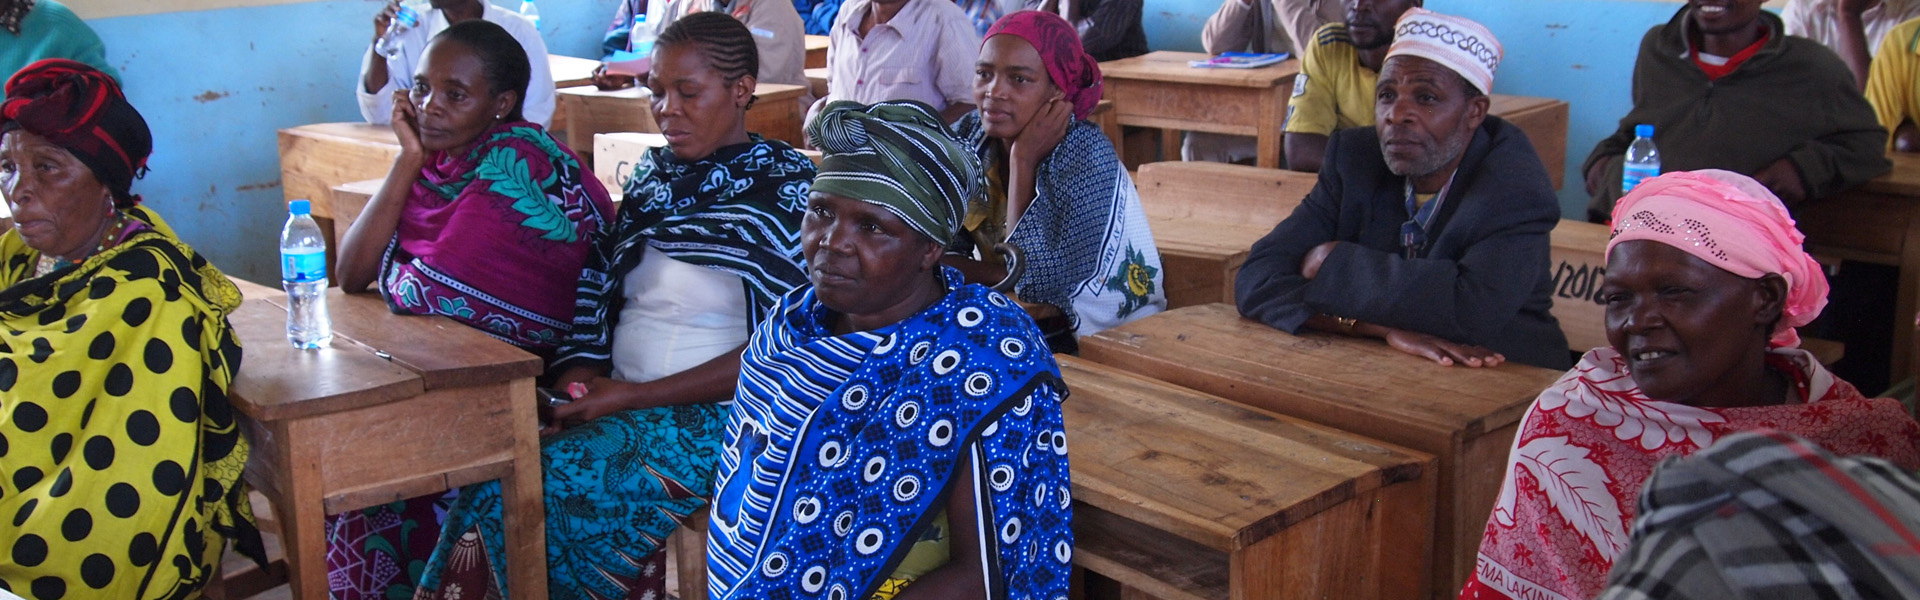
Collecting, analyzing, and using gender-related indicators in projects is critical to addressing many of the underlying challenges that communities around the world face, particularly in integrated Population, Health, and Environment (PHE) projects. PHE projects are often located in rural areas where development challenges can be pronounced. Still, implementers of field-based projects do not always understand how gender affects their project communities and outcomes, or how to go about addressing the impacts of gender dynamics.
This Africa PHE webinar was hosted by Smita Gaith (policy analyst, PRB), who was joined by guest speakers Kathryn Farley (research associate, International Center for Research on Women (ICRW)), Craig Leisher (director of monitoring and evaluation, The Nature Conservancy), and Dorah Taranta (project manager, Health of People and Environment—Lake Victoria Basin Project (HoPE-LBV), Pathfinder International). The guest speakers discussed the importance of measuring and addressing gender in field-based projects, and gave successful examples.
Gaith introduced viewers to the PHE approach, which addresses family planning/reproductive health (FP/RH) and primary health care services alongside a variety of environmental interventions, such as conservation or livelihoods. Evaluations of some projects have found that they improve health and well-being of women in a variety of ways.
Following this introduction, Kathryn Farley introduced viewers to the concept of gender-responsive monitoring and evaluation (M&E). Farley described how identifying differences between men and women in ideas, attitudes, needs, and opportunities at a project’s outset; tracking how project interventions affect men and women differently; and exploring whether the program leads to changes in gender relations all support gender-responsive M&E. Farley reiterated the importance of thinking about gender early and often and explained that even if a project did not consider gender fully at the outset, it is never too late. Thinking about gender at each stage of the project, she said, ensures gender-responsive program design and robust data. Using indicators from the Social Impact Measurement System—which was created by ICRW and the Global Alliance for Clean Cookstoves—Farley also introduced listeners to innovative ways to measure social and economic empowerment. Drawing upon a case study of a social enterprise, listeners were able to see how Farley’s presentation applied to a real intervention.
Craig Leisher emphasized promoting mixed-gender decisionmaking and collecting sex-disaggregated data. According to Leisher, every PHE project should aspire to do both. Using examples from business, Leisher described a wide body of research examining gender diversity in the private sector and in conservation. For example, locally managed forests in India had an average 10 percent greater forest cover when two or more women were on the management board, compared to those with one or no women on the board. These studies were part of the impetus for Leisher’s own research, which examines how the gender composition of forestry and fishery groups affect resource governance and conservation outcomes. According to Leisher, gender diversity improves conflict resolution, reduces high-risk strategies, balances leadership skills, and improves the pool of talent.
Finally, Dorah Taranta presented a before-and-after case study of the HoPE-LVB project community in Kenya and Uganda. While the goals of HoPE-LVB were related to biodiversity conservation and access to FP and sexual and RH services, the project recognized that gender disparities would affect the project’s success. For example, at baseline, men and women were not participating equally in community or household decisions, including decisions about RH/FP and governance of local natural resources. Taranta explained that gender-sensitive interventions were woven throughout various health and environmental interventions to solve these challenges, such as drawing parallels between healthy spacing of children and healthy farming practices, and targeting women and couples with those messages. Now, more women are in leadership roles and engaged in environmentally friendly income-generating activities; men are more involved in health decisions; girls have more educational opportunities; and household dynamics and relationships are improved.
A brief question and answer session followed the presentations. Viewers were interested in cross-cultural norms: for example, whether measurements of empowerment and women’s agency are cross-cultural, and how to respect cultural norms while also trying to change gender norms. People new to PHE were also curious about why the PHE approach might be ideal for addressing gender. According to Leisher and Taranta, integrated projects address multiple aspects of people’s daily lives, providing more opportunities to impact gender indicators, and offering more entry points to talk about gender with a wider variety of people (for example, with groups of fishermen).
This webinar is part of the Africa PHE quarterly webinar series implemented under the Policy, Advocacy, and Communication Enhanced for Population and Reproductive Health (PACE) Project. For regular updates about PHE news, opportunities, resources, and other events, subscribe to the monthly Africa PHE Updates newsletter online and follow @AfricaPHE on Twitter.
 ">
">
With Americans living longer and the large baby boom generation reaching ages 65 and beyond, the sheer numbers of people with conditions of old age—including Alzheimer’s disease and other dementias—are expected to rise dramatically in coming years. But there is some potentially good news: The share of the population with dementia may have fallen over the past 25 years—likely the result of better brain health related to more schooling and aggressive treatment of high blood pressure and diabetes.
This report explores the evidence of a decline in dementia and the trends that may shape the future prevalence of this debilitating condition—focusing on recent work by researchers supported by the National Institute on Aging (NIA).
It describes what we know (and do not know) about dementia patterns, examining known risk factors and vulnerable groups. This research can guide policymakers and public health professionals as they plan for an aging population and design strategies to address health and lifestyle factors related to dementia risk.
 ">
">
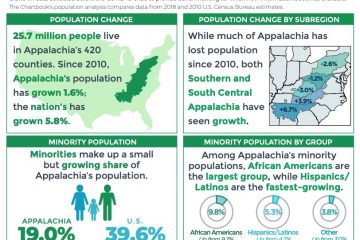
Appalachia’s unemployment and poverty rates remain above levels seen before the economic downturn of 2007-2009, suggesting an incomplete economic recovery, especially in many of the Region’s most rural counties, according to a new Population Reference Bureau (PRB) report for the Appalachian Regional Commission.
The Appalachian Region: A Data Overview From the 2011-2015 American Community Survey—co-authored by Kelvin Pollard, PRB senior demographer, and Linda A. Jacobsen, PRB vice president of U.S. Programs—compares newly released American Community Survey data for 2011-2015 with 2006-2010 data to show trends in income, employment, and other indicators at the regional, subregional, state, and county levels. The Region encompasses 205,000 square miles along the Appalachian Mountains from southern New York to northern Mississippi, including portions of 12 states and all of West Virginia.
Although Appalachia’s 2011-2015 unemployment rate matched the national average of 6.9 percent, it was still slightly higher than in 2006-2010. In addition, unemployment varied widely across the Region. For example, unemployment was less than 5 percent in 39 counties, with 29 of them located in New York, Pennsylvania, Virginia, and West Virginia—the states whose Appalachian sections had the lowest jobless levels. Conversely, the jobless rate was at least 10 percent in 54 counties—42 of which were outside metropolitan areas and 48 of which were in Central, South Central, and Southern Appalachia.
The report’s authors point to signs of a connection between unemployment and educational attainment: In 52 of the 54 Appalachian counties with double-digit unemployment, the share of 25-to-64-year-olds with at least a high school diploma was below the national average of 88 percent; in 27 of these counties, the share was below 80 percent.
During the 2011-2015 period, just 23 percent of adults ages 25 and over in Appalachia had at least a bachelor’s degree, which was seven percentage points lower than in the nation as a whole. The share was lower than the national average in 399 of the Region’s 420 counties. In the Appalachian sections of six states (Kentucky, Maryland, Mississippi, Ohio, Virginia, and West Virginia), the share with a bachelor’s degree or more was at least 10 percentage points below the national average.
However, the authors note that the share of adults with a four-year degree was two percentage points higher in 2011-2015 than in 2006-2010, and the share with at least a high school diploma rose three percentage points during the period, suggesting a continued trend toward greater educational attainment in the Region.
Since 2006-2010, the share of Appalachian residents in poverty (incomes below $24,036 for a family of two adults and two children in 2015) has risen 1.5 percentage points to 17.1 percent in 2011-2015. Poverty increased throughout the Region—in all subregions and among both rural and urban counties. The rise in poverty rates was especially high (more than two percentage points) in the Appalachian portions of Georgia, Maryland, North Carolina, and South Carolina.
Every age group under age 65 experienced an increase in poverty: Child poverty in Appalachia rose almost three percentage points (to 24 percent), and poverty among working-age adults increased nearly two percentage points. Although the overall rise in the poverty rate among Appalachian young adults (ages 18 to 24) of 1.2 percentage points was less than the national average of 1.8 percentage points, it was significantly higher in some parts of Appalachia—more than three percentage points higher in the Appalachian sections of Maryland and Virginia; and more than four percentage points greater in Appalachian North Carolina.
Overall, Appalachia’s population grew less than 2 percent between the two periods, less than half the national average. Growth was even slower in large parts of the Region: The Appalachian sections of Kentucky, New York, Ohio, Pennsylvania, and Virginia have actually lost population since 2006-2010.
Appalachia’s residents are older, on average, and less racially and ethnically diverse than the U.S. population as a whole, but these and other demographic, health, and socioeconomic patterns vary widely within the Region, the report shows.
The full report includes detailed tables and county-level maps, covering state- and county-level data on population, age, race and ethnicity, housing occupancy and tenure, education, labor force, employment and unemployment, income and poverty, health insurance coverage, disability status, migration patterns, and veteran status.