Toshiko Kaneda
Technical Director, Demographic Research


Although Appalachia’s residents of nearly all ages have been more likely to have health insurance than other Americans in recent years, the Region may be more vulnerable to the health and schooling impacts of the coronavirus pandemic due to larger shares of elderly and disabled residents and lower levels of computer and broadband access.
The Appalachian Region: A Data Overview From the 2014-2018 American Community Survey (51 MB), a Population Reference Bureau (PRB) report for the Appalachian Regional Commission, provides a comprehensive picture of social and economic conditions in Appalachia prior to the coronavirus pandemic. These data can help researchers and policymakers assess the pandemic’s potential implications for the Region.
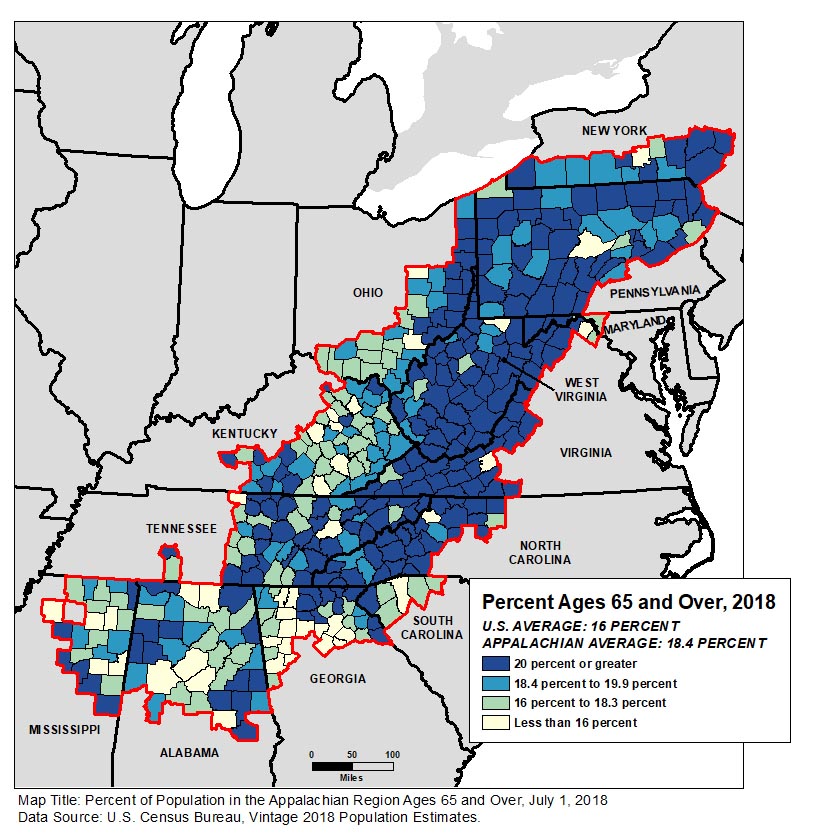
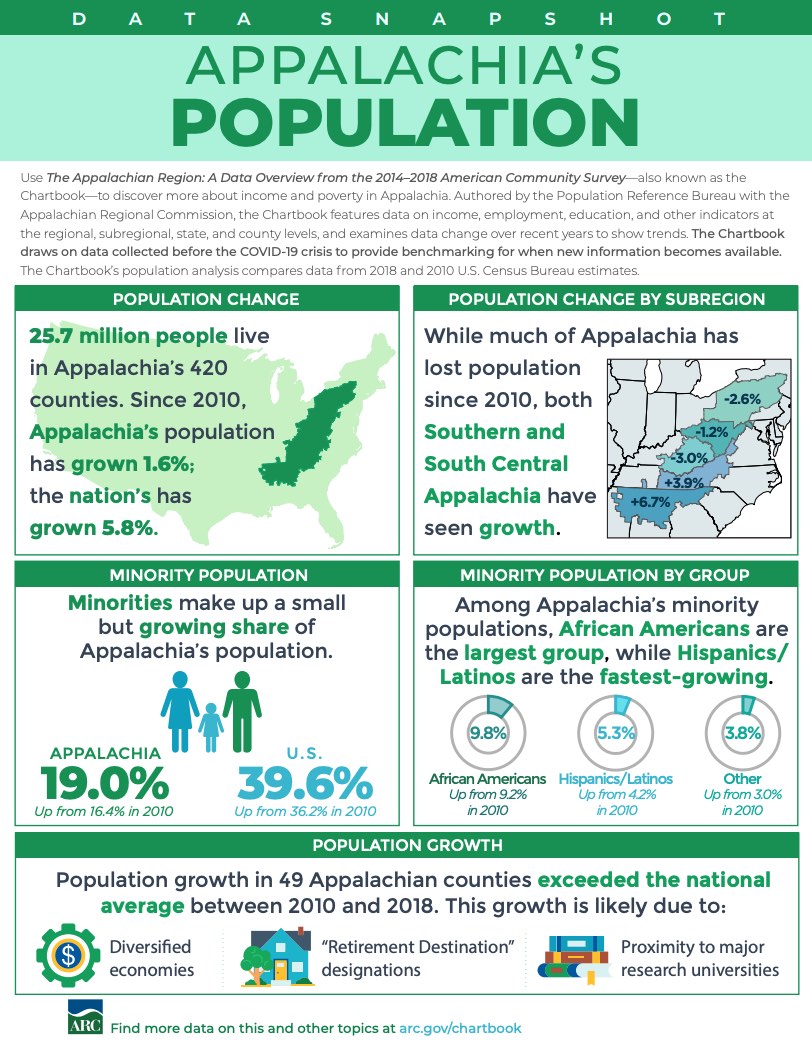
People ages 65 and older made up 18.4% of Appalachia’s population—more than two percentage points above the national average. The share exceeded 20% in more than half of the Region’s counties (see Figure 1).
Among all age groups, the share of Appalachian residents who reported a disability (difficulty with hearing, vision, cognition, walking or climbing, self-care, or independent living) in 2014-2018 was above the national average—with the widest gap among 35- to 64-year-olds (more than four percentage points: 17.1% in Appalachia versus 12.8% nationwide).
“People ages 65 and over and those with underlying health conditions are considered among the groups most vulnerable to serious complications related to the coronavirus; if the virus becomes widespread in Appalachian communities with the largest share of older adults, they may risk high illness and death rates,” says Kelvin Pollard, PRB senior demographer and report co-author.
Just over 84% of Appalachian households had access to a computer device, nearly five percentage points below the national average. The share of households with broadband access, at 75%, was likewise five points below the national average. The report found that the digital divide was particularly acute in Appalachia’s most rural communities: three in 10 rural Appalachian households lacked internet access.
“With most schools closed due to the coronavirus pandemic, this rural digital divide has made online education and maintaining learning extremely challenging,” according to report co-author Linda A. Jacobsen, PRB’s vice president for U.S. Programs.
The report also compares Appalachia’s 107 rural counties (that is, counties that are neither part of nor adjacent to a metropolitan area) to the 840 rural counties outside the Region. It shows that rural Appalachia lagged behind the rest of rural America on a variety of measures such as educational attainment, household income, population growth, and labor force participation.
However, residents of rural counties in Appalachia were more likely than residents of rural counties outside the Region to have health insurance coverage in the 2014-2018 period—both among all residents and among young adults ages 26 to 34 where noncoverage rates were highest.
But disability rates and poverty rates were also significantly higher in rural Appalachia than in other parts of rural America (see Figure 2). Disability rates in Appalachia were higher in every age group, with a six-percentage point gap among those ages 35 to 64 and ages 65 and older.
| wdt_ID | Population | Appalachian Rural | Non-Appalachian Rural |
|---|---|---|---|
| 1 | With a Disability | 20 | 16 |
| 2 | Adults 18-64 With a Disability | 18 | 14 |
| 3 | Adults 35-64 With a Disability | 23 | 17 |
| 4 | Adults 65+ With a Disability | 44 | 38 |
| 5 | In Poverty | 22 | 16 |
| 6 | Children in Poverty | 30 | 23 |
| 7 | Adults 18-24 in Poverty | 32 | 26 |
| 8 | Adults 25-64 in Poverty | 20 | 14 |
| wdt_ID | Population | Appalachian Rural | Non-Appalachian Rural |
|---|---|---|---|
| 1 | In Poverty | 22 | 16 |
| 2 | Children in Poverty | 30 | 23 |
| 3 | Adults 18-24 in Poverty | 32 | 26 |
| 4 | Adults 25-64 in Poverty | 20 | 14 |
Poverty rates in rural Appalachia were also higher, with at least a six-percentage point gap in every age group. Nearly one-third of young adults ages 18 to 24 were in poverty in rural Appalachia in 2014-2018—a rate even higher than that among children.
“Across the country, lower-income households and young adults have been hard hit by the current pandemic in terms of job and income loss; our findings indicate that conditions were already more challenging in rural counties within Appalachia than in those outside the Region, even before the pandemic,” said Jacobsen.
The Appalachian Region encompasses 205,000 square miles along the Appalachian Mountains from southern New York to northern Mississippi, including portions of 12 states and all of West Virginia. The Appalachian Regional Commission report uses data from the 2014-2018 American Community Survey and the Census Bureau’s vintage 2018 population estimates—the most recent data available for the characteristics studied. It includes detailed tables and county-level maps covering state- and county-level data on population, age, race and ethnicity, housing occupancy and tenure, housing type, education, computer ownership and internet access, labor force participation, employment and unemployment, transportation and commuting, income and poverty, health insurance coverage, disability status, migration patterns, and veteran status. It also includes a detailed comparison of characteristics in rural Appalachian counties with those outside the Region.
The Appalachian Regional Commission is an economic development agency of the federal government and 13 state governments focusing on 420 counties across the Appalachian Region. ARC’s mission is to innovate, partner, and invest to build community capacity and strengthen economic growth in Appalachia to help the Region achieve socioeconomic parity with the nation.

A household is defined by the U.S. Census Bureau as all the people who occupy a single housing unit, regardless of their relationship to one another.
One person in each household is designated as the householder—the person, or one of the people ages 15 or older, in whose name the housing unit is owned, being bought, or rented. The relationships of all other household members are defined only in relation to the householder and then used to group households into different types. The two primary types are family households and nonfamily households.
Family households have a householder and one or more additional people who are related to the householder by marriage, birth, or adoption. Any children under age 18 who are the biological, adopted, or stepchildren of the householder are classified as “own children.” Family households include married couples with and without children under age 18, single-parent households with children, and other groupings of related adults such as two siblings sharing a housing unit or a married couple whose adult child has moved back home. Family households can also include additional people who are not related to the householder, such as a boarder.
Nonfamily households have a householder who lives alone or who shares the housing unit only with nonrelatives, such as roommates or an unmarried partner. Unmarried partner households can be either family or nonfamily households depending on which partner is designated as the householder and whether any additional household members are related to the householder. If an unmarried couple has a biological child together, then their household would be considered a single-parent family even though such a child would actually be living with both biological parents. However, if a child is related to only one partner of an unmarried couple, then the household can be either a single parent family or a nonfamily household depending on which partner is arbitrarily designated as the householder.
Although the decennial census has always defined household types based on the relationships of household members to the householder, the number of possible relationships has expanded over time. In 1960 and 1970, respondents were asked to identify the “Head of the Household,” and in married couple households, only the husband could be designated as the “Head.” Response categories included “Wife of Head,” but not “Husband of Head.” Beginning in 1980, the term “Head of the Household” was replaced with “Person 1,” defined as the household member or one of the members in whose name the home is owned or rented. Response categories were also changed to include “Husband or Wife of Person 1”.1
With the rise in cohabitation in the 1980s, the 1990 Census was the first to include “Unmarried Partner” as a possible relationship to Person 1, in addition to “Housemate, roommate”. The 1990 form also added foster child to the “Roomer, boarder” category, and included “Grandchild” as a separate relationship type for the fi rst time. The 2000 Census listed “Foster child” as a separate relationship type, and although this category was excluded from the 2010 Census, it will be available again in the 2020 Census.
With the legalization of same-sex marriage by the U.S. Supreme Court in 2015, the 2020 Census will include “Same-sex husband/wife/spouse” and “Same-sex unmarried partner” relationship categories for the first time.2Separate categories will also be provided for “Opposite-sex husband/wife/spouse” and “Opposite-sex unmarried partner.” No changes will be made that would help clarify or consistently classify the appropriate household type for unmarried partners with children.
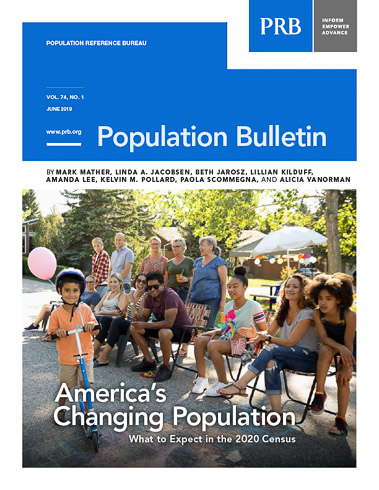
This article is excerpted from Mark Mather et al., “What the 2020 Census Will Tell Us About a Changing America,” Population Bulletin 74, no. 1 (2019).
1 U.S. Census Bureau, Decennial Census Questionnaires and Instructions, www.census.gov/programs-surveys/decennial-census/technical-documentation/questionnaires.html.
2 U.S. Census Bureau, Questions Planned for the 2020 Census and American Community Survey (Washington, D.C.: U.S. Census Bureau, 2018).

Researchers use two main measures to determine who was missed in the 2010 Decennial Census: omissions and net undercounts. Omissions reflect the number of people who should have been counted in the census but were not, while net undercounts reflect the percent of people who were missed minus the percent who were double counted.
Census omissions and net undercount rates both reflect dimensions of census accuracy, but they often tell different stories. Analysis shows a nationwide omissions rate of 5.3 percent compared to a net undercount rate of 0.01 percent. This paper focuses on census omissions. In the 2010 U.S. Census, there were nearly 16 million omissions.
Omissions rates vary among demographic groups in much the same pattern as seen in net undercount rates. Racial and Hispanic minorities have higher omissions rates than non-Hispanic whites. Renters (8.5 percent omissions rate) are more likely than homeowners (3.7 percent) to be omitted in the census. Among the states, omissions rates range from a low of 2.6 percent in Iowa to a high of 8.9 percent in Mississippi. Large cities tend to have higher omissions rates than the rest of the country.
Obtaining an accurate count of state and local populations is important because the data affect the balance of political power across geographic areas and are widely used for state and local decisionmaking. For example:
A comprehensive picture of census accuracy requires assessment of the number, characteristics, and geographic locations of those who are missed in the census in addition to analysis of net undercount rates. By understanding who was omitted in the 2010 Census, community leaders, advocates, and others can better target geographic areas and population subgroups for get-out-the-count efforts to reduce the number of people who are missed in the 2020 Census and improve the accuracy of the count for state and local populations.
I would like to acknowledge support from the 2020 Census Project, a funders collaborative to promote a fair and accurate census, hosted by New Venture Fund. I would also like to thank Linda A. Jacobsen and Mark Mather at Population Reference Bureau (PRB) for reviewing and providing comments on this report, and Paola Scommegna and Lillian Kilduff at PRB for their editorial assistance.
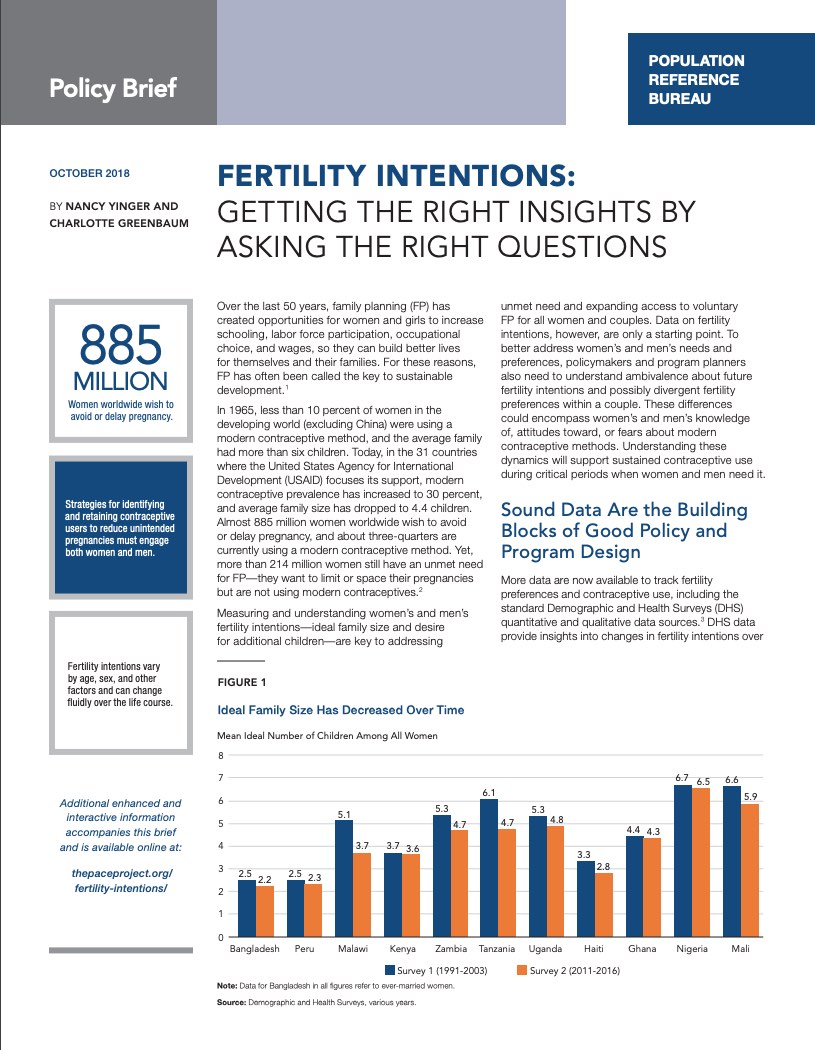
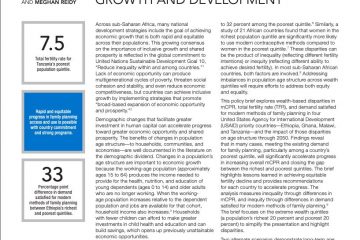
Over the last 50 years, family planning has created opportunities for women and girls to increase schooling, labor force participation, occupational choice, and wages, so they can build better lives for themselves and their families. For these reasons, family planning has often been called the key to sustainable development. Yet, more than 214 million women still have an unmet need for family planning—they want to limit or space their pregnancies but are not using contraceptives.
Measuring and understanding women’s and men’s fertility intentions—ideal family size and desire for additional children—are key to addressing unmet need and expanding access to voluntary family planning for all women and couples. Data on fertility intentions, however, are only a starting point.
This policy brief and web feature explores data and research on fertility needs and preferences throughout the developing world that could contribute to more grounded policies and programs to address women’s and men’s fertility intentions. The web feature’s interactive graphics and video provide an immersive experience in the data. To better address women’s and men’s needs and preferences, policymakers and program planners also need to understand ambivalence about future fertility intentions and possibly divergent fertility preferences within a couple. These differences could encompass women’s and men’s knowledge of, attitudes toward, or fears about modern contraceptive methods. Understanding these dynamics will support sustained contraceptive use during critical periods when women and men need it.
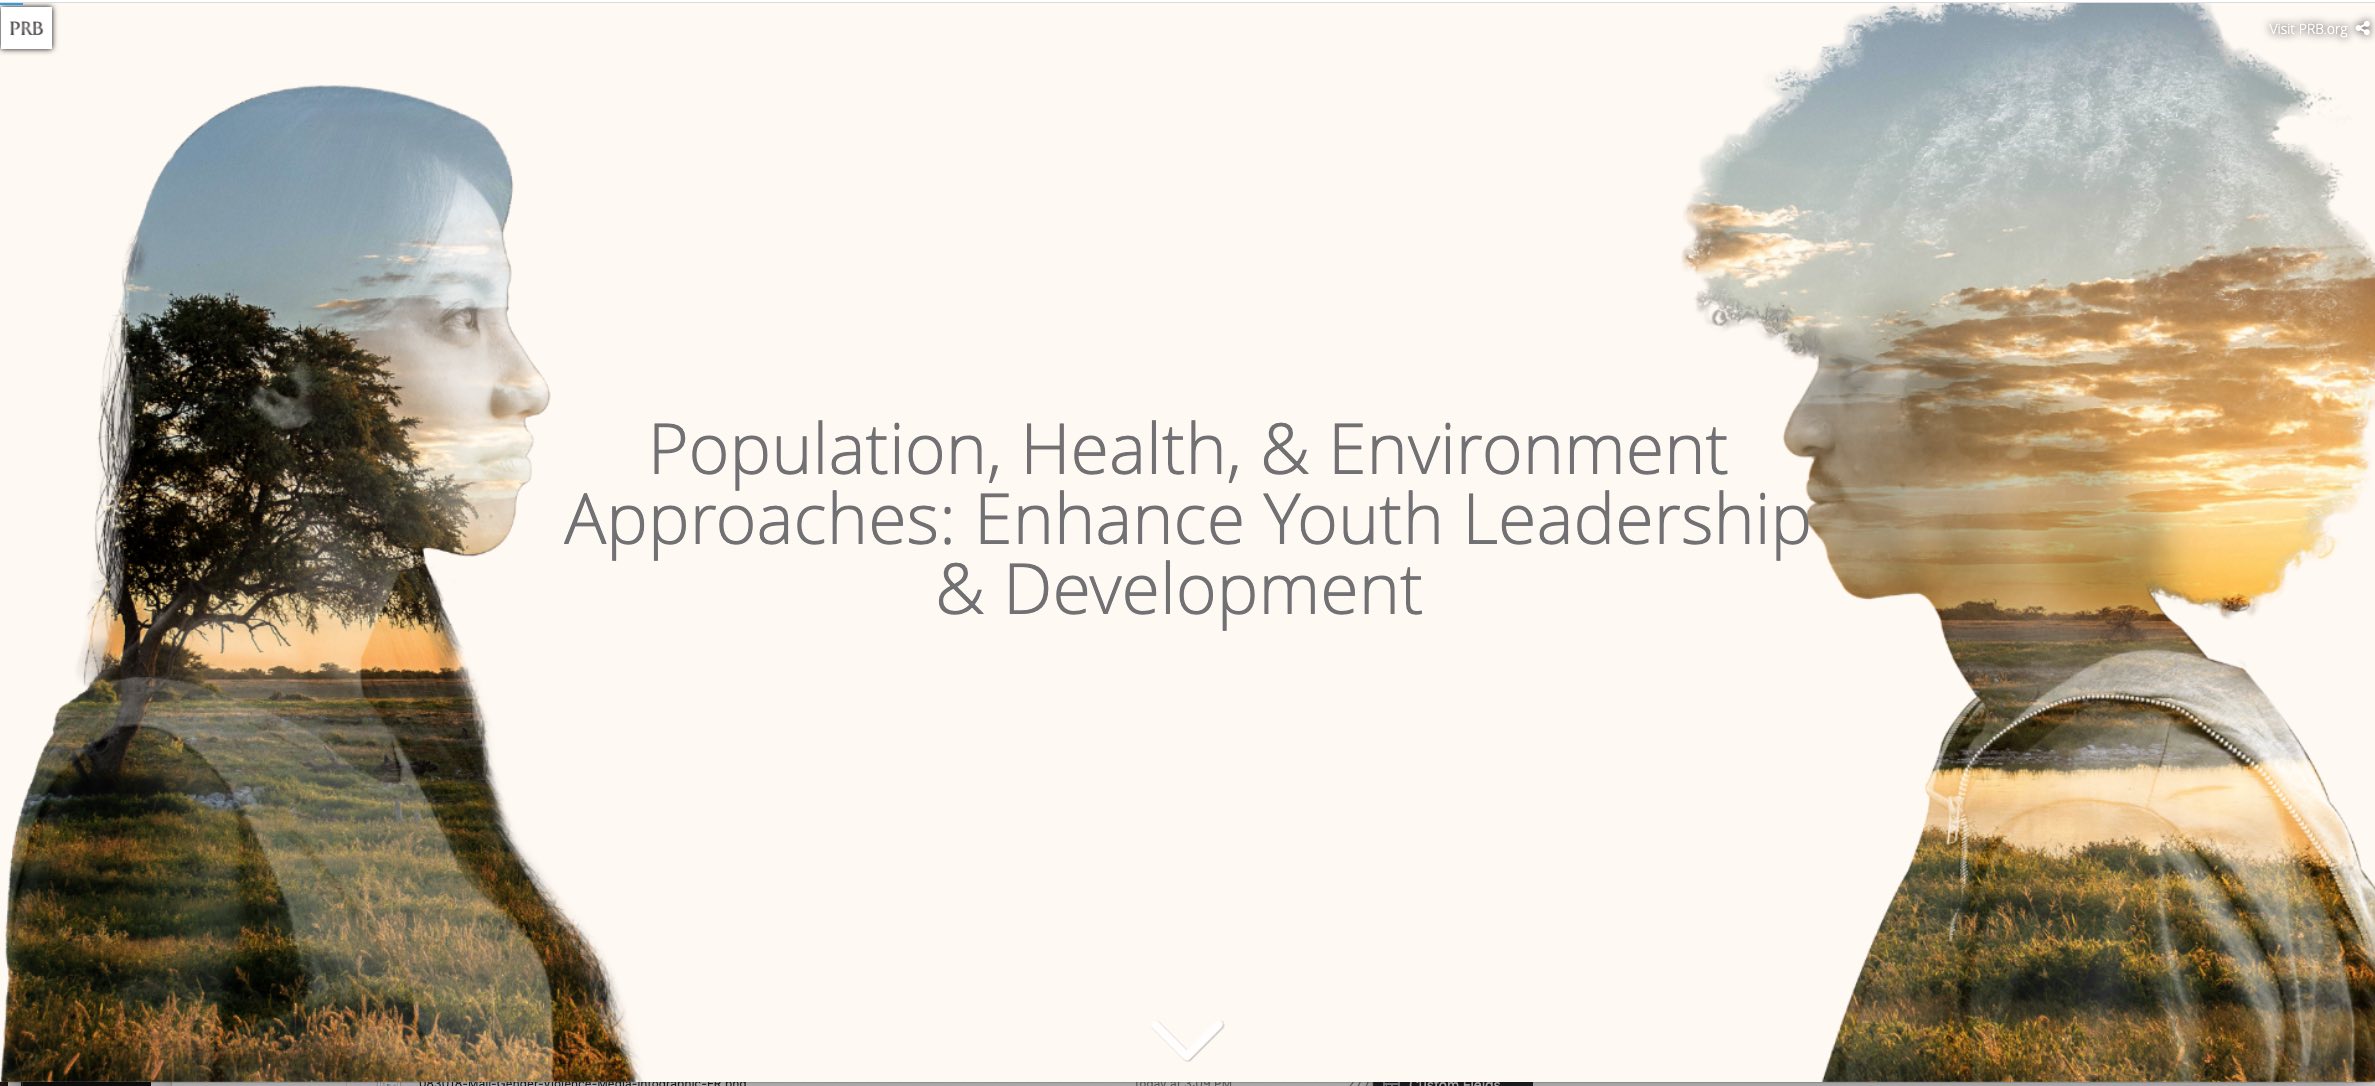
Youth constitute a large share of the world’s population. According to the United Nations, 33 percent of the global population is between the ages of 10 to 29.1 Yet, many youth in the world’s most rural areas—whose needs differ from urban youth—are not receiving critical health services, education, or training.
A growing body of evidence suggests that integrated population, health, and environment (PHE) projects, a type of community-based development approach, can help youth in rural communities meet these needs. PHE projects seek to improve community health—including family planning/reproductive health—and manage natural resources sustainably, often integrating skills-building and sustainable livelihoods.
This policy brief and web feature describe how PHE projects contribute to youth development. Youth are defined in these products as young people between the ages of 10 and 29. The brief and web feature illustrate how youth leadership and inclusion within integrated approaches contribute to sectoral outcomes, and the web feature includes two case studies and videos that explore these outcomes. Finally, the products provide recommendations for policymakers, advocates, and organizations interested in youth and PHE to improve project design, foster youth development, and invest in monitoring and evaluating the benefits of PHE integration for youth.
Following the publication of the brief and web feature, the PACE Project and YouthPower Learning co-hosted a webinar discussing the overlaps between PHE and positive youth development (PYD) as holistic approaches. Modest Kinawa, of the Health of People and Environment-Lake Victoria Basin (HoPE-LVB) project also showcased the design of the HOPE-LVB project and discussed specific PHE interventions that embraced the PYD framework.


 ">
">


 ">
">


 ">
">
 ">
">

 ">
"> ">
">