Pregnant afro hair woman in the city

High Premature Birth Rates Among U.S. Black Women May Reflect the Stress of Racism and Health and Economic Factors

Racism-related stress may help explain why Black women in the United States are over 50% more likely to deliver a premature baby than white women.

Just over 14% of Black women have premature births compared with 9% of white women.1These stark racial disparities have been documented for more than a century, reports Catherine Cubbin of the University of Texas at Austin, who calls them “alarming.”

Characteristics like a mother’s health, education, and income account for less than half of the disparity, and researchers have long sought answers to further explain the gap.2 Growing evidence suggests that racism-related stress may contribute to premature births.3

Premature or preterm birth (before 37 weeks of gestation) is one of the most common causes of infant mortality in the United States.4

“Many people think that small and premature babies will by and large ‘catch up’ in weight and live long and healthy lives—and fortunately, many do,” Cubbin says. “What may come as a surprise though is that premature birth increases both the risk of death and multiple, serious disabilities for those babies. It also raises the risk of chronic diseases and early death when those babies become adults.”

Racism-Related Stress Could Be Key to Explaining Black/White Gap in Premature Births

Researchers have been unable to fully explain the racial gap in premature births.

A large body of research shows that known risk factors for premature births—such as smoking during pregnancy—only explain a portion of this racial disparity, according to Cubbin. For example, a new study shows that a non-smoking Black woman faces the same odds of delivering prematurely as a white woman who smokes up to nine cigarettes per day before and during pregnancy.5

Babies born to women with more socioeconomic resources—more education, income, and wealth—tend to fare better, research shows. But the gap between Black and white women exists at all socioeconomic levels and may even be wider among women with college degrees, Cubbin points out.6

The growing evidence that racism-related stress contributes to these inequities in premature birth accounts for some of the dynamics that earlier studies couldn’t unravel.

Stressful experiences that women face throughout their lives and across generations can have a powerful impact on the body, says Cubbin. “The stress can be related to interpersonal interactions like feeling socially isolated, getting passed over for a promotion, or being called racist labels, and to institutional discrimination, such as living in unhealthy neighborhoods or receiving inadequate medical care.”

Chronic stress is a risk factor for premature and low-birthweight births, she explains. Stress affects the body by raising blood pressure, increasing stress hormones, triggering inflammation, and dampening the immune system in ways that affect a growing fetus, restricting growth and/or triggering premature labor, according to Cubbin.

New studies supported by the Eunice Kennedy Shriver National Institute of Child Health and Human Development (NICHD) are using innovative approaches to probe the racial disparity in premature births to better identify the root causes and address them.

Twitter May Offer a Barometer of Local Racism and Stress

Experiences of racism are hard to measure, but one research team has come up with a novel approach. They are using Twitter to examine state-level sentiment toward racial and ethnic minorities and compare it with patterns of premature births.7

They found that a higher level of negative sentiment toward Black people by Twitter users in a U.S. state was related to higher rates of premature and low-birthweight births in that state.

The study was conducted by an eight-member team including Thu X. Nguyen of the University of California, San Francisco and Quynh C. Nguyen of the University of Maryland. It was based on more than 1.2 million tweets containing at least one word pertaining to a racial or ethnic minority merged with data on all 2015 U.S. births (4 million). Negative comments included complaints, insults, or racial slurs, while positive sentiments expressed cultural pride or denied racial stereotypes.

The researchers divided states into categories of low, medium, and high on both positive and negative sentiment. All mothers living in states with the lowest levels of positive sentiment toward Black people were 16% more likely to have a premature birth compared to mothers living in the states with the highest level.

The premature birth patterns they observed among minority subgroups were the same as those found for the full population. This similarity suggests that social environments with greater levels of hostility toward minority groups may have adverse effects for all.

Efforts to promote a more accepting and inclusive social environment may reduce premature and low-weight birth rates among all groups, the researchers suggest. An updated analysis using 2015 to 2017 birth data revealed similar findings.8

A Mother’s Education, Health, Other Characteristics Contribute to Racial Disparities in Premature Births

More than one-third (38%) of the Black-white disparity in premature births can be explained by mothers’ socioeconomic characteristics, such as her education level, aspects of her health, and where she lives, a new analysis shows.9

“Premature birth is influenced by multiple factors that we are still trying to understand,” notes Marie Thoma of the University of Maryland. “The factors we identified could still be rooted in racism, if you think about structural barriers that reduce a Black woman’s access to education and health care.”

Using advanced statistical methods, Thoma and a team of researchers quantified the contribution of a variety of factors to the racial gap in premature births using data from more than 2 million 2016 U.S. birth certificates.

Their results showed that the largest contributors to these disparities were:

  • Mother’s education, which may be related to her income, health care, health insurance, access to health information, and her health habits. Her education level may also influence the physical demands of her job, her cognitive skills, and sense of control of her life.
  • Mother’s marital status and whether the child’s father was listed on the birth certificate, which may reflect paternal involvement and financial support during pregnancy.
  • Her source of payment for delivery, particularly Medicaid, which may reflect her ability to navigate the health care system and her access to ongoing care.
  • Chronic hypertension (high blood pressure), not hypertension that developed during pregnancy (preeclampsia).

“Prenatal care did not contribute that much to explaining the disparity, which didn’t surprise us,” says Thoma. “Birth certificate data is not able to measure the quality of a woman’s prenatal care or how satisfied she was with her care, which may be a better measure of potential bias in health care delivery.”

To reduce the racial gap in premature birth, the researchers suggest that policymakers consider public health programs designed to expand health care access and enhance social support for pregnant Black women—such as prenatal care groups based in local clinics. They also recommend improving primary health care for Black women before conception, specifically targeting hypertension.

Programs that can address preeclampsia and hypertension could reduce some of the disparity in the short term before other important structural changes can occur that address the root causes of these inequalities, Thoma points out.

Racial and Ethnic Composition of Mothers’ Neighborhoods a Factor in Premature Birth Risk

The racial composition of a mother’s neighborhood also appears to shape her risk of premature birth, a new study by Cubbin, Yeonwoo Kim formerly of the University of Michigan, Shetal Vohra-Gupta of the University of Texas at Austin, and Claire Margerison of Michigan State University finds.10

The researchers focused on all single babies born to non-Hispanic Black and white women in Texas between 2009 and 2011 (more than 477,000). They linked these birth certificate data with data on neighborhood racial and ethnic composition over 20 years rather than at just one point in time. They examined and classified the proportion of Latino, non-Hispanic Black, and non-Hispanic white residents in each neighborhood in 1990, 2000, and 2010, and any change in the population share held by each racial and ethnic group between 1990 and 2000 and between 2000 and 2010. Their analysis accounted for differences in parents’ education, marital status, prenatal care, and neighborhood poverty, among other factors.

Key findings:

  • No matter the racial and ethnic composition of their neighborhood, Black women have higher odds of having a premature birth than white women.
  • Overall, both Black and white women are at higher odds of a premature birth if they live in a neighborhood with a persistently high concentration of Black residents.
  • White women have lower odds of giving birth prematurely if they live in a neighborhood with a persistently high concentration of white residents.
  • Black/white disparities are highest in neighborhoods with high ongoing concentrations of white residents (59% higher) and lowest in neighborhoods with persistently low concentrations of white residents (34% higher).

“If you have a white woman and a Black woman and all other things are equal [age, marital status, prenatal care, her education level and that of her partner, and neighborhood poverty level], the Black woman faces a higher risk of having a premature birth,” Cubbin explains.

In predominantly Black neighborhoods, both Black and white women may have limited access to health care services, lack educational and employment opportunities, and feel less safe than women living in other neighborhoods, Cubbin suggests.

In an earlier study, the researchers showed that neighborhood poverty and inequality was related to premature births but did not explain Black/white differences, suggesting that all mothers are affected by high-poverty neighborhoods and high levels of income inequality in a harmful way. But, in fact, Black women are impacted more severely.11

The researchers argue that racially inclusive policies can improve the health of mothers and prevent premature birth among Black women in predominantly non-white neighborhoods by addressing key factors shaping health such as limited opportunities for adequate and affordable housing, access to health care, high-quality minority-focused health resources, sustainable income, and quality education.


This article was produced under a grant from the Eunice Kennedy Shriver National Institute of Child Health and Human Development (NICHD). The work of researchers from the following NICHD-funded Population Dynamics Research Centers was highlighted: University of Texas at Austin (5P2CHD042849-18), University of Maryland (5P2CHD041041-18), and University of Michigan (5P2CHD041028-18).

References

  1. Joyce A. Martin et al., “Births: Final Data for 2018,” National Vital Statistics Reports 68, no. 13 (2019).
  2. Marie E. Thoma et al. “Black-White Disparities in Preterm Birth: Geographic, Social, and Health Determinants,” American Journal of Preventive Medicine 57, no. 5 (2019): 675-86.
  3. Tyan Parker Dominguez et al., “Racial Differences in Birth Outcomes: The Role of General, Pregnancy, and Racism Stress,” Health Psychology 27, no. 2 (2008): 194-203; James W. Collins Jr et al., “Very Low Birthweight in African American Infants: The Role of Maternal Exposure to Interpersonal Racial Discrimination,” American Journal of Public Health 94, no. 12 (2004): 2132-8; Sarah Mustillo et al., “Self-Reported Experiences of Racial Discrimination and Black-White Differences in Preterm and Low-Birthweight Deliveries: The CARDIA Study,” American Journal of Public Health 94, no. 12 (2004): 2125-31; and Paula Braveman et al., “Worry About Racial Discrimination: A Missing Piece of the Puzzle of Black-White Disparities in Preterm Birth?” PloS One 12, no. 10 (2017).
  4. William M. Callaghan et al., “The Contribution of Preterm Birth to Infant Mortality Rates in the United States,” Pediatrics 118, no. 4 (2006): 1566-73, https://doi.org/10.1542/peds.2006-0860.
  5. Samir Soneji and Hiram Beltrán-Sánchez, “Association of Maternal Cigarette Smoking and Smoking Cessation With Preterm Birth,” JAMA Network Open 2 (2019), https://jamanetwork.com/journals/jamanetworkopen/fullarticle/2730781.
  6. Jasmine D. Johnson et al., “Racial Disparities in Prematurity Persist Among Women of High Socioeconomic Status,” American Journal of Obstetrics & Gynecology 2, no. 3 ( 2020): 100104.
  7. Thu T. Nguyen et al., “Twitter-Derived Measures of Sentiment Towards Minorities (2015-2016) and Associations With Low Birth Weight and Preterm Birth in the United States,” Computers in Human Behavior 89 (2018): 308-15.
  8. Thu T. Nguyen et al., “The Association Between State-Level Racial Attitudes Assessed From Twitter Data and Adverse Birth Outcomes: Observational Study,” JMIR Public Health Surveillance 6, no. 3 (2020): e17103.
    [9]  Marie E. Thoma et al. “Black-White Disparities in Preterm Birth: Geographic, Social, and Health Determinants,” American Journal of Preventive Medicine 57, no. 5 (2019): 675-86.
  9. Yeonwoo Kim et al. “Neighborhood Racial/Ethnic Composition Trajectories and Black-White Differences in Preterm Birth Among Women in Texas,” Journal of Urban Health: Bulletin of the New York Academy of Medicine 97, no. 1 (2020): 37-51.
  10. Catherine Cubbin et al., “Longitudinal Measures of Neighborhood Poverty and Income Inequality Are Associated With Adverse Birth Outcomes in Texas,” Social Science & Medicine 245 (2020).
Newborn Twins in Nigerian Hospital

Improving Antenatal Care in Nigeria With Social and Behavioral Change

The Breakthrough RESEARCH project has identified three important factors for improving women’s attendance at four or more antenatal visits during pregnancy (ANC4+) in three states in northwestern Nigeria: 1) knowledge of ANC’s benefits, 2) confidence in the ability to access care, and 3) knowledge of the need to attend four or more visits. If these factors are addressed, they may further improve ANC4+ uptake and the health of women and their children.

These findings are displayed in three infographics, each focusing on data from one of three states—Kebbi, Sokoto, and Zamfara. The infographics are available in English and Hausa.

These infographics draw on data and a Breakthrough RESEARCH programmatic research brief from the first phase of a behavioral sentinel surveillance (BSS) survey completed in northwestern Nigeria. The BSS is rigorously assessing current practices and behavioral determinants of health outcomes over the lifespan of the Breakthrough ACTION integrated social and behavior change (SBC) project in Nigeria. Breakthrough ACTION is a sister project to Breakthrough RESEARCH.

The Breakthrough RESEARCH project BSS in Nigeria is being conducted to inform the delivery of SBC programming among mothers within the first 1,000-day window of opportunity after a child’s birth, including integrated interventions to promote malaria prevention and treatment behaviors, antenatal care attendance, delivery with a skilled attendant, early and exclusive breastfeeding, child immunization, timely care-seeking for common childhood illnesses, and postpartum contraceptive use.

Additional results from the baseline survey in northwestern Nigeria are available through a series of health topic-focused briefs, slide decks, and webinars.

1120f-obesity-rural-hospitals

High Obesity Rates Plus Severe Coronavirus Cases Could Strain Rural U.S. Hospitals

As coronavirus cases rise in less densely populated states in the Midwest and West, the disease, combined with high levels of obesity in rural America, could pose major challenges for health care systems, suggests Mark Lee at the University of Minnesota.

People of any age with obesity face a greatly increased risk of severe illness and death from COVID-19, the disease caused by the novel coronavirus, confirms new research supported by the Eunice Kennedy Shriver National Institute of Child Health and Human Development (NICHD).1

An analysis of published data led by Barry Popkin of the University of North Carolina at Chapel Hill found that people with obesity—defined as a body mass index (BMI) of 30 or higher—who were infected with the virus had a higher risk of hospitalization, admission to intensive care, and death compared with those without obesity (see Figure 1).

FIGURE 1. People With Obesity Face Higher Health Risks From COVID-19 Than People Without Obesity

 Percent Higher Risk for People With Obesity
Hospitalization  113%
 Admission to intensive care  74%
 Death  48%

Source: Barry M. Popkin et al., “Individuals With Obesity and COVID‐19: A Global Perspective on the Epidemiology and Biological Relationships,” Obesity Reviews 21, no. 11 (2020): e13128, https://doi.org/10.1111/obr.13128.

Obesity is an epidemic of its own in rural America: In a recent interview Lee pointed to analysis showing that 43% of Americans in nonmetropolitan areas were obese in the period from 2013 to 2016 compared with 35% of their peers in large metropolitan areas, a full eight percentage-point difference.2


FIGURE 2. Obesity in the United States Is More Prevalent Outside of Metropolitan Areas

 Percent Obese
Large Metropolitan Areas  35%
Nonmetropolitan Areas  43%

Source: Craig M. Hales et al., “Differences in Obesity Prevalence by Demographic Characteristics and Urbanization Level Among Adults in the United States, 2013-2016,” JAMA 319, no. 23 (2018): 2419-29.

“A large coronavirus outbreak in a rural area could lead to a high level of severe cases and greater mortality because the rural population has more underlying conditions, including obesity, and tends to be older,” Lee says. “There are fewer health care resources such as ICU beds, and distances make accessing care more difficult.”

Recent research by Lee and other NICHD-supported investigators examines the dynamics of rural obesity, underscoring the importance of prevention efforts.

Living in Rural Areas Linked to Weight Gain and Obesity

Not only are rural residents more likely to be obese than urban residents, people who move to rural counties are more likely to become obese than their peers who remain in cities, Lee reports.3

These findings come from a study based on 1986 to 2014 data from the National Longitudinal Survey of Youth, which began regularly surveying a nationally representative sample of Americans ages 14 to 22 in 1979 about important life events such as employment, education, health problems, and marriages. The analysis takes into account differences in the makeup of rural and urban populations.

Previous research may explain some of these patterns: Rural areas have a lot of open space, but the roads are not conducive to physical activity, and sidewalks and parks are limited, Lee says. Many rural residents have long commutes and rely on cars for all of their errands.

Grocery stores selling high-quality fresh produce are also more limited. The U.S. Department of Agriculture identified census tracts that have limited access to healthy and affordable food and found that rural tracts were nearly twice as likely to have limited access compared with urban tracts, at 15.9% and 8.2% respectively.4

“Convenience stores that sell highly processed items and limited perishable foods like Dollar General are the largest retailers in rural America,” Lee points out.

Given the increased risk of weight gain in rural areas, residents would benefit from policies that address obesity and exercise such as expanding access to quality food and opportunities for physical activity, he notes.

Residents in More Remote Rural Areas Face a Higher Risk of Obesity

The more remote the rural area, the higher the obesity risk residents face, another recent study showed.

Rural Americans living in remote areas are more likely to have obesity and diabetes than their counterparts whose homes are closer to highways and near small towns, according to research conducted by a team from the universities of Maryland, Utah, and California at San Francisco.5

The researchers analyzed neighborhood characteristics nationwide using a comprehensive set of 16 million Google Street View images linked with health data from the U.S. Centers for Disease Control and Prevention. Their analysis took into account differences in county-level demographics, economic characteristics, and population density.

The greater abundance of services and facilities found in areas with more roads may offer residents greater access to places and resources that promote health, they suggest.

“Poorer health in rural areas is not inevitable,” the researchers argue. Addressing obesity and promoting health may involve advocating for roads and community resources such as parks and sidewalks—especially in more resource-poor areas, they suggest.

Rural-Urban Life Expectancy Gap Widens

Over the past three decades, and particularly since 2010, gains in life expectancy have slowed or even reversed in some places for non-Hispanic whites, particularly those living in nonmetropolitan areas, new research shows.6

Deaths related to the opioid epidemic explain part of this trend, but rising obesity may also play a role, suggest Irma T. Elo, Yana Vierboom, and Samuel H. Preston at the University of Pennsylvania, Arun S. Hendi of Princeton University, and Jessica Y. Ho of the University of Southern California.

The team of researchers analyzed death data from 1990 to 2016 by age, sex, race/ethnicity, and cause of death for American adults ages 25 and older compiled by the National Center for Health Statistics, then estimated death rates by age, year, and geographic region. They grouped the data into four categories based on geographic characteristics: large central metropolitan areas, large metropolitan suburbs, small/medium metropolitan areas, and nonmetropolitan areas.

As part of the comprehensive analysis, they compared the change in life expectancy with the change in obesity rates in 40 geographic areas. They found that decreases in life expectancy were associated with increases in obesity more closely than any other variable they examined.

Obesity is a risk factor for cardiovascular disease and other chronic conditions, they note, and suggest that it “plays some role in the trends we observe.”

Living in Disadvantaged Areas Increases the Odds of Obesity Among Adults

Might the higher prevalence of obesity in rural America be related to the level of disadvantage in some rural areas?

A team of researchers examining risk factors for cardiovascular disease found that living in a socioeconomically disadvantaged areas early in life was linked to high blood pressure in adulthood, while living in a disadvantaged area in adulthood was linked to obesity.7 They categorized disadvantaged areas based on levels of household income, unemployment, and residents without a high school diploma.

These researchers, from Brown, Johns Hopkins, and Harvard universities, based their analysis on longitudinal data from the New England Family Study, which tracked 671 people in Massachusetts and Rhode Island over 46 years, from 1961 to 2007.

Their findings provide additional evidence that living in a low-income area is associated with an elevated risk of obesity, suggesting that people living in disadvantaged rural areas are an important target for obesity prevention initiatives.

Given that large shares of rural Americans have—or are at risk of—obesity and other medical conditions that can make COVID-19 severe, regular preventive health care is more important than ever, Minnesota’s Lee argues. Such care includes flu shots and other immunizations, blood pressure checks, blood sugar and cholesterol monitoring, and mental health screening.


This article was produced under a grant from the Eunice Kennedy Shriver National Institute of Child Health and Human Development (NICHD). The work of researchers from the following NICHD-funded Population Dynamics Research Centers was highlighted in this article: University of Minnesota (P2CHD041023), University of Pennsylvania (P2CHD044964), University of Maryland (P2CHD041041), Brown University (P2CHD041020), and University of North Carolina at Chapel Hill (P2CHD050924).


References

1 Barry M. Popkin et al., “Individuals With Obesity and COVID‐19: A Global Perspective on the Epidemiology and Biological Relationships,” Obesity Reviews 21, no. 11 (2020): e13128, https://doi.org/10.1111/obr.13128.
2 Craig M. Hales et al., “Differences in Obesity Prevalence by Demographic Characteristics and Urbanization Level Among Adults in the United States, 2013-2016,” JAMA 319, no. 23 (2018): 2419-29. For this study, large metropolitan areas include counties in metropolitan statistical areas (MSAs) with a population of 1 million or more. Nonmetropolitan areas include counties not in MSAs.
3 Mark Lee, “Obesity Among U.S. Rural Adults: Assessing Selection and Causation With Prospective Cohort Data,” Health & Place 61 (2020): 102260, https://doi.org/10.1016/j.healthplace.2019.102260. For this study, urban refers to metropolitan counties (those with an urbanized population of at least 50,000 and/or adjacent counties with strong commuting ties), and rural refers to nonmetropolitan counties (including micropolitan and non-core counties).
4 Paula Dutko, Michele Ver Ploeg, and Tracey Farrigan, “Characteristics and Influential Factors of Food Deserts,” Economic Research Report No. 140 (U.S. Department of Agriculture, Economic Research Service, 2012). Note: the USDA classifications consider vehicle access, public transportation, and income. Food deserts are characterized by at least 500 people and/or 33 percent of the tract population residing more than one mile from a supermarket or large grocery in urban areas and more than 10 miles in rural areas.
5 Quynh C. Nguyen et al., “Using Google Street View to Examine Associations Between Built Environment Characteristics and U.S. Health Outcomes,” Preventive Medicine Reports 14 (2019): 100859, https://doi.org/10.1016/j.pmedr.2019.100859.
6 Irma T. Elo et al., “Trends in Non-Hispanic White Mortality in the United States by Metropolitan-Nonmetropolitan Status and Region, 1990-2016,” Population and Development Review 45, no. 3 (2019): 549-83.
7 Marcia P. Jimenez et al., “Longitudinal Associations of Neighborhood Socioeconomic Status With Cardiovascular Risk Factors: A 46-Year Follow-Up Study,” Social Science & Medicine 241 (2019): 112574, https://doi.org/10.1016/j.socscimed.2019.112574.

New_1120f-cohabiting

Cohabiting Couples in the United States Are Staying Together Longer but Fewer Are Marrying

More unmarried couples today are living together, and doing so for longer than in the past, but fewer of these relationships lead to marriage, new research finds. This change may in part reflect shifting attitudes toward cohabitation, and it results in more separations and re-partnering during young adulthood.

Most young women today will live with a romantic partner at least once, compared with just one-third of young women in the late 1980s.1 During that decade, most cohabiting relationships were short-lived and frequently led to marriage.

The new research, conducted by graduate students and faculty at the Center for Family and Demographic Research at Bowling Green State University, examined how cohabitation and marriage patterns have changed for young women over the past four decades. Their research was supported by the Eunice Kennedy Shriver National Institute of Child Health and Human Development (NICHD).

In their study, Esther Lamidi, now at the University of Colorado Colorado Springs, and colleagues Wendy Manning and Susan Brown at Bowling Green, drew on data from the National Survey of Family Growth (NSFG) to compare women ages 15 to 39 who lived with a first romantic partner in 1983-1988 and in 2006-2013.They examined changes in whether couples who lived together had married or split up within five years.

They found that while cohabiting relationships are still relatively short-lived, couples today are cohabiting longer—increasing from about 12 months in the 1983-1988 cohabitation cohort to 18 months in the later cohort—and that this longer duration is linked to couples delaying or forgoing marriage altogether. After five years, similar shares of women in both cohorts were still living with their partner, but the distribution of those still cohabiting as compared to those who had married had shifted. Among the early cohort, 23% of women were still cohabiting five years later, and 42% had married their partner. These shares were reversed among the later cohort—43% were still cohabiting and only 22% had married.

Women With Less Education Experience More Changes in Cohabitation

Over the past five decades, changes in family behaviors such as declining rates of marriage have been more pronounced among women with less education compared with women who have more education. Lamidi and her colleagues confirmed this divergence—similar to what’s been observed in other family behaviors and frequently termed “diverging destinies”—when they examined patterns of cohabitation across different sociodemographic groups.

Their analysis found that the more recent cohort was much less likely to marry their cohabiting partner, and while this pattern was observed across all sociodemographic groups, it occurred more frequently among women with less education.

After accounting for women’s educational attainment, their results show that between the two cohorts only women with less than a college education experienced a decline in marrying their cohabiting partner. In addition, women having one or more children while cohabiting—an occurrence more common among women with less education—delayed or inhibited marriage more for the later cohort than the earlier cohort, they found.

Cohabitation Changes Reveal a Widening Social Class Divide

Sociodemographic characteristics are associated with the pathways out of cohabitation—break ups or marriages—and changes among the cohabiting population’s characteristics can be reflected in changes in cohabitation outcomes. Yet while the researchers noted that the cohabiting population grew in size, became more racially and ethnically diverse and more highly educated, and had more births while living together, they found these compositional changes had little impact on the changes in cohabitation outcomes across the two cohorts.

What does this finding mean? The researchers conclude that the limited impact of population composition changes on cohabitation outcomes, combined with the decline in marrying a cohabiting partner among women with less education, suggests that the social class divide in the American family appears to be widening.

Their findings also “diminish the traditional view of cohabitation as a prelude to marriage” for women with less education and show, particularly for this population, that “cohabitation is increasingly serving a role similar to that of traditional marriage in offering a viable context for childbearing and child-rearing.”

Young Women Today Are Increasingly Likely to Experience a Breakup

Although cohabiting relationships may be lasting longer, they remain relatively unstable. Kasey Eickmeyer, now at the Center for Policing Equity, reports, “Millennials experienced more relationship instability during young adulthood than earlier birth cohorts of women.” She found that cohabitation experience accounted for this instability.

Eickmeyer asked whether young women see their intimate live-in relationships (either marriage or cohabitation) end more frequently today than earlier generations.3 She analyzed data from multiple cycles of the NSFG to examine women’s experience of ending marriages and cohabiting relationships when they were ages 18 to 25 across several five-year birth cohorts from 1960 to 1985.

She found that among women who had ever married or cohabited, the share breaking up with a live-in partner increased from 31% among women born between 1960 and 1964 to 44% among women born in 1985 to 1989.

Cohabitation explains this increasing likelihood of experiencing a breakup. Compared to women in the 1985-1989 birth cohort, women in the earlier birth cohorts from 1960-1964 through 1975-1979 were significantly less likely to have one or more live-in partnerships end. Once Eickmeyer accounted for women’s cohabitation experience, she found that young women’s increased likelihood of having an intimate partnership end is because union formation during young adulthood shifted from marriage—a relatively stable union—to cohabitation, a relatively unstable union.

More Breakups and Re-Partnering in Young Adulthood Suggest Changing Attitudes About Cohabitation

As more young women enter into and end cohabiting relationships, they have more opportunities to live with multiple partners in a pattern of serial cohabitation. The growing practice of serial cohabitation reflects in part changing attitudes about couples living together without marriage.

Eickmeyer and Wendy Manning wanted to know whether contemporary young adult women who had ever cohabited are more likely to re-partner than prior cohorts of young women.4 Using data from the 2002 and 2006-2013 NSFG, they compared the cohabitation experience of young women ages 16 to 28 across five-year birth cohorts beginning in 1960 through 1980 to examine trends in serial cohabitation.

They found that early Millennial women (born 1980-1984) were 53% more likely to live with more than one romantic partner during young adulthood compared with the late Baby Boomers (born 1960-1964), even after taking into account sociodemographic characteristics such as race and ethnicity and educational level, and relationship characteristics such as their age when their first cohabiting relationship ended and whether they had children.

Not only were early Millennial women more likely to live with more than one partner without marriage, they also formed subsequent cohabiting relationships more quickly than the late Baby Boomers—dropping from nearly four years between live-in relationships to just over two years.

The characteristics most strongly associated with serial cohabitation—such as identifying as non-Hispanic white, having less than a college education, and growing up with a single parent—remained stable across birth cohorts, Eickmeyer and Manning found. And, much like the cohabiting population, the composition of women who had previously lived with a partner changed across cohorts, but this shift does not explain the increase in serial cohabitation.

The researchers conclude that the increase stems from more young adults cohabiting, the continued instability of cohabiting relationships, the increasing length of time between first cohabitation and first marriage, and the growing acceptance of cohabitation during young adulthood.

Their findings highlight the instability in many contemporary young adults’ lives and the increasing role cohabitation plays in relationship churning. Although multiple live-in romantic relationships could have negative consequences for young adults’ well-being (and any children they may have), Eickmeyer and Manning suggest “that young adult relationships may be evolving, and young women may be learning to end coresidential relationships that are not working.”


This article was produced under a grant from the Eunice Kennedy Shriver National Institute of Child Health and Human Development (NICHD). The work of researchers from the NICHD-funded population dynamics research center at Bowling Green State University (P2CHD050959) was highlighted in this article.


References

  1. Paul Hemez and Wendy D. Manning, Twenty-Five Years of Change in Cohabitation in the U.S., 1987-2013, National Center for Family and Marriage Research Family Profiles, No. FP-17-02 (2017), http://www.bgsu.edu/ncfmr/resources/data/family-profiles/hemez-manning-25-years-change-cohabitation-fp-17-02.html
  2. Esther O. Lamidi, Wendy D. Manning, and Susan L. Brown, “Change in the Stability of First Premarital Cohabitation Among Women in the United States, 1983-2013,” Demography, 56 (2019): 427-50.
  3. Kasey J. Eickmeyer, “Cohort Trends in Union Dissolution During Young Adulthood,” Journal of Marriage and Family 81 (2019): 760-70.
  4. Kasey J. Eickmeyer and Wendy D. Manning, “Serial Cohabitation in Young Adulthood: Baby Boomers to Millennials,” Journal of Marriage and Family 80 (2018): 826-40.
prb-hero

Growing Together: Multisectoral Investments in Malawi’s Youth

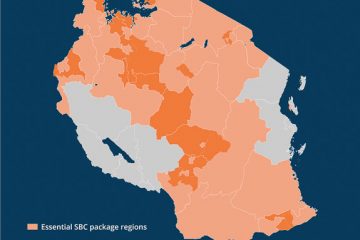
In Malawi, strategic and multisectoral investments in youth are critical pieces of national growth and development. Growing Together: Multisectoral Investments in Malawi’s Youth is an ENGAGE™ multimedia presentation that describes the necessary investments in young people’s health, education, employment opportunities, and participation in governance that can create a window of opportunity for accelerated economic development.

The goal of Growing Together: Multisectoral Investments in Malawi’s Youth is to build awareness of the overlapping needs and priorities of multiple sectors and increase support for cross-sectoral investments in Malawi’s young people. To achieve this goal, the presentation is designed to boost individuals’ understanding of the links between and among young peoples’ health, education, employment, and meaningful participation in governance, and how investments in each of these sectors can contribute to Malawi’s growth and development.

Developed with the guidance of a multisectoral taskforce chaired by the Ministry of Health and with representatives of government and civil society, the presentation incorporates youth interview clips, up-to-date research and data, and specific policy recommendations. Target audiences include national and subnational government policymakers; health, education, employment, and youth sector leaders; program officials; journalists; and others.

Growing Together: Multisectoral Investments in Malawi’s Youth is a 19-minute presentation available as a narrated video and a click-through .exe file for live presentations. The presentation is accompanied by a presentation guide designed to help users make the most of the presentation. The guide includes supplemental materials such as the full presentation script, references, key messages with screenshots, FAQs, and a discussion guide that can be used to prompt interaction and dialogue among viewers.

Growing Together: Multisectoral Investments in Malawi’s Youth

Presentation Guide

Download (PDF 4MB)

Live Presentation background material

Download . exe file (ZIP, 248 MB)

Malawi ENGAGE™ Media Clips: English

Education

Employment

Health

Malawi ENGAGE™ : Chichewa

Kukulira Limodzi: Kufesa Mipamba Yangodya Zotukulira Achinyamata m'Malawi

  • Ndondomeko Yoyenera Kutsata Pofotokozera Ndi Kuphunzitsa ( PDF, 4 MB)

Malawi ENGAGE™ Media Clips: Chichewa

Maphunziro

Ntchito

Zaumoyo

HP+ is a five-year cooperative agreement funded by USAID under Agreement No. AID-OAA-A-15-00051, beginning Aug. 28, 2015. HP+ is implemented by Palladium, in collaboration with Avenir Health, Futures Group Global Outreach, Plan International USA, Population Reference Bureau, RTI International, ThinkWell, and the White Ribbon Alliance for Safe Motherhood.

This presentation was produced for review by USAID. It was prepared by HP+. The information provided is not official U.S. Government information and does not necessarily reflect the views or positions of USAID or the U.S. Government.

ENGAGE is a trademark of Population Reference Bureau.


Photo credit: Kristungati CC BY-SA 4.0

new_0920f-homelessness

How Many People in the United States Are Experiencing Homelessness?

The economic effects of the coronavirus pandemic in the United States include an unemployment rate higher than at any time in the country’s history—including the Great Depression. As an unprecedented number of Americans struggle with job loss, many of them may lose their homes. Many others may lose their homes due to natural disasters or other crises. As these events fluctuate, so too may the number of people without a home. So how do we know how many people are experiencing homelessness in the United States?

We don’t. We have only widely differing estimates based on varying methodologies and definitions.

Estimates of homelessness in the United States range from fewer than 600,000 to more than 1.5 million people, and the estimates vary by source. The two key sources of data—the U.S. Department of Housing and Urban Development Point-in-Time Count, and the National Center for Education Statistics Count of Students Experiencing Homelessness—vary greatly in their coverage and in their annual estimates.

The HUD Point-in-Time Count—One Night Only

The U.S. Department of Housing and Urban Development (HUD) captures data on people experiencing homelessness through point-in-time (PIT) counts. PIT counts take place nationwide and are conducted on one night in the last week of January each year. HUD mandates that programs that receive funding to assist people experiencing homelessness, called Continuum of Care Programs (CoC), organize a count in their jurisdiction. The count itself is conducted by project staff and community volunteers. The CoC can choose to conduct their count either through a complete count or a sample. The sample method must follow HUD standards for counting and estimating the population.

The PIT counts both sheltered and unsheltered people experiencing homelessness. People included in the sheltered count sleep in shelters, transitional housing, or hotels and motels paid for by charities or government programs. Those who sleep in cars, parks, encampments, and other places not designated for regular sleeping are included in the unsheltered count.

HUD does not consider people who are temporarily doubled up with family or friends as homeless. This standard misses many people who lack permanent housing. In particular, parents with children may be less likely to seek group shelters and interact with authorities for fear of losing custody of their children.1

HUD provides a one-night snapshot of an experience that is often fluid for people who experience homelessness. The count does not include people who fall in and out of homelessness throughout the year. Additionally, changes in the count from year to year may reflect either an actual change or a change in the count’s accuracy. HUD itself cautions against drawing conclusions or trends from the count since data quality review is limited, reliability and consistency differ between CoCs, and methods may change between reporting periods.

Given these limitations, it is likely that the PIT undercounts the number of people experiencing homelesseness. These estimates can best be thought of as a snapshot of the minimum number of people who are homeless in a community, a state, or the nation.

The 2019 PIT count identified about 568,000 people experiencing homelessness. The states with the largest populations of people experiencing homelessness were California (151,000), New York (92,000), and Florida (28,000).

The NCES Count of Students Experiencing Homelessness—School Children Only

Another source of data on the number of people experiencing homelessness is the National Center for Education Statistics (NCES). Housed within the U.S. Department of Education, NCES compiles data on public school students experiencing homelessness during the school year. The count uses local school enrollment data that are submitted to the states and then reported to the Department of Education.

Unlike the one-night PIT count, the NCES count covers the entire school year and more accurately captures the fluid nature of homelessness. NCES defines students experiencing homelessness more broadly than the PIT count to include youth who are doubled up in housing and other temporary circumstances. However, this count includes only public school students and does not track adults experiencing homelessness. This count also does not include children who have dropped out of school, children in private schools, young children who are not yet enrolled in school, and children who experience homelessness outside of the school year.

According to NCES, more than 1.5 million students experienced homelessness during the 2017-2018 school year. This estimate is more than double the PIT count for 2018.More than 390,000 of these students were living at a shelter, staying at a hotel or motel, or were unsheltered. The remainder were doubled-up. California (263,000), Texas (231,000), and New York (153,000) had the largest populations of students experiencing homelessness during the 2017-2018 school year.

Which Estimate Is Best?

Both the PIT and NCES counts have advantages and challenges. Table 1 provides a comparison of the two estimates.

Table 1. Comparison of Data Sources on Homelessness in the United States

wdt_ID Data Source Type Universe Excludes Time Period
1 HUD Point-in-Time Count Enumeration (at selected locations) Entire population in selected communities Anyone doubled-up; communities not on HUD’s list One night (last week of January)
2 NCES Education for Homeless Children and Youth Administrative records Public school students Anyone not enrolled in public school School year

Note: The HUD Point-in-Time counts occur only in some communities and likely underestimate the population experiencing homelessness.

The PIT and NCES estimates both have well-documented undercount issues. NCES does not count adults or children not enrolled in school. PIT does not count anyone who is doubled-up. Data users should be aware of these limitations when working with either data source.

Crowds in a stadium with cots.

Disasters Raise Risk of a Homeless Undercount in 2020 Census

Counting people experiencing homelessness is not an easy task during any census, and the coronavirus pandemic, wildfires, and hurricanes have made the process even more complicated in 2020.

Despite rigorous efforts by the Census Bureau to count everyone in the United States, many people experiencing homelessness are likely to be missed in the 2020 Census count. The Census Bureau had already identified people experiencing homelessness as a hard-to-count population because they have more difficulty accessing the typical modes of responding to the survey—by internet, phone, or mail—than people with a permanent address.1 Then the pandemic’s effects on everyday life delayed census field operations. The rescheduled dates to count people experiencing homelessness—Sept. 22-24, 2020—place count efforts in the middle of peak wildfire and hurricane seasons. This confluence of crises magnifies the challenge of conducting a complete and accurate count of an often-overlooked population.

Counting People Where They Sleep

The goal of the 2020 Census is to count everyone once, only once, and at their “usual residence.” Usual residence is defined as the location where a person lives and sleeps most of the time. If people do not have a permanent home, they should be counted at the location where they are on Census Day, April 1, 2020. For people experiencing homelessness, their location on Census Day may be unsheltered (including living in a vehicle), at a shelter or transitional housing, at a hotel or motel, or doubled up in another household.

People who are doubled-up on Census Day should be counted in the household where they are staying on that day, and the census questionnaire includes prompts to help ensure everyone is counted. But the Census Bureau has identified the doubled-up population as hard-to-count because, despite prompts in the questionnaire, they may still be missed.

For people staying at shelters and those who are unsheltered, the Census Bureau aims to count people at the locations where they receive services, like soup kitchens, shelters, and mobile food vans, and at targeted outdoor locations like parks, under bridges, at bus depots, and other areas. To identify such count locations, the Census Bureau uses a combination of internet research and outreach to local elected officials and advocacy organizations.

Due to the coronavirus pandemic, however, both service-based and outdoor count operations were delayed. Service-based enumeration, originally scheduled for March 30 to April 1, has been delayed to September 22-24. The outdoor count, originally scheduled for April 1, will now take place from September 23-24. Because of these delays, people will no longer be counted where they were on April 1 but rather where they are staying in September. This shift—and the reasons for it—raise questions: Are the same service locations open? Are the same people using those services? Are people avoiding services to reduce their risk of exposure to the coronavirus that causes COVID-19, making them even harder to enumerate? All of these issues complicate the count of people experiencing homelessness in 2020.

Counting During Crises Heightens the Risk of Undercount

The shift in operations has also moved the count into peak hurricane and wildfire seasons. Just as census enumerators are preparing to count people outdoors and at service-based locations, serious natural disasters are ravaging parts of the nation. Wildfires have led to hazardous air quality across much of the West Coast, forcing many people to stay indoors. Hurricane Sally, which hit the Gulf Coast on Sept. 16, 2020, has severely damaged infrastructure across several states. People who would normally be outdoors may not be in their “usual” locations, and services may be dramatically disrupted in areas that have been affected by disasters.

The closure of libraries and other community facilities further compounds the challenge of counting. If people experiencing homelessness are missed in service-based and unsheltered enumeration, they can still self-respond to the census through September 30. Public facilities such as libraries, schools, and community centers were expected to serve as outreach locations for 2020 Census self-response. At libraries, for example, people without access to the internet or a computer could learn about the census and use a computer to respond online. However, due to the coronavirus pandemic, many of these facilities are closed. Even if a facility is open, people may avoid public places to lower their risk of contracting the coronavirus.

Communities Could Lose Crucial Funding For Services

Official estimates of homelessness in the United States range from 568,000 to more than 1.5 million people (and both are underestimates). Given those staggering numbers, the Census Bureau faces a major challenge in enumerating this large, hard-to-count population. And because of ongoing natural disasters and the economic effects of the coronavirus pandemic, it’s likely that the number of people experiencing homelessness has increased in 2020.

The 2020 Census will be used to reapportion congressional seats, redraw voting districts, and allocate more than $1 trillion in federal funds each year—including funds that assist people experiencing homelessness. Data from the 2020 Census will be used by governments and nonproft organizations to determine needs for roads, hospitals, and other public services. An undercount of people without a permananent address would reduce funds for programs that serve the United States’ most vulnerable residents. Such an undercount will be magnified in local areas with large numbers of people experiencing homelessness and in areas where the count will be most disrupted. Communities hit the hardest by the pandemic and natural disasters could lose crucial funding.

As one of several vital nationwide operations destabilized by the coronavirus pandemic, wildfires, and hurricanes, the 2020 Census faces more challenges than usual in counting people experiencing homelessness. But a complete and accurate count is vital to supporting these populations and the communities that serve them.

References

1U.S. Census Bureau, “Counting the Hard to Count in a Census,” Select Topics in International Censuses, July 2019, https://www.census.gov/content/dam/Census/library/working-papers/2019/demo/Hard-to-Count-Populations-Brief.pdf

new_0918F-ncd-database

PRB Data Center Highlights Role of Youth in Combatting Noncommunicable Diseases

A global database on the prevalence of risk behaviors among youth for noncommunicable diseases (NCDs) highlights the need to focus on young people to tackle the growing NCD epidemic—especially in low- and middle-income countries.

Youth and NCDS Data Center

Population Reference Bureau (PRB), with support from the AstraZeneca Young Health Programme, today launched the Youth and NCDs Data Center, an interactive data and visualization tool focusing on the four key risk factors for NCDs among youth: tobacco use, alcohol use, unhealthy diet, and physical inactivity. The data cover more than 200 countries.

Adoption of the key risk behaviors by young people often sets the stage for them to develop debilitating NCDs later in life, such as cancers, diabetes, cardiovascular diseases, and chronic respiratory diseases. NCDs are already the leading causes of death in every world region except sub-Saharan Africa, and they are expected to be the leading causes of death in that region by 2030.

“NCD risk behaviors are projected to increase further in many low- and middle-income countries due to rapid social and economic changes and sustained efforts by tobacco and alcohol beverage companies to target their products to youth in those countries,” said Toshiko Kaneda, a senior research associate at PRB and project director for the Youth and NCDs Data Center.

“The Data Center will help policymakers and others monitor risk behavior trends around the world and inform effective responses to this growing public health problem,” Kaneda added.

The database includes prevalence data by country for the four NCD risk factors, as well as several mental health indicators from the Global School-Based Student Health Survey, the Global Youth Tobacco Survey, and the Health Behaviour in School-Aged Children Study. PRB will update the Data Center periodically and add data from other sources. The Data Center website also includes a digital feature that provides detailed background information on the four key NCD risk behaviors among youth.

PRB has collaborated with the AstraZeneca Young Health Programme since 2015 to produce regional reports on youth and NCDs in Asia, Africa, the Middle East and North Africa, and Latin America and the Caribbean. The Youth and NCDs Data Center covers countries from these regions, Europe, and North America

Visit the site of the AstraZeneca Young Health Programme to learn more about what they do.

Youth and NCDs

Children Participate in E-Learning Activity at Home

Digital and Economic Divides Put U.S. Children at Greater Educational Risk During the COVID-19 Pandemic

With the number of coronavirus infections surging, school districts across the United States are grappling with decisions about whether and how to re-open this fall. For online learning to be effective, students need access to computers and high-speed internet access, but a new analysis and interactive dashboard by PRB show sharp digital and economic divides among school-age children across states and between racial and ethnic groups.

In 2018, roughly 10% of U.S. children ages 5 to 17 did not have a computer—desktop, laptop, or tablet—at home, and 23% did not have home access to paid high-speed internet.1 Fully one-fourth of all school-age children were lacking either a computer or high-speed internet. Children without computers or high-speed internet at home were already at an educational disadvantage before the COVID-19 pandemic due to the growing need for students to access resources and submit assignments online. Many relied on computers and internet access at school or a local library to complete their work. As the pandemic prompted libraries to close and schools across the country shut down and moved to online instruction, this digital divide has become even more critical.

The Digital Divide Is Wider for Children of Color

A racial and ethnic digital divide also persists. Half of all American Indian/Alaska Native children lack either computers or paid high-speed internet access (or both) at home (see Table 1). More than one-third of Black and Latinx children lack computers or high-speed internet at home, compared with only one-fifth of non-Hispanic white children and one in seven Asian/Native Hawaiian and Other Pacific Islander (NHOPI) children.

Economic barriers contribute to the digital divide between racial and ethnic groups. Poverty rates range from 10% among non-Hispanic white children ages 5 to 17 to 31% among Black children. American Indian/Alaska Native and Latinx children also have poverty rates far above the national average of 17%.

Black, American Indian/Alaska Native, and Latinx school-age children are two to three times more likely to live in households receiving Supplemental Nutrition Assistance Program (SNAP) benefits than white or Asian/Native Hawaiian and Other Pacific Islander children. Nearly 40% of Black and 35% of American Indian/Alaska Native school-age children live in households receiving SNAP benefits. Children whose households receive SNAP benefits are automatically eligible to receive free meals at school—which provide an essential source of daily nutrition for many of these children. With schools shut down, children of color whose families live in poverty and receive SNAP benefits are at much greater risk of going hungry and not receiving the nutrition they need during the pandemic.

TABLE. Children of Color More Likely to Lack Computers and High-Speed Internet at Home

Digital and Economic Divides of Children Ages 5 to 17 by Race and Ethnicity, 2018

wdt_ID Racial or Ethnic Group Lacks Computer, High-Speed Internet Access, or Both Family Income Below 100% of Poverty Household Receives SNAP Benefits
1 American Indian/Alaska Native 50 30 35
2 Black 36 31 39
3 Hispanic or Latino 34 25 28
4 White 20 10 12
5 Asian/NHOPI 14 11 11
6 Two+ Races 19 16 23
7 All Children 25 17 21

Notes: Computers include desktops, laptops, or tablets. All racial groups are non-Hispanic, and Hispanics can be of any race. NHOPI is Native Hawaiian and Other Pacific Islander.
Source: PRB analysis of data from the U.S. Census Bureau’s 2018 American Community Survey Microdata Sample.


View interactive dashboard


Nearly half (47%) of school-age children who live in poverty and 43% of those who receive SNAP benefits lack access to either computers or high-speed internet, compared with only 21% of children who do not receive SNAP benefits and whose family incomes are above the poverty line.

Within every racial and ethnic group, the share of school-age children without access to computers or high-speed internet is much higher for those who receive SNAP benefits and those who live in poverty (see Figure 1). While half of all American Indian/Alaska Native children lack access to computers and high-speed internet, this share jumps to 61% for those receiving SNAP benefits and nearly 70% among those living in poverty. Among non-Hispanic white children, the share without access to computers and high-speed internet nearly doubles from 20% to 39% for those receiving SNAP benefits and from 20% to 41% for those in poverty. Lower levels of economic well-being are widening racial and ethnic gaps in access to computers and high-speed internet.

FIGURE 1. Low Levels of Economic Well-Being Contribute to the Digital Divide

Percent of Children Ages 5 to 17 in Different Racial/Ethnic Groups Lacking Access to Computers or High-Speed Internet by Poverty Status and Receipt of SNAP Benefits, 2018


Notes: All racial groups are non-Hispanic, and Hispanics can be of any race. AIAN is American Indian/Alaska Native. NHOPI is Native Hawaiian and Other Pacific Islander. Without access means without access to either a computer, high-speed internet, or both at home.
Source: PRB analysis of data from the U.S. Census Bureau’s 2018 American Community Survey Microdata Sample.

Digital and Economic Divides Vary Across States

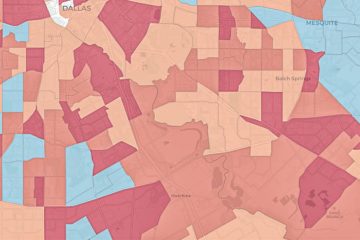
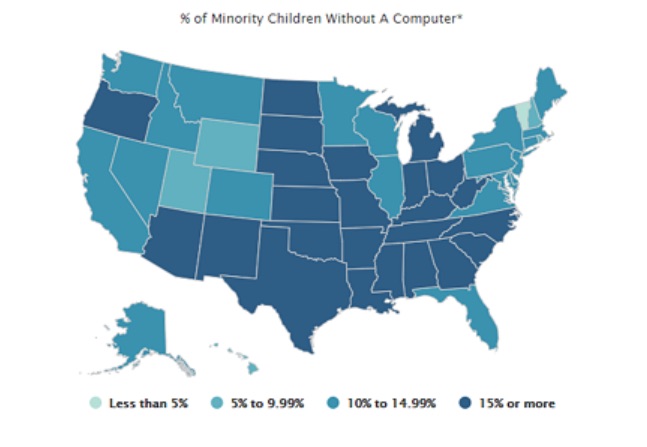
States vary widely in their shares of school-age children without access to computers and high-speed internet, from a low of 13% in New Hampshire to a high of 46% in Mississippi. In eight states—Alabama, Arkansas, Louisiana, Mississippi, New Mexico, Oklahoma, Tennessee, and Texas—more than 30% of children lack either or both computers and internet access, but this count rises to 31 states (including the District of Columbia) for minority children. More than half of school-age minority children in Mississippi, Arkansas, and South Dakota lack access to computers and high-speed internet at home.2

The economic divide is also present in every state. Twelve states (including the District of Columbia) have more than 20% of children ages 5 to 17 living in poverty, and 24 states (including the District of Columbia) have more than 20% of school-age children living in households receiving SNAP benefits. Concentration of poverty and SNAP receipt among school-age minority children is much higher than among non-minority children and is widespread across states. There are only 10 states where the share of minority children living in poverty drops below 20% and only three states (Utah, Vermont, and Wyoming) where the share in households receiving SNAP benefits falls below 20%. Conversely, nine states (Alabama, Arkansas, Louisiana, Mississippi, Ohio, South Carolina, South Dakota, Tennessee, and West Virginia) have one-third or more of minority school-age children living in poverty, and 22 states have more than one-third living in households receiving SNAP benefits.

Reading and Math Proficiency Are Linked to Digital and Economic Divides

Digital and economic divides among school-age children are linked to differences in reading and mathematics proficiency levels across states and between racial and ethnic groups. Proficiency in reading by the end of third grade is an important marker of overall educational development but, beginning in fourth grade, it is also essential for learning other subjects and keeping up academically.3 Children who reach fourth grade without being able to read proficiently are more likely to drop out of high school—reducing their earnings potential and chances for success.4 Similarly, proficiency in mathematics fundamentals makes college attendance and completion more likely, which increases earnings potential.5

In 2019, a shocking two-thirds of all fourth graders in the United States scored below the proficient level in reading, as did two-thirds of eighth graders in math. However, these shares are much higher among children in the racial and ethnic groups with the highest levels of poverty and receipt of SNAP benefits, and the least access to computers and high-speed internet (see Figure 2).

FIGURE 2. Two-Thirds of U.S. Students Score Below Proficient Level in Reading and Mathematics

Reading and Math Proficiency of Children by Race and Ethnicity, 2019


Notes: All racial groups are non-Hispanic. NHOPI is Native Hawaiian and Other Pacific Islander.
Source: PRB analysis of data from the the U.S. Department of Education’s 2019 National Assessment of Education Progress (NAEP) database.

Among Black and American Indian/Alaska Native students, at least 80% of fourth graders scored below the proficient level in reading, and 85% or more of eighth graders scored below the proficient level in math. More than three-quarters of Latinx fourth graders scored below the proficient level in reading and math in 2019. With higher levels of economic well-being and access to computers and high-speed internet, the shares of non-Hispanic white and Asian/Native Hawaiian and Other Pacific Islander children scoring below the proficient level in reading and math are much lower. These gaps in basic reading and math skills make it hard to envision how today’s children can become tomorrow’s productive workers in a globally competitive economy. In outlining his education policy in 2009, President Barack Obama argued that “The relative decline of American education is untenable for our economy, it’s unsustainable for our democracy, and it’s unacceptable for our children—and we cannot afford to let it continue.”6

States also vary widely in reading and math proficiency levels. For example, the share of fourth graders who scored below the proficient level in reading ranged from a low of 55% in Massachusetts to a high of 76% in New Mexico, while at least seven out of 10 children scored below proficient in reading in eight states. The share of eighth graders who scored below proficient in math ranged from a low of 53% in Massachusetts to a high of 79% in New Mexico, while at least seven out of 10 eighth graders scored below the proficient level in math in 17 states in 2019.

The low levels of proficiency in reading and math among children of color are even more concerning given the fact that minorities make up a growing share of the school-age population. The share of school-age children who are members of a racial or ethnic minority ranges from a low of 7% in Vermont to a high of 80% in the District of Columbia. Among minority students, only two states—Hawaii and Vermont—had fewer than seven out of 10 fourth graders who scored below the proficient level in reading. However, no states had fewer than seven out of 10 minority eighth graders who scored below proficient in math. For example, nearly half (48%) of school-age children in Louisiana belong to a racial or ethnic minority group, and 84% of minority fourth graders scored below proficient in reading while 88% of minority eighth graders scored below proficient in math. Taken together, roughly 40% of all fourth and eighth graders in Louisiana had already fallen behind academically even before the COVID-19 pandemic hit and schools closed.

As schools shut down in spring 2020, some districts like Los Angeles Unified tried to address the digital divide by distributing laptops to all students who needed them. In addition, some districts provided internet access to students without it by distributing hot spots or data plans. However, these solutions were not economically feasible in many districts serving low-income communities of color such as Prince George’s County Public Schools in Maryland. With 10 of the 15 largest school districts already deciding to begin the new school year online as of early August, reducing the digital divide and providing free and reduced-price meals for children who need them has become a daunting challenge across the country.

Unemployment rates remain at record highs, and with the supplemental $600 unemployment payments ending and Congress unable to agree on a new stimulus package, poverty levels and demand for SNAP benefits are both likely to rise this fall. A growing economic divide may further exacerbate the digital divide among school-age children, putting even more students at risk of falling further behind.


References

  1. Includes children who lack either a computer or high-speed internet access, or both.
  2. Minority children include those who are not non-Hispanic white or non-Hispanic Asian/Native Hawaiian and Other Pacific Islander.
  3. Annie E. Casey Foundation, Early Warning! Why Reading by the End of Third Grade Matters (Baltimore, MD: Annie E. Casey Foundation, 2010).
  4. Annie E. Casey Foundation, Early Warning Confirmed: A Research Update on Third-Grade Reading (Baltimore, MD: Annie E. Casey Foundation, 2013).
  5. Annie E. Casey Foundation, Race for Results: Building a path to opportunity for all children, KIDS COUNT Policy Report (Baltimore, MD: Annie E. Casey Foundation, 2014).
  6. https://obamawhitehouse.archives.gov/the-press-office/remarks-president-united-states-hispanic-chamber-commerce.
New_0820f-incarceration

When a Parent Is Incarcerated, Partners and Children Also Pay a Price

“We live in a country where we have huge numbers of children exposed to parental incarceration. When we talk about the need to reform the criminal justice and mass incarceration systems, we also need to talk about the unintended victims of the current system,” says Christine Leibbrand of the University of Washington. “Incarceration exposes families to poverty and disadvantage, and the system can self-perpetuate inequality.”

About 3.5% of U.S. children under age 18—or one child in every classroom of about 29 students—had a parent behind bars in 2015, mainly their fathers.1

Black children were more than five times more likely than white children to be separated from a parent by incarceration, report sociologists Bryan Sykes of University of California, Irvine and Becky Pettit of University of Texas at Austin. These patterns reflect a system that disproportionately imprisons disadvantaged and minority men, they argue.

A growing body of research documents the toll U.S. incarceration takes on the families of those imprisoned, widening disparities and exacerbating existing disadvantages. New research supported by the Eunice Kennedy Shriver National Institute of Child Health and Human Development provides further evidence on the wide-ranging ways a parent’s incarceration shapes the lives and life chances of their partners and children, from the neighborhoods where they live to the levels of adversity their children experience.

Children of Incarcerated Fathers Are More Likely to Live in High-Poverty Neighborhoods and Move More Often

Children whose fathers were incarcerated move more frequently and live in neighborhoods that are more socioeconomically disadvantaged than their peers whose fathers have never been in prison, find Leibbrand and Erin Carll of the University of Washington, Angela Bruns of the University of Michigan now at Gonzaga University, and Hedwig Lee of Washington University in St. Louis.2

Using data from the national Fragile Families and Child Wellbeing Study—research following thousands of families in 20 large U.S. cities since 1998—the team examined the neighborhoods of children whose fathers were in prison or recently released. Families with a father currently or recently in prison tend to live in neighborhoods with higher percentages of residents who are single mothers, receive public assistance, lack a high school diploma, and live below the poverty line, they show.

The financial hardship families with imprisoned members face, researchers say, perpetuates what they call “downward mobility.” A father in prison is one less wage earner at home or paying child support. Families with limited income have fewer choices of where to live, they may move often, and the neighborhoods they end up in may be marked by lower quality schools, greater unemployment, and higher rates of crime and violence, Leibbrand and her colleagues report.

“When we think about where people live or move to, we think of people weighing the pros and cons of different places. That’s far too simple. Many families may be forced to move because of eviction or budget constraints, for example, and these forced moves are often to worse neighborhoods where families have little choice of where they would like to live,” says Leibbrand.

Mothers With a Partner in Prison Are More Likely to Hold Multiple Jobs

Mothers with incarcerated partners are more likely to work multiple jobs than women in otherwise similar circumstances, finds Bruns in another study.3

Partner incarceration is linked to additional employment—a third shift—on top of the paid work and caregiving women already do, she finds, based on analysis of Fragile Families and Child Wellbeing Study data.

An additional job may cover basic expenses but also compounds the burden that women with incarcerated partners already shoulder, she points out.

“Staying in touch and supporting an inmate—responding to his requests for food, clothing and books, preparing packages to the correctional institution’s specifications, coordinating family member visits, and keeping up with legal cases and appeals—can feel like a second job in and of itself,” explains Bruns.

Mothers with partners who are incarcerated usually have sole responsibility for children who may be “struggling with the absence of their fathers,” according to Bruns. Holding multiple jobs is also a known stressor that could raise mothers’ risk of stress-related health conditions.

Low-skilled women are often stuck in low-wage, dead-end jobs that can barely pay the bills, she asserts.

“Balancing multiple work roles in addition to family member incarceration may keep women from going to school or participating in other activities that improve their socioeconomic standing over the long-term,” writes Bruns.

Youth With a Parent in Prison Face More Trauma and Adversity

Youth ages 11 to 17 who experience the incarceration of a parent are more likely to have behavioral problems or mental health issues than their counterparts whose parents have never been jailed, Samantha J. Boch, Barbara L. Warren, and Jodi L. Ford of Ohio State University show.4

The team finds that household poverty plays a role, as does the number of traumatic events the young person has experienced, including homelessness, eviction, foster care, and serious injury or death in the family. Overall, they find that youth who deal with the incarceration of a parent experience three times as many adverse childhood experiences (ACEs) as their unaffected peers.

The researchers base their analysis on interviews with more than 600 parents or other caregivers participating in the Adolescent Development in Context study, a representative sample of Columbus, Ohio, and its surrounding suburbs.

The behavioral problems and mental health issues exhibited more frequently in children who experience a parent’s incarceration include poor attention, excessive anxiety, and externalizing behaviors such as rule breaking, temper outbursts, and property destruction, the analysis finds.

The researchers examined a wide-ranging set of 30 ACEs that includes aspects of financial distress and household churning or instability such as changes in household composition (for example, when a parent or parent’s new partner leaves or joins the household or when a child goes to live with grandparents) and residential moves.

“Well-documented research investigating the cumulative effect of ACEs indicates that youth exposed to parental incarceration may have a much greater likelihood for engaging in maladaptive coping behaviors (such as cigarette, alcohol, and illicit drug use, or violent delinquent behaviors) and experiencing depression, anxiety and post-traumatic stress disorder across the lifespan,” the researchers report.

They argue that mental health providers should view a parent’s incarceration as an important consideration of the child’s and family’s well-being that warrants continued observation, support, and follow-up. More research is needed to determine the best ways to screen and identify these youths using non-stigmatizing approaches that build on their strengths, they suggest. 

A Parent’s Incarceration Can Shape a Child’s Identity and Influence Anti-Social Behavior

Among young adults with an incarcerated parent, those who had a high need for parental approval were more likely to identify themselves as a troublemaker or partier during young adulthood than those who were emotionally independent, a recent study finds.5

Self-identities influence behavior, including criminal activity, making understanding the precursors of self-identity important to interventions designed to improve the life prospects of children with incarcerated parents, according to the researchers Jessica G. Finkeldey of the State University of New York at Fredonia, and Monica A. Longmore, Peggy C. Giordano, and Wendy D. Manning of Bowling Green State University.

The team examined publicly available incarceration records and analyzed data from the Toledo Adolescent Relationships Study, a regional survey of more than 900 men and women ages 18 to 28 interviewed five times between 2001 and 2011.

Developing “high emotional independence, or values, beliefs, and identities in contrast to and separate from an incarcerated parent,” may set young adults on a path shaped by different choices than those made by their incarcerated parent, the researchers suggest.

“It is possible that exposing children of incarcerated parents to positive role models and mentors, such as through mentorship programs, might help to reduce the transmission of antisocial identities and behaviors and should be investigated,” says Finkeldey.


This article was produced under a grant from the Eunice Kennedy Shriver National Institute of Child Health and Human Development (NICHD). The work of researchers from the following NICHD-funded population dynamics research centers was highlighted in this article: University of Washington, University of Michigan, Ohio State University, Bowling Green State University, and University of Texas at Austin.


References

  1. Bryan L. Sykes and Becky Pettit, “Measuring the Exposure of Parents and Children to Incarceration,” in Handbook on Children with Incarcerated Parents, ed. J. Mark Eddy and J. Poehlmann-Tynan, (Geneva: Springer, 2019): 11-23.
  2. Christine Leibbrand et al. “Barring Progress: The Influence of Parental Incarceration on Families’ Neighborhood Attainment,” Social Science Research 84 (2019): 102321
  3. Angela Bruns, “The Third Shift: Multiple Job Holding and the Incarceration of Women’s Partners,” Social Science Research 80 (2019): 202-15.
  4. Samantha J. Boch, Barbara L. Warren, and Jodi L. Ford, “Attention, Externalizing, and Internalizing Problems of Youth Exposed to Parental Incarceration,” Issues in Mental Health Nursing 40, no. 6 (2019): 466-75.
  5. Jessica G. Finkeldey et al. “Identifying as a Troublemaker/Partier: The Influence of Parental Incarceration and Emotional Independence,” Journal of Child and Family Studies 29, no. 3 (2020): 802-16.