New_1120f-cohabiting

Cohabiting Couples in the United States Are Staying Together Longer but Fewer Are Marrying

More unmarried couples today are living together, and doing so for longer than in the past, but fewer of these relationships lead to marriage, new research finds. This change may in part reflect shifting attitudes toward cohabitation, and it results in more separations and re-partnering during young adulthood.

Most young women today will live with a romantic partner at least once, compared with just one-third of young women in the late 1980s.1 During that decade, most cohabiting relationships were short-lived and frequently led to marriage.

The new research, conducted by graduate students and faculty at the Center for Family and Demographic Research at Bowling Green State University, examined how cohabitation and marriage patterns have changed for young women over the past four decades. Their research was supported by the Eunice Kennedy Shriver National Institute of Child Health and Human Development (NICHD).

In their study, Esther Lamidi, now at the University of Colorado Colorado Springs, and colleagues Wendy Manning and Susan Brown at Bowling Green, drew on data from the National Survey of Family Growth (NSFG) to compare women ages 15 to 39 who lived with a first romantic partner in 1983-1988 and in 2006-2013.They examined changes in whether couples who lived together had married or split up within five years.

They found that while cohabiting relationships are still relatively short-lived, couples today are cohabiting longer—increasing from about 12 months in the 1983-1988 cohabitation cohort to 18 months in the later cohort—and that this longer duration is linked to couples delaying or forgoing marriage altogether. After five years, similar shares of women in both cohorts were still living with their partner, but the distribution of those still cohabiting as compared to those who had married had shifted. Among the early cohort, 23% of women were still cohabiting five years later, and 42% had married their partner. These shares were reversed among the later cohort—43% were still cohabiting and only 22% had married.

Women With Less Education Experience More Changes in Cohabitation

Over the past five decades, changes in family behaviors such as declining rates of marriage have been more pronounced among women with less education compared with women who have more education. Lamidi and her colleagues confirmed this divergence—similar to what’s been observed in other family behaviors and frequently termed “diverging destinies”—when they examined patterns of cohabitation across different sociodemographic groups.

Their analysis found that the more recent cohort was much less likely to marry their cohabiting partner, and while this pattern was observed across all sociodemographic groups, it occurred more frequently among women with less education.

After accounting for women’s educational attainment, their results show that between the two cohorts only women with less than a college education experienced a decline in marrying their cohabiting partner. In addition, women having one or more children while cohabiting—an occurrence more common among women with less education—delayed or inhibited marriage more for the later cohort than the earlier cohort, they found.

Cohabitation Changes Reveal a Widening Social Class Divide

Sociodemographic characteristics are associated with the pathways out of cohabitation—break ups or marriages—and changes among the cohabiting population’s characteristics can be reflected in changes in cohabitation outcomes. Yet while the researchers noted that the cohabiting population grew in size, became more racially and ethnically diverse and more highly educated, and had more births while living together, they found these compositional changes had little impact on the changes in cohabitation outcomes across the two cohorts.

What does this finding mean? The researchers conclude that the limited impact of population composition changes on cohabitation outcomes, combined with the decline in marrying a cohabiting partner among women with less education, suggests that the social class divide in the American family appears to be widening.

Their findings also “diminish the traditional view of cohabitation as a prelude to marriage” for women with less education and show, particularly for this population, that “cohabitation is increasingly serving a role similar to that of traditional marriage in offering a viable context for childbearing and child-rearing.”

Young Women Today Are Increasingly Likely to Experience a Breakup

Although cohabiting relationships may be lasting longer, they remain relatively unstable. Kasey Eickmeyer, now at the Center for Policing Equity, reports, “Millennials experienced more relationship instability during young adulthood than earlier birth cohorts of women.” She found that cohabitation experience accounted for this instability.

Eickmeyer asked whether young women see their intimate live-in relationships (either marriage or cohabitation) end more frequently today than earlier generations.3 She analyzed data from multiple cycles of the NSFG to examine women’s experience of ending marriages and cohabiting relationships when they were ages 18 to 25 across several five-year birth cohorts from 1960 to 1985.

She found that among women who had ever married or cohabited, the share breaking up with a live-in partner increased from 31% among women born between 1960 and 1964 to 44% among women born in 1985 to 1989.

Cohabitation explains this increasing likelihood of experiencing a breakup. Compared to women in the 1985-1989 birth cohort, women in the earlier birth cohorts from 1960-1964 through 1975-1979 were significantly less likely to have one or more live-in partnerships end. Once Eickmeyer accounted for women’s cohabitation experience, she found that young women’s increased likelihood of having an intimate partnership end is because union formation during young adulthood shifted from marriage—a relatively stable union—to cohabitation, a relatively unstable union.

More Breakups and Re-Partnering in Young Adulthood Suggest Changing Attitudes About Cohabitation

As more young women enter into and end cohabiting relationships, they have more opportunities to live with multiple partners in a pattern of serial cohabitation. The growing practice of serial cohabitation reflects in part changing attitudes about couples living together without marriage.

Eickmeyer and Wendy Manning wanted to know whether contemporary young adult women who had ever cohabited are more likely to re-partner than prior cohorts of young women.4 Using data from the 2002 and 2006-2013 NSFG, they compared the cohabitation experience of young women ages 16 to 28 across five-year birth cohorts beginning in 1960 through 1980 to examine trends in serial cohabitation.

They found that early Millennial women (born 1980-1984) were 53% more likely to live with more than one romantic partner during young adulthood compared with the late Baby Boomers (born 1960-1964), even after taking into account sociodemographic characteristics such as race and ethnicity and educational level, and relationship characteristics such as their age when their first cohabiting relationship ended and whether they had children.

Not only were early Millennial women more likely to live with more than one partner without marriage, they also formed subsequent cohabiting relationships more quickly than the late Baby Boomers—dropping from nearly four years between live-in relationships to just over two years.

The characteristics most strongly associated with serial cohabitation—such as identifying as non-Hispanic white, having less than a college education, and growing up with a single parent—remained stable across birth cohorts, Eickmeyer and Manning found. And, much like the cohabiting population, the composition of women who had previously lived with a partner changed across cohorts, but this shift does not explain the increase in serial cohabitation.

The researchers conclude that the increase stems from more young adults cohabiting, the continued instability of cohabiting relationships, the increasing length of time between first cohabitation and first marriage, and the growing acceptance of cohabitation during young adulthood.

Their findings highlight the instability in many contemporary young adults’ lives and the increasing role cohabitation plays in relationship churning. Although multiple live-in romantic relationships could have negative consequences for young adults’ well-being (and any children they may have), Eickmeyer and Manning suggest “that young adult relationships may be evolving, and young women may be learning to end coresidential relationships that are not working.”


This article was produced under a grant from the Eunice Kennedy Shriver National Institute of Child Health and Human Development (NICHD). The work of researchers from the NICHD-funded population dynamics research center at Bowling Green State University (P2CHD050959) was highlighted in this article.


References

  1. Paul Hemez and Wendy D. Manning, Twenty-Five Years of Change in Cohabitation in the U.S., 1987-2013, National Center for Family and Marriage Research Family Profiles, No. FP-17-02 (2017), http://www.bgsu.edu/ncfmr/resources/data/family-profiles/hemez-manning-25-years-change-cohabitation-fp-17-02.html
  2. Esther O. Lamidi, Wendy D. Manning, and Susan L. Brown, “Change in the Stability of First Premarital Cohabitation Among Women in the United States, 1983-2013,” Demography, 56 (2019): 427-50.
  3. Kasey J. Eickmeyer, “Cohort Trends in Union Dissolution During Young Adulthood,” Journal of Marriage and Family 81 (2019): 760-70.
  4. Kasey J. Eickmeyer and Wendy D. Manning, “Serial Cohabitation in Young Adulthood: Baby Boomers to Millennials,” Journal of Marriage and Family 80 (2018): 826-40.
new_0920f-homelessness

How Many People in the United States Are Experiencing Homelessness?

The economic effects of the coronavirus pandemic in the United States include an unemployment rate higher than at any time in the country’s history—including the Great Depression. As an unprecedented number of Americans struggle with job loss, many of them may lose their homes. Many others may lose their homes due to natural disasters or other crises. As these events fluctuate, so too may the number of people without a home. So how do we know how many people are experiencing homelessness in the United States?

We don’t. We have only widely differing estimates based on varying methodologies and definitions.

Estimates of homelessness in the United States range from fewer than 600,000 to more than 1.5 million people, and the estimates vary by source. The two key sources of data—the U.S. Department of Housing and Urban Development Point-in-Time Count, and the National Center for Education Statistics Count of Students Experiencing Homelessness—vary greatly in their coverage and in their annual estimates.

The HUD Point-in-Time Count—One Night Only

The U.S. Department of Housing and Urban Development (HUD) captures data on people experiencing homelessness through point-in-time (PIT) counts. PIT counts take place nationwide and are conducted on one night in the last week of January each year. HUD mandates that programs that receive funding to assist people experiencing homelessness, called Continuum of Care Programs (CoC), organize a count in their jurisdiction. The count itself is conducted by project staff and community volunteers. The CoC can choose to conduct their count either through a complete count or a sample. The sample method must follow HUD standards for counting and estimating the population.

The PIT counts both sheltered and unsheltered people experiencing homelessness. People included in the sheltered count sleep in shelters, transitional housing, or hotels and motels paid for by charities or government programs. Those who sleep in cars, parks, encampments, and other places not designated for regular sleeping are included in the unsheltered count.

HUD does not consider people who are temporarily doubled up with family or friends as homeless. This standard misses many people who lack permanent housing. In particular, parents with children may be less likely to seek group shelters and interact with authorities for fear of losing custody of their children.1

HUD provides a one-night snapshot of an experience that is often fluid for people who experience homelessness. The count does not include people who fall in and out of homelessness throughout the year. Additionally, changes in the count from year to year may reflect either an actual change or a change in the count’s accuracy. HUD itself cautions against drawing conclusions or trends from the count since data quality review is limited, reliability and consistency differ between CoCs, and methods may change between reporting periods.

Given these limitations, it is likely that the PIT undercounts the number of people experiencing homelesseness. These estimates can best be thought of as a snapshot of the minimum number of people who are homeless in a community, a state, or the nation.

The 2019 PIT count identified about 568,000 people experiencing homelessness. The states with the largest populations of people experiencing homelessness were California (151,000), New York (92,000), and Florida (28,000).

The NCES Count of Students Experiencing Homelessness—School Children Only

Another source of data on the number of people experiencing homelessness is the National Center for Education Statistics (NCES). Housed within the U.S. Department of Education, NCES compiles data on public school students experiencing homelessness during the school year. The count uses local school enrollment data that are submitted to the states and then reported to the Department of Education.

Unlike the one-night PIT count, the NCES count covers the entire school year and more accurately captures the fluid nature of homelessness. NCES defines students experiencing homelessness more broadly than the PIT count to include youth who are doubled up in housing and other temporary circumstances. However, this count includes only public school students and does not track adults experiencing homelessness. This count also does not include children who have dropped out of school, children in private schools, young children who are not yet enrolled in school, and children who experience homelessness outside of the school year.

According to NCES, more than 1.5 million students experienced homelessness during the 2017-2018 school year. This estimate is more than double the PIT count for 2018.More than 390,000 of these students were living at a shelter, staying at a hotel or motel, or were unsheltered. The remainder were doubled-up. California (263,000), Texas (231,000), and New York (153,000) had the largest populations of students experiencing homelessness during the 2017-2018 school year.

Which Estimate Is Best?

Both the PIT and NCES counts have advantages and challenges. Table 1 provides a comparison of the two estimates.

Table 1. Comparison of Data Sources on Homelessness in the United States

wdt_ID Data Source Type Universe Excludes Time Period
1 HUD Point-in-Time Count Enumeration (at selected locations) Entire population in selected communities Anyone doubled-up; communities not on HUD’s list One night (last week of January)
2 NCES Education for Homeless Children and Youth Administrative records Public school students Anyone not enrolled in public school School year

Note: The HUD Point-in-Time counts occur only in some communities and likely underestimate the population experiencing homelessness.

The PIT and NCES estimates both have well-documented undercount issues. NCES does not count adults or children not enrolled in school. PIT does not count anyone who is doubled-up. Data users should be aware of these limitations when working with either data source.

Crowds in a stadium with cots.

Disasters Raise Risk of a Homeless Undercount in 2020 Census

Counting people experiencing homelessness is not an easy task during any census, and the coronavirus pandemic, wildfires, and hurricanes have made the process even more complicated in 2020.

Despite rigorous efforts by the Census Bureau to count everyone in the United States, many people experiencing homelessness are likely to be missed in the 2020 Census count. The Census Bureau had already identified people experiencing homelessness as a hard-to-count population because they have more difficulty accessing the typical modes of responding to the survey—by internet, phone, or mail—than people with a permanent address.1 Then the pandemic’s effects on everyday life delayed census field operations. The rescheduled dates to count people experiencing homelessness—Sept. 22-24, 2020—place count efforts in the middle of peak wildfire and hurricane seasons. This confluence of crises magnifies the challenge of conducting a complete and accurate count of an often-overlooked population.

Counting People Where They Sleep

The goal of the 2020 Census is to count everyone once, only once, and at their “usual residence.” Usual residence is defined as the location where a person lives and sleeps most of the time. If people do not have a permanent home, they should be counted at the location where they are on Census Day, April 1, 2020. For people experiencing homelessness, their location on Census Day may be unsheltered (including living in a vehicle), at a shelter or transitional housing, at a hotel or motel, or doubled up in another household.

People who are doubled-up on Census Day should be counted in the household where they are staying on that day, and the census questionnaire includes prompts to help ensure everyone is counted. But the Census Bureau has identified the doubled-up population as hard-to-count because, despite prompts in the questionnaire, they may still be missed.

For people staying at shelters and those who are unsheltered, the Census Bureau aims to count people at the locations where they receive services, like soup kitchens, shelters, and mobile food vans, and at targeted outdoor locations like parks, under bridges, at bus depots, and other areas. To identify such count locations, the Census Bureau uses a combination of internet research and outreach to local elected officials and advocacy organizations.

Due to the coronavirus pandemic, however, both service-based and outdoor count operations were delayed. Service-based enumeration, originally scheduled for March 30 to April 1, has been delayed to September 22-24. The outdoor count, originally scheduled for April 1, will now take place from September 23-24. Because of these delays, people will no longer be counted where they were on April 1 but rather where they are staying in September. This shift—and the reasons for it—raise questions: Are the same service locations open? Are the same people using those services? Are people avoiding services to reduce their risk of exposure to the coronavirus that causes COVID-19, making them even harder to enumerate? All of these issues complicate the count of people experiencing homelessness in 2020.

Counting During Crises Heightens the Risk of Undercount

The shift in operations has also moved the count into peak hurricane and wildfire seasons. Just as census enumerators are preparing to count people outdoors and at service-based locations, serious natural disasters are ravaging parts of the nation. Wildfires have led to hazardous air quality across much of the West Coast, forcing many people to stay indoors. Hurricane Sally, which hit the Gulf Coast on Sept. 16, 2020, has severely damaged infrastructure across several states. People who would normally be outdoors may not be in their “usual” locations, and services may be dramatically disrupted in areas that have been affected by disasters.

The closure of libraries and other community facilities further compounds the challenge of counting. If people experiencing homelessness are missed in service-based and unsheltered enumeration, they can still self-respond to the census through September 30. Public facilities such as libraries, schools, and community centers were expected to serve as outreach locations for 2020 Census self-response. At libraries, for example, people without access to the internet or a computer could learn about the census and use a computer to respond online. However, due to the coronavirus pandemic, many of these facilities are closed. Even if a facility is open, people may avoid public places to lower their risk of contracting the coronavirus.

Communities Could Lose Crucial Funding For Services

Official estimates of homelessness in the United States range from 568,000 to more than 1.5 million people (and both are underestimates). Given those staggering numbers, the Census Bureau faces a major challenge in enumerating this large, hard-to-count population. And because of ongoing natural disasters and the economic effects of the coronavirus pandemic, it’s likely that the number of people experiencing homelessness has increased in 2020.

The 2020 Census will be used to reapportion congressional seats, redraw voting districts, and allocate more than $1 trillion in federal funds each year—including funds that assist people experiencing homelessness. Data from the 2020 Census will be used by governments and nonproft organizations to determine needs for roads, hospitals, and other public services. An undercount of people without a permananent address would reduce funds for programs that serve the United States’ most vulnerable residents. Such an undercount will be magnified in local areas with large numbers of people experiencing homelessness and in areas where the count will be most disrupted. Communities hit the hardest by the pandemic and natural disasters could lose crucial funding.

As one of several vital nationwide operations destabilized by the coronavirus pandemic, wildfires, and hurricanes, the 2020 Census faces more challenges than usual in counting people experiencing homelessness. But a complete and accurate count is vital to supporting these populations and the communities that serve them.

References

1U.S. Census Bureau, “Counting the Hard to Count in a Census,” Select Topics in International Censuses, July 2019, https://www.census.gov/content/dam/Census/library/working-papers/2019/demo/Hard-to-Count-Populations-Brief.pdf

new_0918F-ncd-database

PRB Data Center Highlights Role of Youth in Combatting Noncommunicable Diseases

A global database on the prevalence of risk behaviors among youth for noncommunicable diseases (NCDs) highlights the need to focus on young people to tackle the growing NCD epidemic—especially in low- and middle-income countries.

Youth and NCDS Data Center

Population Reference Bureau (PRB), with support from the AstraZeneca Young Health Programme, today launched the Youth and NCDs Data Center, an interactive data and visualization tool focusing on the four key risk factors for NCDs among youth: tobacco use, alcohol use, unhealthy diet, and physical inactivity. The data cover more than 200 countries.

Adoption of the key risk behaviors by young people often sets the stage for them to develop debilitating NCDs later in life, such as cancers, diabetes, cardiovascular diseases, and chronic respiratory diseases. NCDs are already the leading causes of death in every world region except sub-Saharan Africa, and they are expected to be the leading causes of death in that region by 2030.

“NCD risk behaviors are projected to increase further in many low- and middle-income countries due to rapid social and economic changes and sustained efforts by tobacco and alcohol beverage companies to target their products to youth in those countries,” said Toshiko Kaneda, a senior research associate at PRB and project director for the Youth and NCDs Data Center.

“The Data Center will help policymakers and others monitor risk behavior trends around the world and inform effective responses to this growing public health problem,” Kaneda added.

The database includes prevalence data by country for the four NCD risk factors, as well as several mental health indicators from the Global School-Based Student Health Survey, the Global Youth Tobacco Survey, and the Health Behaviour in School-Aged Children Study. PRB will update the Data Center periodically and add data from other sources. The Data Center website also includes a digital feature that provides detailed background information on the four key NCD risk behaviors among youth.

PRB has collaborated with the AstraZeneca Young Health Programme since 2015 to produce regional reports on youth and NCDs in Asia, Africa, the Middle East and North Africa, and Latin America and the Caribbean. The Youth and NCDs Data Center covers countries from these regions, Europe, and North America

Visit the site of the AstraZeneca Young Health Programme to learn more about what they do.

Youth and NCDs

Children Participate in E-Learning Activity at Home

Digital and Economic Divides Put U.S. Children at Greater Educational Risk During the COVID-19 Pandemic

With the number of coronavirus infections surging, school districts across the United States are grappling with decisions about whether and how to re-open this fall. For online learning to be effective, students need access to computers and high-speed internet access, but a new analysis and interactive dashboard by PRB show sharp digital and economic divides among school-age children across states and between racial and ethnic groups.

In 2018, roughly 10% of U.S. children ages 5 to 17 did not have a computer—desktop, laptop, or tablet—at home, and 23% did not have home access to paid high-speed internet.1 Fully one-fourth of all school-age children were lacking either a computer or high-speed internet. Children without computers or high-speed internet at home were already at an educational disadvantage before the COVID-19 pandemic due to the growing need for students to access resources and submit assignments online. Many relied on computers and internet access at school or a local library to complete their work. As the pandemic prompted libraries to close and schools across the country shut down and moved to online instruction, this digital divide has become even more critical.

The Digital Divide Is Wider for Children of Color

A racial and ethnic digital divide also persists. Half of all American Indian/Alaska Native children lack either computers or paid high-speed internet access (or both) at home (see Table 1). More than one-third of Black and Latinx children lack computers or high-speed internet at home, compared with only one-fifth of non-Hispanic white children and one in seven Asian/Native Hawaiian and Other Pacific Islander (NHOPI) children.

Economic barriers contribute to the digital divide between racial and ethnic groups. Poverty rates range from 10% among non-Hispanic white children ages 5 to 17 to 31% among Black children. American Indian/Alaska Native and Latinx children also have poverty rates far above the national average of 17%.

Black, American Indian/Alaska Native, and Latinx school-age children are two to three times more likely to live in households receiving Supplemental Nutrition Assistance Program (SNAP) benefits than white or Asian/Native Hawaiian and Other Pacific Islander children. Nearly 40% of Black and 35% of American Indian/Alaska Native school-age children live in households receiving SNAP benefits. Children whose households receive SNAP benefits are automatically eligible to receive free meals at school—which provide an essential source of daily nutrition for many of these children. With schools shut down, children of color whose families live in poverty and receive SNAP benefits are at much greater risk of going hungry and not receiving the nutrition they need during the pandemic.

TABLE. Children of Color More Likely to Lack Computers and High-Speed Internet at Home

Digital and Economic Divides of Children Ages 5 to 17 by Race and Ethnicity, 2018

wdt_ID Racial or Ethnic Group Lacks Computer, High-Speed Internet Access, or Both Family Income Below 100% of Poverty Household Receives SNAP Benefits
1 American Indian/Alaska Native 50 30 35
2 Black 36 31 39
3 Hispanic or Latino 34 25 28
4 White 20 10 12
5 Asian/NHOPI 14 11 11
6 Two+ Races 19 16 23
7 All Children 25 17 21

Notes: Computers include desktops, laptops, or tablets. All racial groups are non-Hispanic, and Hispanics can be of any race. NHOPI is Native Hawaiian and Other Pacific Islander.
Source: PRB analysis of data from the U.S. Census Bureau’s 2018 American Community Survey Microdata Sample.


View interactive dashboard


Nearly half (47%) of school-age children who live in poverty and 43% of those who receive SNAP benefits lack access to either computers or high-speed internet, compared with only 21% of children who do not receive SNAP benefits and whose family incomes are above the poverty line.

Within every racial and ethnic group, the share of school-age children without access to computers or high-speed internet is much higher for those who receive SNAP benefits and those who live in poverty (see Figure 1). While half of all American Indian/Alaska Native children lack access to computers and high-speed internet, this share jumps to 61% for those receiving SNAP benefits and nearly 70% among those living in poverty. Among non-Hispanic white children, the share without access to computers and high-speed internet nearly doubles from 20% to 39% for those receiving SNAP benefits and from 20% to 41% for those in poverty. Lower levels of economic well-being are widening racial and ethnic gaps in access to computers and high-speed internet.

FIGURE 1. Low Levels of Economic Well-Being Contribute to the Digital Divide

Percent of Children Ages 5 to 17 in Different Racial/Ethnic Groups Lacking Access to Computers or High-Speed Internet by Poverty Status and Receipt of SNAP Benefits, 2018


Notes: All racial groups are non-Hispanic, and Hispanics can be of any race. AIAN is American Indian/Alaska Native. NHOPI is Native Hawaiian and Other Pacific Islander. Without access means without access to either a computer, high-speed internet, or both at home.
Source: PRB analysis of data from the U.S. Census Bureau’s 2018 American Community Survey Microdata Sample.

Digital and Economic Divides Vary Across States

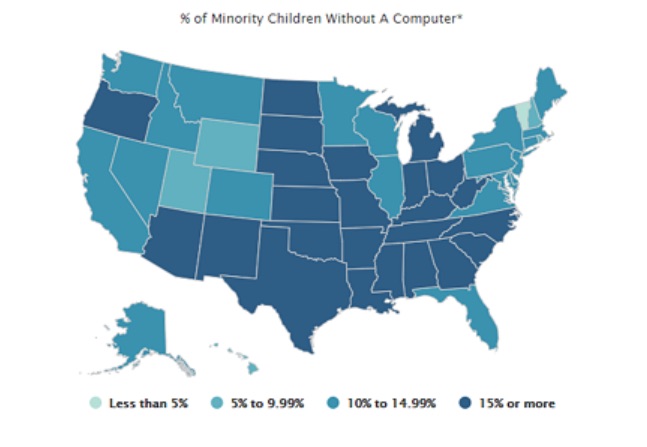
States vary widely in their shares of school-age children without access to computers and high-speed internet, from a low of 13% in New Hampshire to a high of 46% in Mississippi. In eight states—Alabama, Arkansas, Louisiana, Mississippi, New Mexico, Oklahoma, Tennessee, and Texas—more than 30% of children lack either or both computers and internet access, but this count rises to 31 states (including the District of Columbia) for minority children. More than half of school-age minority children in Mississippi, Arkansas, and South Dakota lack access to computers and high-speed internet at home.2

The economic divide is also present in every state. Twelve states (including the District of Columbia) have more than 20% of children ages 5 to 17 living in poverty, and 24 states (including the District of Columbia) have more than 20% of school-age children living in households receiving SNAP benefits. Concentration of poverty and SNAP receipt among school-age minority children is much higher than among non-minority children and is widespread across states. There are only 10 states where the share of minority children living in poverty drops below 20% and only three states (Utah, Vermont, and Wyoming) where the share in households receiving SNAP benefits falls below 20%. Conversely, nine states (Alabama, Arkansas, Louisiana, Mississippi, Ohio, South Carolina, South Dakota, Tennessee, and West Virginia) have one-third or more of minority school-age children living in poverty, and 22 states have more than one-third living in households receiving SNAP benefits.

Reading and Math Proficiency Are Linked to Digital and Economic Divides

Digital and economic divides among school-age children are linked to differences in reading and mathematics proficiency levels across states and between racial and ethnic groups. Proficiency in reading by the end of third grade is an important marker of overall educational development but, beginning in fourth grade, it is also essential for learning other subjects and keeping up academically.3 Children who reach fourth grade without being able to read proficiently are more likely to drop out of high school—reducing their earnings potential and chances for success.4 Similarly, proficiency in mathematics fundamentals makes college attendance and completion more likely, which increases earnings potential.5

In 2019, a shocking two-thirds of all fourth graders in the United States scored below the proficient level in reading, as did two-thirds of eighth graders in math. However, these shares are much higher among children in the racial and ethnic groups with the highest levels of poverty and receipt of SNAP benefits, and the least access to computers and high-speed internet (see Figure 2).

FIGURE 2. Two-Thirds of U.S. Students Score Below Proficient Level in Reading and Mathematics

Reading and Math Proficiency of Children by Race and Ethnicity, 2019


Notes: All racial groups are non-Hispanic. NHOPI is Native Hawaiian and Other Pacific Islander.
Source: PRB analysis of data from the the U.S. Department of Education’s 2019 National Assessment of Education Progress (NAEP) database.

Among Black and American Indian/Alaska Native students, at least 80% of fourth graders scored below the proficient level in reading, and 85% or more of eighth graders scored below the proficient level in math. More than three-quarters of Latinx fourth graders scored below the proficient level in reading and math in 2019. With higher levels of economic well-being and access to computers and high-speed internet, the shares of non-Hispanic white and Asian/Native Hawaiian and Other Pacific Islander children scoring below the proficient level in reading and math are much lower. These gaps in basic reading and math skills make it hard to envision how today’s children can become tomorrow’s productive workers in a globally competitive economy. In outlining his education policy in 2009, President Barack Obama argued that “The relative decline of American education is untenable for our economy, it’s unsustainable for our democracy, and it’s unacceptable for our children—and we cannot afford to let it continue.”6

States also vary widely in reading and math proficiency levels. For example, the share of fourth graders who scored below the proficient level in reading ranged from a low of 55% in Massachusetts to a high of 76% in New Mexico, while at least seven out of 10 children scored below proficient in reading in eight states. The share of eighth graders who scored below proficient in math ranged from a low of 53% in Massachusetts to a high of 79% in New Mexico, while at least seven out of 10 eighth graders scored below the proficient level in math in 17 states in 2019.

The low levels of proficiency in reading and math among children of color are even more concerning given the fact that minorities make up a growing share of the school-age population. The share of school-age children who are members of a racial or ethnic minority ranges from a low of 7% in Vermont to a high of 80% in the District of Columbia. Among minority students, only two states—Hawaii and Vermont—had fewer than seven out of 10 fourth graders who scored below the proficient level in reading. However, no states had fewer than seven out of 10 minority eighth graders who scored below proficient in math. For example, nearly half (48%) of school-age children in Louisiana belong to a racial or ethnic minority group, and 84% of minority fourth graders scored below proficient in reading while 88% of minority eighth graders scored below proficient in math. Taken together, roughly 40% of all fourth and eighth graders in Louisiana had already fallen behind academically even before the COVID-19 pandemic hit and schools closed.

As schools shut down in spring 2020, some districts like Los Angeles Unified tried to address the digital divide by distributing laptops to all students who needed them. In addition, some districts provided internet access to students without it by distributing hot spots or data plans. However, these solutions were not economically feasible in many districts serving low-income communities of color such as Prince George’s County Public Schools in Maryland. With 10 of the 15 largest school districts already deciding to begin the new school year online as of early August, reducing the digital divide and providing free and reduced-price meals for children who need them has become a daunting challenge across the country.

Unemployment rates remain at record highs, and with the supplemental $600 unemployment payments ending and Congress unable to agree on a new stimulus package, poverty levels and demand for SNAP benefits are both likely to rise this fall. A growing economic divide may further exacerbate the digital divide among school-age children, putting even more students at risk of falling further behind.


References

  1. Includes children who lack either a computer or high-speed internet access, or both.
  2. Minority children include those who are not non-Hispanic white or non-Hispanic Asian/Native Hawaiian and Other Pacific Islander.
  3. Annie E. Casey Foundation, Early Warning! Why Reading by the End of Third Grade Matters (Baltimore, MD: Annie E. Casey Foundation, 2010).
  4. Annie E. Casey Foundation, Early Warning Confirmed: A Research Update on Third-Grade Reading (Baltimore, MD: Annie E. Casey Foundation, 2013).
  5. Annie E. Casey Foundation, Race for Results: Building a path to opportunity for all children, KIDS COUNT Policy Report (Baltimore, MD: Annie E. Casey Foundation, 2014).
  6. https://obamawhitehouse.archives.gov/the-press-office/remarks-president-united-states-hispanic-chamber-commerce.
new_0720f-young-adult-struggle

Life on Hold: How the Coronavirus Is Affecting Young People’s Major Life Decisions

The past two decades have been tumultuous for the United States. During the first 20 years of the 21st century, the nation experienced a major terrorist attack, a housing market meltdown, a severe economic recession, a significant downturn in the stock market, and a pandemic that led to the highest unemployment rate since the Great Depression.

The coronavirus and the disease it causes, COVID-19, are affecting all Americans. Older people are most at risk of severe health issues related to the virus, but young adults—ages 25 to 34—may be most vulnerable to its long-term social and economic impacts. Those in their early 30s reached young adulthood during the Great Recession of 2007 to 2009 and experienced one of the most challenging job markets in U.S. history. Now those in their mid-20s are entering prime marriage and family formation years just as the coronavirus pandemic is causing extensive economic and social disruptions.

Even before the crisis hit, more young Americans had been postponing key life events that often mark the transition to adulthood. Fewer young adults in their 20s and 30s are getting married, having children, living independently from their parents, buying homes, and achieving financial independence. Nearly one in five young adults ages 25 to 29 are disconnected from work and school. A growing share of young adults carry high levels of student loan and credit card debt that may cause them to postpone marriage and family formation.1 The pandemic will likely amplify these trends.

The statistics are grim. More than 40 million workers filed for unemployment benefits in the spring of 2020. Millions of young adults work in restaurants and other service-sector jobs that have been heavily affected by stay-at-home orders and social distancing measures. The pandemic is also exacerbating the wide economic disparities between whites and other groups—especially Blacks and Latinos—who are more likely to be working in low-wage jobs with few benefits.

The current health and economic crisis is unprecedented, making it difficult to predict the impact on patterns of marriage, childbearing, homeownership, and living arrangements of young adults in the coming months and years. But we can look back at recent trends for clues.

The Coronavirus Could Prompt Many to Postpone Marriage

While the Great Recession may have forced some young adults to postpone key life transitions—such as finding a full-time job or buying a home—the decline in the proportion who are married is a longer-term trend that predates the economic downturn. It’s hard to gauge whether the decline in marriage during the recession was due to economic factors or just a continuation of previous trends.

The coronavirus may be different. In the short term, it will force millions of young adults to consider postponing marriage until social distancing restrictions are lifted. Longer-term effects on marriage are more difficult to predict.

On the one hand, some young adults—particularly those with less education and lower incomes—may decide to postpone marriage until the economy recovers, which could take years. The “economic prerequisites for entering marriage are higher today than they were for previous generations.”Meeting those requirements—finding a job, achieving some financial independence, accumulating some savings, and perhaps buying a home—may be harder than ever in the current environment, especially for lower-income workers without college degrees.3

The decline in the proportion married among young adults with lower levels of education accelerated during the Great Recession and has continued over the past decade (see Figure 1). The proportion of college graduates who are married has also declined but at a slower pace, which has led to a growing marriage gap between those at different education levels.4

FIGURE 1. Share of Young Americans Ages 25 to 34 Who Are Married (Spouse Present), by Educational Attainment, 2000-2025

Note: Projections are calculated by applying the average rate of change during the Great Recession and its aftermath to future years.
Source: IPUMS-Current Population Survey, University of Minnesota, www.ipums.org.

Between 2000 and 2019, the proportion of young adults without bachelor’s degrees who were married dropped 16 percentage points to 37%. But for college graduates, the proportion dropped just 10 percentage points to 46%. The fallout from the coronavirus could exacerbate the marriage gap for people at opposite ends of the education ladder.

If patterns since the Great Recession continue, about one-third (32%) of young adults without bachelor’s degrees may be married by 2025, compared with 42% of young adult college graduates.

On the other hand, marriage provides an opportunity to pool resources and offers tax and health coverage benefits that may be attractive to some young adults who were on the fence about tying the knot.5 A key factor contributing to the recent decline in marriage rates, especially for less-educated groups, has been the rise in women’s earnings relative to men.6 As women’s wages have increased, fewer women have relied on a spouse or partner to provide a paycheck. However, the current economic crisis may disproportionately affect women, who are more likely to be employed in service-sector jobs. A rise in “marriageable men” relative to women could potentially lead to an increase in the proportion of young adults who marry in the coming years.7

Cohabitation Expected to Increase Among Young Adults

As marriage rates among young adults have declined in recent years, cohabitation rates have increased, either as a precursor to or substitute for marriage.

The share of young women ages 25 to 34 living with a partner more than doubled between 2000 and 2019, from 7% to 22% (see Figure 2). For men, cohabiting increased from 8% to 19% during the same period. The share of young adults who have ever cohabited is much higher and increasing. In 1995, nearly half (49%) of women ages 25 to 29 had ever cohabited, but that share rose to 73% in 2011 to 2013.8

FIGURE 2. Share of Young American Men and Women Ages 25 to 34 Living With a Cohabiting Partner, 2000-2025

Notes: A change in methods used to identify cohabiting couples accounts for part of the increase in cohabitation in 2007. Projections are calculated by applying the average rate of change during the Great Recession and its aftermath to future years.
Source: U.S. Census Bureau, Current Population Survey.

Cohabiting relationships in the United States tend to be short, with most couples breaking up or getting married within a few years. Serial cohabitation—a pattern of multiple, nonmarital cohabiting relationships—is also increasingly common, especially among couples with lower levels of education.9

Will more young adults choose to live together because of the coronavirus pandemic’s impact on the economy? In the short term, anecdotal evidence suggests that social distancing measures have “fast-tracked many relationships” among couples forced to choose between living separately indefinitely and moving in together.

Other couples may decide to postpone cohabiting until economic prospects improve. Population Reference Bureau projections indicate that the share of young adult women and men who are cohabiting could rise to 22% and 19%, respectively, by 2025.

U.S. Fertility Rate Is at a Record Low and Could Fall Even Further

Some have speculated that the coronavirus pandemic will lead to a baby boom, with so many couples stuck at home due to social distancing requirements. But the research suggests otherwise.

The U.S. total fertility rate (TFR) has declined during previous economic downturns, and the current economic crisis will likely have a similar impact on births. The TFR fell to low levels during the Great Depression in the 1930s, amid the 1970s oil shock, and with the Great Recession in 2007. Fertility in the United States recently dropped to the lowest level in recorded history, with women having an average of 1.7 births in their lifetime.

The timing of childbearing has also changed. Delays in marriage have in turn resulted in delays in first births. In 2018, the average age of first-time mothers was 27, up from 25 in 2000. By 2016—for the first time in U.S. history—the birth rate among women ages 30 to 34 (103 births per 1,000 women) exceeded that of women ages 25 to 29 (102 births per 1,000 women) (see Figure 3).

FIGURE 3. U.S. Births per 1,000 Women, by Age Group, 2000-2025

Note: Projections are calculated by applying the average rate of change during the Great Recession and its aftermath to future years.
Source: U.S. Centers for Disease Control and Prevention, National Center for Health Statistics.

The economic impact of the coronavirus may cause more young adults to postpone births, leading to further declines in birth rates, especially among women under age 30.

States like Nevada, which relies heavily on tourism, may see bigger declines in fertility than states with more diversified economies. Fertility declines during the Great Recession were greatest in states most impacted by the economic downturn.10

Homeownership Among Young Adults Has Dropped Sharply Since 2007

Searching for a home right now is challenging because of social distancing guidelines, but the longer-term effects of the coronavirus on the housing market could linger for years. Millions of Americans who have been temporarily or permanently laid off may lose income and have to dip into their savings, decreasing their ability to secure a loan or make a down payment on a house. Many existing homeowners may need to sell their homes to help pay the bills.

The homeownership rate among young adults declined with the onset of the subprime mortgage crisis in 2007 and has continued to drop (see Figure 4). Between 2007 and 2019, householders ages 65 and older experienced a modest decline in homeownership (1 percentage point), whereas rates dropped sharply for householders ages 25 to 34 (8 percentage points) and 35 to 64 (9 percentage points).

FIGURE 4. U.S. Homeownership Rates by Age of Householder, 2000-2025

Note: Projections are calculated by applying the average rate of change during the Great Recession and its aftermath to future years.
Source: IPUMS-Current Population Survey, University of Minnesota, www.ipums.org.

Historically, young adults (ages 25 to 34) have had lower homeownership rates than adults ages 65 and older, and the gap between these two groups has increased 4 percentage points from 2000 to 2019. By 2025, this gap could grow even wider, according to PRB’s projections. By 2025, just 34% of householders ages 25 to 34 may be homeowners, compared with 80% of householders ages 65 and older.

Although this trend may suggest a change in housing preferences, more than two-thirds of renters report that they would buy a home if they had the financial resources to do so.11 The decline in homeownership has also been linked to lower rates of marriage and family formation among young adults.12 The share of young men and women ages 25 to 34 living with a spouse dropped from 50% and 57%, respectively, in 2000 to 36% and 45%, respectively, in 2019.13

Wide gaps in homeownership rates also persist across different racial and ethnic groups. During the housing market crisis, owning a home became a liability for many Americans but especially for African Americans and Latinos, who were more likely to have high-cost or subprime mortgages. Black and Latino workers were disproportionately low income prior to the coronavirus pandemic, and the current economic crisis could further impact the ability of Black and Latino young adults to qualify for loans or make their mortgage payments in the coming months.

More Young Adults Are Expected to Live With Parents

Declines in marriage have been accompanied by an increase in young adults—especially men—returning to or remaining in their parents’ homes, and the coronavirus pandemic will likely intensify this trend.

Between 2000 and 2019, the share of young men ages 25 to 34 living with their parents rose from 12% to 22% (see Figure 5). The share of young women living with their parents increased from 8% to 15% during the same period. For both men and women, the proportion who were doubling up with their parents in 2019 was at or near the highest levels since the U.S. Census Bureau first started tracking the measure in 1960.

FIGURE 5. Share of Young American Men and Women Ages 25 to 34 Living With Their Parents, 2000-2025

Note: Projections are calculated by applying the average rate of change during the Great Recession and its aftermath to future years.
Source: U.S. Census Bureau, Current Population Survey.

The rising number of young adults living with their parents, often disconnected from work and school, may lead to further declines in marriage, family formation, and childbearing. About 22% of young men and 15% of young women are projected to be living in their parents’ homes by 2025.

The Effects of the Coronavirus Could Last for Decades

The coronavirus pandemic could be the most significant event that will occur in our lifetime and will likely have long-lasting effects on marriage, family formation, poverty, and health in the United States. Some have pointed to the positive effect of the pandemic on bringing families together, but researchers have also shown that entering the job market during a period of economic turmoil can have long-term, negative consequences for young adults. In midlife, they earn less (while working more), are less likely to be married, are more likely to be childless, and are more likely to die prematurely compared with young adults who enter the workforce during a healthier economy.14 Young adults who entered the job market during the Great Recession are still feeling the impact.

Blacks and Latinos have been disproportionately affected by layoffs due to the pandemic, and the negative effects on Black and Latino young adults will likely linger for years—exacerbating long-standing social, economic, and health inequalities between whites and other racial/ethnic groups.

Right now, life is on hold for millions of Americans. We cannot predict the long-term effects of this crisis, but it’s likely that young adults will be severely impacted by the economic fallout. Making sure these young adults have the resources they need to cover their basic needs and access educational, employment, and training opportunities—both during and after the pandemic—will be an ongoing challenge for federal, state, and local policymakers for many years.

Golden light washes across the scene of a river through the Appalachian mountains

Report Explores Appalachia’s Current Strengths and Vulnerabilities

Appalachian Communities May Be More Vulnerable to the Coronavirus Pandemic’s Health and Schooling Impacts

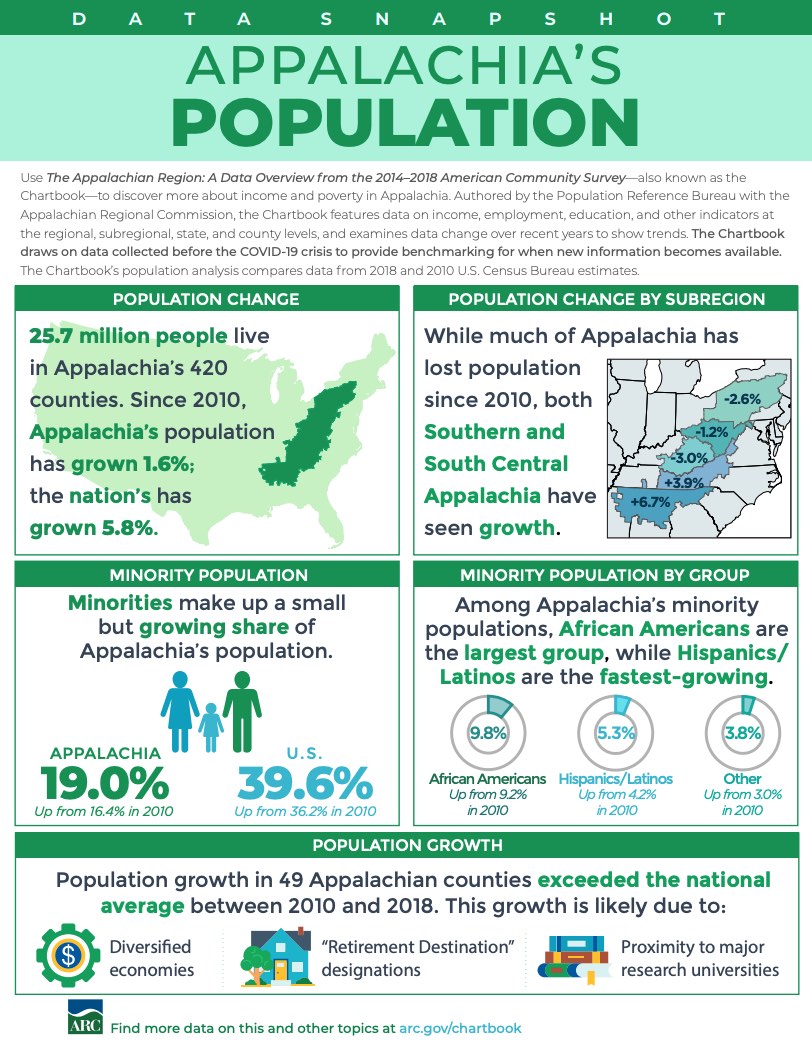
Although Appalachia’s residents of nearly all ages have been more likely to have health insurance than other Americans in recent years, the Region may be more vulnerable to the health and schooling impacts of the coronavirus pandemic due to larger shares of elderly and disabled residents and lower levels of computer and broadband access.

The Appalachian Region: A Data Overview From the 2014-2018 American Community Survey (51 MB), a Population Reference Bureau (PRB) report for the Appalachian Regional Commission, provides a comprehensive picture of social and economic conditions in Appalachia prior to the coronavirus pandemic. These data can help researchers and policymakers assess the pandemic’s potential implications for the Region.

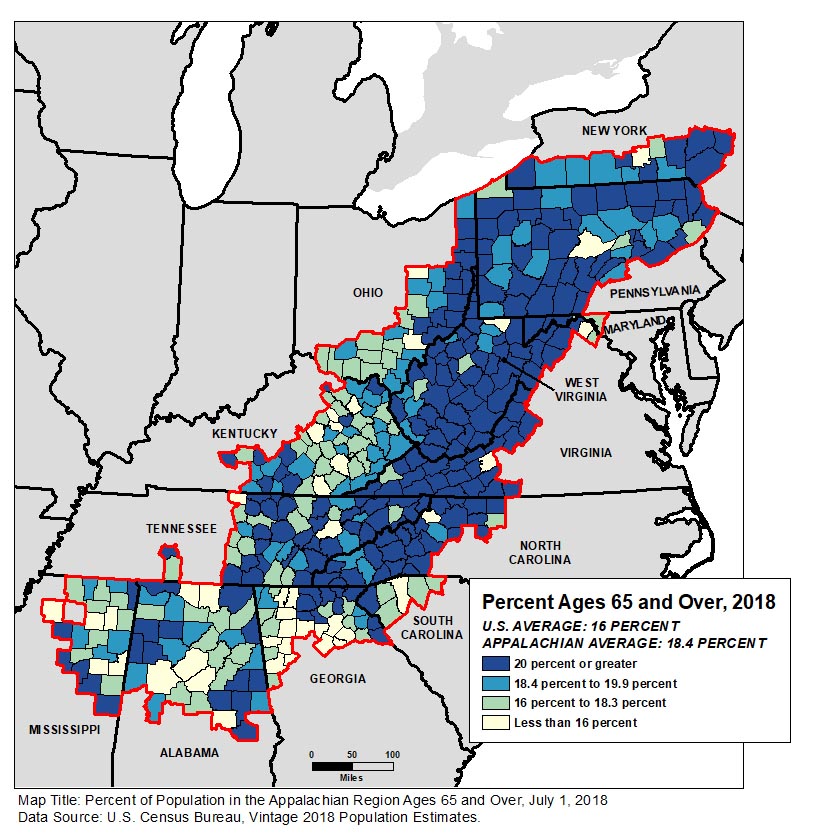
People ages 65 and older made up 18.4% of Appalachia’s population—more than two percentage points above the national average. The share exceeded 20% in more than half of the Region’s counties (see Figure 1).

FIGURE 1. Percent of Population in Appalachian Region Ages 65 and Over, July 1, 2018

Among all age groups, the share of Appalachian residents who reported a disability (difficulty with hearing, vision, cognition, walking or climbing, self-care, or independent living) in 2014-2018 was above the national average—with the widest gap among 35- to 64-year-olds (more than four percentage points: 17.1% in Appalachia versus 12.8% nationwide).

“People ages 65 and over and those with underlying health conditions are considered among the groups most vulnerable to serious complications related to the coronavirus; if the virus becomes widespread in Appalachian communities with the largest share of older adults, they may risk high illness and death rates,” says Kelvin Pollard, PRB senior demographer and report co-author.

Just over 84% of Appalachian households had access to a computer device, nearly five percentage points below the national average. The share of households with broadband access, at 75%, was likewise five points below the national average. The report found that the digital divide was particularly acute in Appalachia’s most rural communities: three in 10 rural Appalachian households lacked internet access.

“With most schools closed due to the coronavirus pandemic, this rural digital divide has made online education and maintaining learning extremely challenging,” according to report co-author Linda A. Jacobsen, PRB’s vice president for U.S. Programs.

Rural Appalachia at a Disadvantage Compared With Elsewhere in Rural America

The report also compares Appalachia’s 107 rural counties (that is, counties that are neither part of nor adjacent to a metropolitan area) to the 840 rural counties outside the Region. It shows that rural Appalachia lagged behind the rest of rural America on a variety of measures such as educational attainment, household income, population growth, and labor force participation.

However, residents of rural counties in Appalachia were more likely than residents of rural counties outside the Region to have health insurance coverage in the 2014-2018 period—both among all residents and among young adults ages 26 to 34 where noncoverage rates were highest.

But disability rates and poverty rates were also significantly higher in rural Appalachia than in other parts of rural America (see Figure 2). Disability rates in Appalachia were higher in every age group, with a six-percentage point gap among those ages 35 to 64 and ages 65 and older.

FIGURE 2. Levels of Disability and Poverty Are Higher Across All Age Groups in Rural Appalachia Than in Rural Counties Outside the Region

wdt_ID Population Appalachian Rural Non-Appalachian Rural
1 With a Disability 20 16
2 Adults 18-64 With a Disability 18 14
3 Adults 35-64 With a Disability 23 17
4 Adults 65+ With a Disability 44 38
5 In Poverty 22 16
6 Children in Poverty 30 23
7 Adults 18-24 in Poverty 32 26
8 Adults 25-64 in Poverty 20 14

wdt_ID Population Appalachian Rural Non-Appalachian Rural
1 In Poverty 22 16
2 Children in Poverty 30 23
3 Adults 18-24 in Poverty 32 26
4 Adults 25-64 in Poverty 20 14

Source: U.S. Census Bureau, 2014-2018 American Community Survey.

Poverty rates in rural Appalachia were also higher, with at least a six-percentage point gap in every age group. Nearly one-third of young adults ages 18 to 24 were in poverty in rural Appalachia in 2014-2018—a rate even higher than that among children.

“Across the country, lower-income households and young adults have been hard hit by the current pandemic in terms of job and income loss; our findings indicate that conditions were already more challenging in rural counties within Appalachia than in those outside the Region, even before the pandemic,” said Jacobsen.

Other Key Findings

  • Just 26% of Appalachia’s working-age population had a four-year college degree, seven percentage points lower than the U.S. average of 33%. The share of adults with an associate’s degree was nearly 10%, slightly higher than the national average.
  • Median household income in Appalachia increased by 5% between 2009-2013 and 2014-2018, just slightly below the national increase of 5.3%. But median household income in Appalachia was more than $10,000 lower than the national median of $60,293.
  • Nearly three-fourths (73%) of Appalachia’s prime working-age adults (ages 25 to 64) were in the labor force in 2014-2018, which was almost five percentage points lower than in the United States as a whole. Counties with higher labor force participation rates tended to have higher levels of educational attainment, the analysis showed. Although the unemployment rate in Appalachia declined by more than three percentage points between 2009-2013 and 2014-2018, 16 counties had unemployment rates of 10% or higher in 2014-2018.
  • The share of Appalachian residents living below the poverty level ($25,465 for a family of two adults and two children) exceeded the national average for every age group except those ages 65 and older. The largest gap was among young adults ages 18 to 24, where the Appalachian share was more than three percentage points higher. More than one-fifth of children and one-fourth of young adults were poor in 2014-2018.
  • Appalachian residents were less likely to be without health insurance coverage in the 2014-2018 period compared with the rest of the nation (8.8% in Appalachia compared with the national average of 9.4%). The only exception was among young adults ages 26 to 34, where the share without insurance was higher in Appalachia.
  • The population growth rate of 1.6% between 2010 and 2018 was significantly lower than the national average of 5.8%, with almost two-thirds of Appalachian counties experiencing a net loss of population.
  • The Appalachian Region is significantly less racially and ethnically diverse than the United States as a whole. In 2018, minorities (defined as anyone identifying with a racial or ethnic group other than “white alone, not Hispanic”) made up 19% of the Appalachian population—less than half the national average. African Americans remained the largest single minority group in Appalachia. Yet Hispanics have fueled much—if not most—of the Region’s minority increase.
  • Although the share of Appalachian households with no vehicle available was slightly below the national average, the share in 51 counties, primarily located in New York, Pennsylvania, West Virginia, and Kentucky, reached 10% or more.
  • Nearly one-third of Appalachian workers ages 16 and older commuted to jobs outside their county of residence, four percentage points above the national average. This share was even higher across much of the Region—at least half of workers in 122 of Appalachia’s 420 counties. Many of these counties were in metro areas, including the suburbs and exurbs of Birmingham, Atlanta, and Cincinnati.

The Appalachian Region encompasses 205,000 square miles along the Appalachian Mountains from southern New York to northern Mississippi, including portions of 12 states and all of West Virginia. The Appalachian Regional Commission report uses data from the 2014-2018 American Community Survey and the Census Bureau’s vintage 2018 population estimates—the most recent data available for the characteristics studied. It includes detailed tables and county-level maps covering state- and county-level data on population, age, race and ethnicity, housing occupancy and tenure, housing type, education, computer ownership and internet access, labor force participation, employment and unemployment, transportation and commuting, income and poverty, health insurance coverage, disability status, migration patterns, and veteran status. It also includes a detailed comparison of characteristics in rural Appalachian counties with those outside the Region.


About the Appalachian Regional Commission

The Appalachian Regional Commission is an economic development agency of the federal government and 13 state governments focusing on 420 counties across the Appalachian Region. ARC’s mission is to innovate, partner, and invest to build community capacity and strengthen economic growth in Appalachia to help the Region achieve socioeconomic parity with the nation.

prb-hero

Sub-Saharan Africa’s Demographic and Health Characteristics Will Influence the Course of the COVID-19 Pandemic

When the World Health Organization declared COVID-19 a pandemic on March 11, 2020, few sub-Saharan African countries had reported a single case of the disease, caused by the novel coronavirus SARS-CoV-2.

Since then, it has spread at an alarming rate, with more than half of countries in the region now experiencing community transmission—when new cases occur without any known contact with someone from an infected area.1 South Africa leads the region with nearly 40,800 confirmed cases as of this writing, followed by Nigeria (11,500), Ghana (8,900), and Cameroon (7,400).2

Although the region is still reporting fewer cases of COVID-19 than the rest of the world, the wide geographic spread of infection suggests a large number of unreported cases and deaths. In addition to governance and health system structures, other regions’ experiences offer general models for how the pandemic may play out, but sub-Saharan Africa’s specific characteristics related to age, health, and lifestyle will affect its trajectory in both positive and negative ways. Here’s what we’re keeping an eye on as we monitor the pandemic in collaboration with our partners in the region.

Will Sub-Saharan Africa’s Young Population Give It an Edge?

Evidence shows that older populations are hardest hit by the coronavirus. Sub-Saharan Africa has a much younger population than China, the United States, the European Union, and other areas already experiencing widespread infection. The median age is 38 in China and the United States, and 43 in the European Union, but it is just under 20 in sub-Saharan Africa.3

Only 3% of the region’s population is over age 65, the threshold for significantly higher risk of COVID-19-related complications and death.4 In Italy, which has had one of the highest COVID-19 mortality rates in the world, 23% of the population is over age 65. In contrast, in Nigeria, Africa’s most populous country, 44% of the population is under age 15—a group that has thus far been spared the worst of the pandemic (see figure).

According to modeling by the Center for Global Development, assuming a worst-case infection scenario without government intervention, 1.3% of Spain’s population would be killed by the epidemic compared to 0.15% of Uganda’s based on differences in the country’s age distribution alone (assuming the relationship between age and mortality and all other factors are the same).5 While we know that health and other factors come into play, sub-Saharan Africa’s youthful age structure could contribute to a lower regional mortality rate.

FIGURE. Sub-Saharan African Countries Have a Much Younger Age Profile Than European Countries

Sources: PRB analysis of data by the United Nations, World Population Prospects: 2019 Revision.

How Will Other Regional Demographic Characteristics Influence COVID-19 Outbreaks?

Other demographic features in sub-Saharan Africa, however, could complicate prevention and mitigation efforts related to COVID-19.

Migration. When people travel the continent by land and air, they pose a significant risk of carrying the coronavirus with them, undetected, into neighboring countries. South Africa, Kenya, and Ethiopia are travel hubs for the rest of the continent, creating a situation where people may move from higher prevalence areas to lower prevalence areas, driving the spread of infection. When South Africa declared its lockdown in late March, for example, it sent 14,000 Mozambican workers back across the border.6 West Africa is particularly vulnerable, having both the most migrants and the most reported cases of COVID-19 as of this writing.7

Displaced persons. The United Nations Refugee Agency reported in 2019 that sub-Saharan Africa hosts more than 17 million internationally displaced persons and six million refugees—more than a quarter of the world’s refugee population.8 Such a high number of displaced persons, who are more likely to live in close quarters with others and often in conditions with poor sanitation and hygiene, limits countries’ abilities to monitor infection rates and enforce preventative measures such as physical distancing.

Rapid urbanization. Physical distancing is challenging in urban areas with high population density. These difficulties are especially acute in sub-Saharan Africa, which is experiencing the fastest rate of urbanization in the world and anticipating 65 million additional urban residents each year.9 More than half the region’s city dwellers live in slums or informal housing known for unhygienic and crowded conditions, and 63% of city residents lack access to clean water and soap for frequent handwashing.10 As a result, basic precautions against COVID-19 recommended by the World Health Organization may not be feasible for a large portion of the population.11

Large households. With an average household size of 6.9 people, multigenerational households are more common in this region than in any other.12 Such housing arrangements—in close quarters with children and working adults—could put older individuals at heightened risk of infection and death from COVID-19. In West African countries such as the Gambia and Senegal, for example, households with at least one older family member had an average of 12 residents.13 Even when at-risk individuals can avoid nonessential interactions outside the home, their family members pose an infection risk in shared spaces.14

Will Experience With Disease Outbreaks Aid the Region’s Coronavirus Preparedness?

Experience with other infectious disease outbreaks has given some countries in sub-Saharan Africa a head start in terms of preparedness and health infrastructure to slow the spread of the coronavirus. In late February 2020—nearly a month before countries in the region implemented widescale social distancing measures—the new Africa Centres for Disease Control created a continental plan to train health care workers in 48 countries to process coronavirus tests.15

At country levels, recently established and strengthened public health organizations such as the Nigeria Centers for Disease Control have redirected existing disease task forces and resources to the coronavirus containment effort.16 Resuming procedures established for the 2014 Ebola crisis, for example, the Democratic Republic of the Congo (DRC) swiftly implemented screening, testing, and contact-tracing procedures and readied its bio-secure emergency care units.17 Uganda, which has operated in a state of health care emergency since 2018, mobilized border surveillance teams and screened travelers at its principal international airport using surveillance staff and thermometers on hand from combatting past diseases such as yellow fever, measles, and the Crimean-Congo hemorrhagic fever.18

These early preparedness measures may help countries in the region slow and contain the spread of the coronavirus.

Can Health and Health System Capacity in the Region Withstand COVID-19?

Existing health conditions. Aside from age, a person’s overall health plays a major role in determining how COVID-19 symptoms manifest. In sub-Saharan Africa, a wide range of diseases have wreaked havoc on individuals’ immune systems. Specifically, infectious diseases such as HIV/AIDS and tuberculosis disproportionately affect people in the region and may potentially put the population at higher risk of suffering severe complications from COVID-19, especially if treatments for these diseases are interrupted. In 2018, the region claimed 24% of the 10 million cases of tuberculosis, including 72% of co-infection cases in vulnerable HIV-positive individuals.19 Sub-Saharan Africa is home to two-thirds of people living with HIV worldwide.20 Notably, 89%, or 1.5 million of the 1.6 million adolescents living with HIV worldwide, are in sub-Saharan Africa—a vulnerability that could potentially erode Africa’s otherwise youthful advantage against the coronavirus.21 Research has shown that adolescents have particular difficulty adhering to the treatment regimens that suppress HIV, making them more vulnerable to other infections.22

The region also has high rates of noncommunicable diseases (NCDs), which have grown substantially in recent decades as a proportion of the total disease burden. The single largest category of NCDs are cardiovascular diseases such as ischemic heart disease, hypertension, and high blood pressure, all of which increase the risk of becoming severely ill from COVID-19.23 High rates of smoking and unhealthy diets, common in African countries with relatively higher rates of urbanization, also contribute to this health burden. Recent studies estimate that 5% of sub-Saharan Africans have diabetes and 20% are obese.24 In addition, individuals develop NCDs at much younger ages in sub-Saharan Africa than in high-income countries, PRB reports, possibly exacerbating the pandemic’s impact on the region.


“Critical immunization programs and malaria prevention activities have been sidelined as health care workers and resources are diverted to combat the COVID-19 pandemic.”


Health systems capacity. Despite its past experiences with disease outbreaks, the region’s limited health care infrastructure, including weak supply chains, shortages of health personnel, and low testing and laboratory capacity, will make it difficult to respond to the coronavirus pandemic. Public health care spending in Africa is among the lowest in the world, with an estimated $66 billion in unmet needs, according to one study.25 Although health care capacity varies widely among sub-Saharan African countries, on average, the region has only 0.2 doctors for every 1,000 people compared with 1.8 in China and 3.7 in the European Union.26

Many health care facilities in the region lack electricity and essential medicines, and few countries have sufficient intensive care units (ICUs) to treat the critically ill.27 Uganda has just 0.1 ICU beds for every 100,0000 people.28 The United States, where many hospitals are at risk of reaching capacity with COVID-19 patients, has 35 ICU beds. The supply of ventilators is further restricted. Even fewer countries in sub-Saharan Africa have enough ventilators, the life-saving equipment required to treat the most severe cases of COVID-19. As of March 2020, for example, Liberia did not have a single ICU equipped with ventilators. An International Rescue Report in April 2020 found that South Sudan had four ventilators for its population of 11 million and Burkina Faso had 11 ventilators for its 20.9 million people.29

Although international aid is helping close these gaps, all external sources of funding and resources will be constrained as the coronavirus spreads around the world. And as health facilities ration supplies of personal protective equipment for COVID-19 cases, their capacity to care for patients with tuberculosis and other infectious diseases will decline.30 Critical immunization programs and malaria prevention activities have been sidelined as health care workers and resources are diverted to combat the pandemic.31

Can African Livelihoods Endure Major Interruptions?

Most sub-Saharan Africans cannot work from home or practice physical distancing in their jobs because of the kinds of work they do. Seventy-seven percent of non-farm employment in the region is informal, the highest percentage in the world.32 Small business owners, merchants, and vendors who rely on income from each day’s work to meet basic needs for themselves and their families—without employment benefits or social protection—cannot easily abide by government directives like shelter-in-place orders.

Some countries have introduced measures to lessen the economic impact of the coronavirus restrictions and incentivize distancing, including emergency cash payments to the recently unemployed in Namibia and Cabo Verde and widespread tax relief in Kenya.33 These efforts are relatively minor, however, and will be difficult to sustain in the wake of future pandemic-related economic shocks and market interruptions. The potential for public income support that can encourage people to stay at home is extremely limited for most countries because of underfunding of social programs and high levels of public debt.

Mitigation Efforts Must Be Tailored to the National Context

In light of these conditions, COVID-19 mitigation strategies are being adapted for the sub-Saharan African context. Many African countries have already implemented physical distancing measures such as curfews, city lockdowns, and travel restrictions. Nigeria, Zimbabwe, and South Africa were some of the earliest countries to initiate lockdowns that limited travel and closed nonessential businesses.34 Across the continent, many places of worship have closed their doors or implemented outdoor services that comply with physical distancing requirements.

In some places, however, social resistance to preventative measures threaten the success of curfews and lockdown measures.35 Protestors have had violent clashes with police in Kenya and South Africa over restrictions.36 In Malawi, personal rights concerns have led high courts to block lockdown measures from being enacted until a social safety net is in place.37 Ghana, the DRC, and other countries began easing restrictions early on in response to economic hardships and what they perceived as slow rates of infection, followed by South Africa beginning in early June.

Balancing health and economic considerations is an enormous challenge for every country battling this pandemic, but sub-Saharan Africa’s unique characteristics mean that countries might pursue different strategies than those adopted in other regions. Monitoring how the region’s demography and health characteristics shape the course of the pandemic, and exchanging lessons learned across countries with similar profiles, is critical for policy and program responses to integrate the latest evidence.


The authors would like to thank Kaitlyn Patierno, Barbara Seligman, Lara Vaz, and Laura Wedeen for their helpful comments and suggestions. We also appreciate the research support provided for this article by Omaris Caceres, Elaine Les, and Kate Rogers from Georgetown University.


  1. World Health Organization (WHO), COVID-19: Situation Update for the WHO African Region, External Situation Report 12 (2020), https://apps.who.int/iris/bitstream/handle/10665/332150/SITREP_COVID-19_WHOAFRO_20200520-eng.pdf.
  2. Johns Hopkins University & Medicine, “COVID-19 Map,” Coronavirus Resource Center (2020), https://coronavirus.jhu.edu/map.html.
  3. Neema Kaseje, “Why Sub-Saharan Africa Needs a Unique Response to COVID-19,” World Economic Forum, March 30, 2020, https://www.weforum.org/agenda/2020/03/why-sub-saharan-africa-needs-a-unique-response-to-covid-19/.
  4. Centers for Disease Control and Prevention, “People Who Are at Higher Risk for Severe Illness,” https://www.cdc.gov/coronavirus/2019-ncov/need-extra-precautions/people-at-higher-risk.html.
  5. David Evans and Eric Werker, “What a Population’s Age Structure Means for COVID-19’s Impact in Low-Income Countries,” Center for Global Development, March 25, 2020, https://www.cgdev.org/blog/what-populations-age-structure-means-covid-19s-impact-low-income-countries.
  6. Africanews, “Coronavirus: Mozambican Workers Returning from South Africa Engaged to Check COVID-19’s Spread,” April 21, 2020, https://www.africanews.com/2020/04/21/coronavirus-mozambican-workers-returning-from-south-africa-engaged-to-check-covid-19-s-spread/.
  7. Africa Centers for Disease Control and Prevention, “Coronavirus Disease 2019 (COVID-19),” https://africacdc.org/covid-19/.
  8. United Nations Refugee Agency, Global Focus: Africa, http://reporting.unhcr.org/africa.
  9. Jamal Saghir, “Urbanization in Sub-Saharan Africa,” Center for Strategic International Studies, April 12, 2018, https://www.csis.org/analysis/urbanization-sub-saharan-africa.
  10. Jamal Saghir, “Urbanization in Sub-Saharan Africa”; UNICEF, “Fact Sheet: Handwashing With Soap, Critical in the Fight Against Coronavirus, Is ‘Out of Reach’ for Billions,” March 13, 2020, https://www.unicef.org/press-releases/fact-sheet-handwashing-soap-critical-fight-against-coronavirus-out-reach-billions.
  11. WHO, “Coronavirus Disease (COVID-19) Advice for the Public,” https://www.who.int/emergencies/diseases/novel-coronavirus-2019/advice-for-public.
  12. Pew Research Center, “Religion and Living Arrangements Around the World” Dec. 12, 2019, https://www.pewforum.org/2019/12/12/religion-and-living-arrangements-around-the-world/.
  13. United Nations Department of Economic and Social Affairs, “Population Facts: Living Arrangements of Older Persons Around the World,” NO.2019/2 (2019), https://www.un.org/en/development/desa/population/publications/pdf/popfacts/PopFacts_2019-2.pdf.
  14. Aryn Baker, “Few Doctors, Fewer Ventilators: African Countries Fear They Are Defenseless Against Inevitable Spread of Coronavirus,” TIME Magazine, April 7, 2020, https://time.com/5816299/coronavirus-africa-ventilators-doctors/.
  15. Brian W. Simpson, “In COVID-19, the Africa CDC Faces Its Greatest Challenge,” Global Health Now, Johns Hopkins School of Public Health, March 31, 2020, https://www.globalhealthnow.org/2020-03/covid-19-3-year-old-africa-cdc-faces-its-greatest-challenge
  16. Yvonne Mburu and Yap Boum II, “Coronavirus: Amid the Global Pandemic, Lessons for Africa,” The Brookings Institute, March 20, 2020, https://www.brookings.edu/blog/africa-in-focus/2020/03/20/coronavirus-amid-the-global-pandemic-lessons-for-africa/<
  17. WHO,”How Ebola Is Helping the Democratic Republic of the Congo Prepare for Coronavirus Disease,” Feb. 20, 2020, https://www.afro.who.int/photo-story/how-ebola-helping-democratic-republic-congo-prepare-coronavirus-disease.
  18.  Michael Baleke, “How Uganda’s History of Epidemics Has Prepared It for COVID-19,” PBS News, April 21, 2020, https://www.pbs.org/newshour/show/how-ugandas-history-of-epidemics-has-prepared-it-for-covid-19.
  19. WHO, “Tuberculosis,” March 24, 2020, https://www.who.int/news-room/fact-sheets/detail/tuberculosis;
  20. WHO, “Malaria,” Jan. 14, 2020, https://www.who.int/news-room/fact-sheets/detail/malaria.
  21. WHO Africa, “HIV/AIDS,” https://www.afro.who.int/health-topics/hivaids.
  22. UNICEF, “Adolescent HIV Prevention,” July 2019,
  23. Nadine Ammon, S. Mason, and John Corkery, “Factors Impacting Antiretroviral Therapy Adherence Among Human Immunodeficiency Virus-Positive Adolescents in Sub-Saharan Africa: A Systematic Review,” Public Health 157 (2018): 20-31.
  24. Hebe N Gouda et al., “Burden of Non-Communicable Diseases in Sub-Saharan Africa, 1990–2017: Results From the Global Burden of Disease Study 2017,” Lancet Global Health 7, no 10 (2019).
  25. Kathleen Mudie et al., “Non-Communicable Diseases in Sub-Saharan Africa: A Scoping Review of Large Cohort Studies,” Journal of Global Health 9, no. 2 (2019).
  26. Vera Songwe, “Financing Africa’s Healthcare,” GBC Health (2019), http://gbchealth.org/financing-africas-healthcare/.
  27. World Bank Open Data https://data.worldbank.org/; WHO, Global Health Observatory, https://www.who.int/data/gho.
  28. Tolbert Nyenswah, “Africa Has a COVID-19 Time Bomb to Defuse,” World Economic Forum, April 6, 2020, https://www.weforum.org/agenda/2020/04/africa-covid-19-time-bomb-defuse/
  29. Neema Kaseje, “Why Sub-Saharan Africa Needs a Unique Response to COVID-19,” World Economic Forum, March 30, 2020, https://www.weforum.org/agenda/2020/03/why-sub-saharan-africa-needs-a-unique-response-to-covid-19/.
  30. International Resuce Committee, “COVID-19 in Humanitarian Crises: A Double Emergency,” April 2020, https://www.rescue.org/sites/default/files/document/4693/covid-19-doubleemergency-april2020.pdf.
  31. Paul Adepoju, “Tuberculosis and HIV Responses Threatened by COVID-19,” The Lancet 7 (2020), https://doi.org/10.1016/S2352-3018(20)30109-0.
  32. Roxanne Nelson, “COVID-19 Disrupts Vaccine Delivery,” Lancet Infectious Diseases 20, no. 5 (2020).
  33. Florence Bonnet, Joann Vanek and Martha Chen, “Women and Men in the Informal Economy: A Statistical Brief,” Women in Informal Employment: Globalizing and Organizing and International Labour Office (2019).
  34. David Evans, “The Economic Impact of COVID-19 in Africa: A Round-Up of This Week’s Analysis,” Center for Global Development, April 3, 2020, https://www.cgdev.org/blog/economic-impact-covid-19-africa-weeks-latest-analysis.
  35. Christopher Giles and Peter Mwai, “Coronavirus: Why are Some African States Easing Lockdowns?” BBC News, May 4, 2020, https://www.bbc.com/news/world-africa-52395976.
  36. BBC News, “South Africa Coronavirus Lockdown: Is the Alcohol Ban Working?” April 22, 2020, https://www.bbc.com/news/world-africa-52358268.
  37. Christopher Giles and Peter Mwai, “Coronavirus: The Different Approaches to Lockdowns in Africa,” BBC News, April 26, 2020, https://www.bbc.com/news/world-africa-52395976.
  38. Frank Jomo, “Malawi Court Blocks Government From Starting 21-Day Lockdown,” Bloomberg News, April 17, 2020, https://www.bloomberg.com/news/articles/2020-04-17/malawi-court-blocks-government-from-starting-21-day-lockdown
0520-coronavirus-stress

Coronavirus Stress and Fear Could Take a Toll on Our Health

Stress and fear during coronavirus social isolation can alter gene activity in ways that affect your immune system, but doing good deeds can bolster health.

Heightened fears and the stress of social distancing and isolation may negatively impact the health of millions of Americans who are already feeling burdened by the effects of the novel coronavirus pandemic.

And some health experts believe that such impacts might even leave certain people more susceptible to infection by the coronavirus.

Research in the emerging field of social genomics has found that chronic social isolation and loneliness can alter gene activity in ways that inhibit an individual’s antiviral response while increasing their risk of diseases such as arteriosclerosis, cancer, and dementia over the long term.1But there’s no data yet on the effects of short-term isolation related to social distancing and stay-at-home orders.

“A lot depends on the timing and the psychology,” says Steve Cole, professor of medicine and biobehavioral sciences at the University of California, Los Angeles (UCLA).

His research, supported by the National Institute on Aging (NIA), examines how psychological experiences—including prolonged social isolation, a lifetime of poverty, and constant fear for one’s safety—can influence our immune systems and, in turn, our health.

Cole has examined the immune-response genes of socially isolated and chronically lonely people, exploring why they got sick and died faster when they contracted HIV, the virus that causes AIDS. He and his colleagues found that the fight-or-flight stress response is highly activated among chronically lonely people, triggering the expression of genes involved in inflammation while suppressing the activity of genes governing the virus-fighting Type I interferon system.2 This inflammatory response to loneliness may have evolved in early humans, enabling those separated from their tribe or social group to heal from injuries sustained without group protection, he explains.

But the fight-or-flight stress response is “a double-edge sword,” says Cole, noting that while it can help steer our immune system “toward inflammatory responses that kill bacteria,” inflammation also “fuels the growth of some other slow-brewing illnesses such as cardiovascular diseases, neurodegenerative diseases, and many types of cancer.”

Stress and Fear Can Dampen Antiviral Responses

Sustained fear and insecurity also trigger that fight-or-flight stress response, according to Cole. “The body doesn’t care what we’re afraid of—fear of the virus or fear of rejection by others, as is common in lonely people. Either type of fear will still stimulate our inflammation system, suppress our interferon system, and mess with a wide range of other physiologic systems we need to keep us healthy.”

While it is too early for studies related to the current pandemic, Cole offers what we do know about other types of coronaviruses. “Fight-or-flight stress physiology strongly suppresses the Type I interferon system, which is the body’s first line of defense against viral infections of all types. Coronaviruses are highly vulnerable to our Type I interferon responses, and it stands to reason that any stress-induced suppression of that system would leave us more vulnerable to this type of virus.”

It would be particularly tragic, he notes, if the stress of social distancing makes us more vulnerable to infection if we are exposed, even as it reduces our likelihood of exposure in the first place.

Short-Term Loneliness Is Unlikely to Make a Lasting Difference to Health

The good news is that a few weeks or months of being home alone is unlikely to noticeably affect a person’s health over the long term. The inflammation that hardens arteries and contributes to a heart attack takes many decades to build up, for example.

“The loneliness people feel after a move to a new town or the end of a romantic relationship is generally transient,” Cole says. “Any short-term change in our physiology would probably not significantly impact the long-term development of chronic illnesses like heart disease or cancer.”

Loneliness makes us focus on ourselves but redirecting that focus outward… can change our outlook, our brains, and our body chemistry.

Steve Cole, Professor of medicine and biobehavioral sciences at the University of California, Los Angeles

Doing Good For Others Can Help Us Stay Healthy

Cole and his colleagues have identified a surprising way to dampen stress-related inflammation and bolster the body’s virus-fighting capacity in chronically lonely people—altruism and purpose.3

“Loneliness makes us focus on ourselves,” he explains. “But redirecting that focus outward, toward helping others or some other self-transcendent purpose, can change our outlook, our brains, and our body chemistry.”

Older volunteers mentoring elementary school students experienced such immune system benefits. That’s according to a study led by Teresa Seeman, UCLA epidemiology professor and co-director of the UCLA and University of Southern California Center on Biodemography and Population Health.4 Those who reported the greatest increases in their sense of life purpose and meaning during the study also showed the greatest reduction in inflammation and increase in antiviral response.

During the current pandemic, focusing attention on how our own social distancing is protecting the common good and checking in on others by telephone or video conference could “very likely” counter some of the negative effects of stress and fear, says Cole.

And mounting evidence suggests that a variety of strategies—including mindfulness practices, yoga, tai chi, cognitive-behavioral stress management techniques (such as anxiety reduction, thought substitution, and coping skills), and certain drugs—can also alter the fight-or-flight signaling that increases inflammation and dampens antiviral responses, according to Cole.5

Prolonged Economic Insecurity, Poverty, and Grief Can Affect Health

What concerns Cole most right now is the potential for deepening poverty and widespread economic insecurity—particularly if unemployment persists and an economic recession takes hold. The long-term stress of living in poverty “gets under the skin,” “weathers” people, and sets them up for a host of chronic diseases at older ages, he and his colleagues find based on nationally representative Health and Retirement Study data.6

Bereavement—such as the unexpected loss of a loved one due to COVID-19, the disease caused by the novel coronavirus—is also known to worsen heart problems and raise mortality risks.7

Research on the health effects of the 2008 recession may provide clues on what to expect during the economic downturn that many are predicting in the wake of the current pandemic.  Seeman and colleagues documented a higher-than-expected rise in risk factors for heart disease and diabetes among Americans ages 45 and older following the global financial decline.8

The negative changes were most pronounced among those most likely to be affected by the economic downturn, including working-age adults and homeowners ages 65 and older “whose declining home wealth may have reduced their financial security, with less scope for recouping losses during their lifetime.” Least affected were older adults without a college degree; their reliance on Medicare and Social Security may have protected them, the researchers suggest.

Consider Spending More Time on Creative Activities

Older Americans may feel the effects of stay-at-home orders more acutely than other groups; 42% of those ages 65 and older lived alone in 2018, the largest share of any other U.S. age group.9

Those isolating themselves at home may be better off limiting television viewing and spending more time on mentally stimulating activities such as reading, carpentry, gardening, and crafting. That’s the advice of a University of Michigan researcher who studies older adults and the connections among their health, satisfaction with life, loneliness, and time use with NIA funding.10

“Spending the whole day alone listening to a constant stream of bad news is clearly not good for anyone,” says Jacqui Smith, a professor affiliated with the Michigan Center for the Demography of Aging and Institute of Social Research.

Television is passive, Smith points out. Activities that involve more social, mental, and physical engagement contribute the most to the positive side of adults’ daily emotional balance sheets, her work shows.11

This line of research, known to academics as subjective well-being, looks beyond traditional measures of physical and cognitive health to examine how older people evaluate and experience their daily lives. Researchers are finding that people who report that their lives are full of meaning and purpose tend be physically healthier and live longer than people who do not, as are those who report their day-to-day experience as largely positive and satisfying.12

For older adults confined at home by social distancing, Smith’s research underscores the positive health effects of phone conversations with friends and family, and exercise such as walks or stretching at home—activities that could benefit us all during the coronavirus pandemic, at any age.

Stay informed, Smith says, but spend more time on activities that “absorb your attention so fully that you lose track of time,” such as crafts, baking, or reading.

References

1Morgan Levine et al., “Contemporaneous Social Environment and the Architecture of Late-Life Gene Expression Profiles,” American Journal of Epidemiology 186, no. 5 (2017): 503-9; and Steven W. Cole, “Social Regulation of Human Gene Expression: Mechanisms and Implications for Public Health,” American Journal of Public Health 103, Supplement 1 (2013): S84-92.

2Steven W. Cole et al., “Accelerated Course of Human Immunodeficiency Virus Infection in Gay Men Who Conceal Their Homosexual Identity,” Psychosomatic Medicine 58, no. 3 (1996): 219-31; and Steven W. Cole, “Social Regulation of Human Gene Expression: Mechanisms and Implications for Public Health.” Type 1 interferons are a group of proteins that protect cells from infection by interfering with viral replication.

3Steven W. Cole, et al. “Loneliness, Eudaimonia, and the Human Conserved Transcriptional Response to Adversity,” Psychoneuroendocrinology 62, no. 1 (2015): 11-7.

4Teresa Seeman et al., “Intergenerational Mentoring, Eudaimonic Well-Being and Gene Regulation in Older Adults: A Pilot Study,” Psychoneuroendocrinology 111, no. 1 (2020): 104468.

5Jennifer M. Knight et al., “Propranolol Inhibits Molecular Risk Markers in HCT Recipients: A Phase 2 Randomized Controlled Biomarker Trial,” Blood Advances 4, no. 3 (2020): 467-76; Michael R. Irwin et al., “Cognitive Behavioral Therapy and Tai Chi Reverse Cellular and Genomic Markers of Inflammation in Late-Life Insomnia: A Randomized Controlled Trial,” Biological Psychiatry 78, no. 10 (2015): 721-9; J. David Creswell et al., “Mindfulness-Based Stress Reduction Training Reduces Loneliness and Pro-Inflammatory Gene Expression in Older Adults: A Small Randomized Controlled Trial,” Brain, Behavior, and Immunity 26, no. 7 (2012): 1095-101; Julienne E. Bower et al., “Yoga Reduces Inflammatory Signaling in Fatigued Breast Cancer Survivors: A Randomized Controlled Trial,” Psychoneuroendocrinology 43, no. 1 (2014): 20-9; and Julienne E. Bower et al., “Mindfulness Meditation for Younger Breast Cancer Survivors: A Randomized Controlled Trial,” Cancer 121, no. 8 (2015): 1231-40.

6Morgan Levine et al., “Contemporaneous Social Environment and the Architecture of Late-Life Gene Expression Profiles,” American Journal of Epidemiology 186, no. 5 (2017): 503-9.

7See multiple citations in Ashton M. Verdery and Emily Smith-Greenway, “COVID-19 and Family Bereavement in the United States,” Applied Demography, Special Issue on Covid-19, Committee on Applied Demography, Population Association of America, March 2020, pp. 1-2, www.populationassociation.org/wp-content/uploads/CAD_SpecialEdition_COVID19_March2020.pdf.

18Teresa Seeman et al., “The Great Recession Worsened Blood Pressure and Blood Glucose Levels in American Adults,” Proceedings of the National Academy of Sciences 115, no. 13 (2018): 3296-301.

9U.S. Census Bureau, 2018 American Community Survey.

10Jacqui Smith et al., “Snapshots of Mixtures of Affective Experiences in a Day: Findings From the Health and Retirement Study,” Population Ageing 7, no. 1 (2014): 55-79; and Tara L. Queen et al., “Loneliness in a Day: Activity Engagement, Time Alone, and Experienced Emotions,” Psychology and Aging 29, no. 2 (2014): 297-305.

11Smith et al., “Snapshots of Mixtures of Affective Experiences in a Day.”

12Yoichi Chida and Andrew Steptoe, “Positive Psychological Well-Being and Mortality: A Quantitative Review of Prospective Observational Studies,” Psychosomatic Medicine 70, no. 7 (2008): 741-56; and Angus Deaton and Arthur Stone, “Evaluative and Hedonic Wellbeing Among Those With and Without Children at Home,” Proceedings of the National Academy of Sciences 111, no. 4 (2014): 1328-33.

new_0420f-pandemic-covid-b

How Demographic Changes Make Us More Vulnerable to Pandemics Like the Coronavirus

The world is better equipped to fight a pandemic today than it was in 1918, when influenza swept the globe and infected up to one-third of the world’s population.1 While science and medical advances have given us new advantages in fighting disease, some demographic trends since 1918 may increase the risk for spreading contagions and our vulnerability to viruses.

Population Mobility Allows Viruses to Spread Quickly Around the World

The sheer volume of today’s population movements—from migration and travel as people fly within and across countries—may make it faster and easier for viruses to spread around the world.

During the 1918 flu pandemic, the airline industry was not yet established, and overseas travel was expensive and time consuming. Even with these limitations, the flu spread across multiple countries in a matter of months, mainly because of the large number of military personnel returning home from World War I (1914-1918).2

Since then, flight has become so established in our society that it’s commonplace. By 2018, the global airline industry had 4.3 billion scheduled passengers, up from 1.3 billion passengers in 1995. Similarly, international tourist visits globally have nearly doubled in the past decade, from 936 million visits in 2009 to 1.8 billion visits in 2018.3

The increased volume of travel—both international and domestic—presents a significant challenge to stopping or slowing the spread of the coronavirus and COVID-19, the disease caused by the virus. China’s first reported COVID-19 case occurred in December 2019, and Thailand reported its first confirmed case on Jan. 13, 2020. One week later, by January 20, South Korea and Japan also reported their first cases.4 More than 20 countries reported COVID-19 cases by the end of that month.5

As of April 7, 2020, more than 1.5 million cases of COVID-19 were confirmed across 183 countries and territories.6 For many of these countries, their initial cases developed from travelers from China (such as in Thailand, South Korea, Japan, and Italy) or, later, from travelers from other countries then experiencing an outbreak. Several countries in Europe reported their first cases originating with travelers from Italy, which has been one of the first and hardest hit countries in Europe.7

In the United States, the epicenter for the pandemic is New York City, a densely populated megacity with many international travelers. The first confirmed case in the city came from a traveler who had returned to the city from overseas.8

Population Density in Urban Areas Can Heighten Disease Transmission

As data from tracking the coronavirus shows, once a virus arrives somewhere, it can spread quickly within populations. One key factor to this spread is urbanization.

Population density has generally increased because of the quadrupling in the global population since the 1920s to the current 7.7 billion, but we’re more concentrated in urban areas today than we were back then—more than half the world’s population lives in urban areas.9 Between 1920 and 2020, the percent of the world population estimated to be living in urban areas increased from around 20% to 56%.10 This growth has been largest in Asia and Africa, where their shares are currently 51% and 41% respectively, around three times their percentages in 1950.11

The number of large cities has also soared: 548 cities had 1 million or more people in 2018, a nearly 50% increase from 371 cities in 2000, and a more than seven-fold increase from 77 cities in 1950. In 1950, only New York and Tokyo with their surrounding metropolitan areas were considered megacities, with a population of at least 10 million. By 2018, this number increased to 33, with 27 megacities in developing countries. China is home to six megacities, and India has five megacities. All except one of the 10 cities projected to become megacities between 2018 and 2030 are in developing countries.

The growth in and location of megacities is significant when considering public health crises like those posed by the coronavirus pandemic. While population density facilitates the spread of diseases even in developed countries, rapid urbanization in developing countries—often without proper planning—can result in unsafe crowding and areas with concentrated poverty (slums). This overcrowding and lack of infrastructure for sanitation and hygiene provide prime conditions for the spread of many diseases. Air pollution in large cities also weakens lung function, which may make residents more vulnerable to COVID-19.12

As population growth and urbanization continue, they generate another way in which a virus may spread more easily: As human settlements expand, animal habitats often shrink or are destroyed, increasing the risk of humans coming into contact with new animal-born disease vectors, as scientists believe is the case for the coronavirus (and is the case with many epidemics).

Population Aging Means More Older People Are at Risk of Infection

While the demographic changes in population movement and urbanization may make it easier for viruses to spread, population aging makes us more vulnerable to them. The number of older adults ages 60 and older globally has increased five-fold from 202 million to 1.05 billion between 1950 and 2020, while the total population increased three-fold.13 Coupled with declines in fertility rates during the same period, the result is a rapid aging of the global population—the share of the older population ages 60 and older has increased from 8% in 1950 to 13.5% in 2020.14

The likelihood of becoming severely ill with COVID-19 appears to be greater among those ages 60 and older. While people of all ages can become infected with the coronavirus, older adults may be more at risk partly because they’re more likely to have one or more noncommunicable diseases reported to increase vulnerability, such as cardiovascular diseases, cancers, diabetes, and chronic respiratory diseases, PRB reports.

The age pattern of mortality indicates that places with more older adults are likely at risk of higher rates of severe illness or death than places with younger populations, if all else remain the same, PRB researchers explain. The case fatality rate from COVID-19 in China among those ages 80 and older is reported to be six times higher than the overall case fatality rate for that country.15

Italy’s population has been particularly hard hit by the coronavirus. It began with three cases in people who had traveled from China. Although social distancing is considered to have helped slow the spread in Italy, the country has suffered a significant number of deaths—nearly 18,000 as of this writing—partly because Italy’s population ranks as the oldest in Europe.

Sixteen percent of Italy’s population is ages 85 and older. That segment of the population—those age 85 and older, the group often referred to as the oldest-old—is the fastest-growing age group globally, increasing from less than 5 million people to 64 million people between 1950 and 2020.

The first confirmed case of COVID-19 in the United States was found with a man returning from Wuhan, China, to the state of Washington. It then quickly spread to elderly residents living in close quarters at a nearby nursing home, many of whom have underlying conditions and weakened immune systems. The disease claimed the lives of 35 people less than one month after the first patient was transferred to a hospital.

Demographic Changes Must Be Considered When Evaluating New Health Threats

These facts illustrate how demographic trends in the global mobility of populations, urbanization and population density, and longevity and population aging have likely made us more vulnerable to the coronavirus pandemic and pandemics in general.

Such demographic changes are important to consider as countries evaluate their risks for experiencing pandemics like the coronavirus or other infectious diseases and work to develop new ways to protect their populations. For example, decisionmakers can identify the areas with populations most vulnerable to a disease and increase stocks of protective gear like masks and hand sanitizers; medical supplies such as ventilators, surgical gowns, gloves, and face shields; and hospital beds.

Policymakers may also want to consider policies such as paid sick leave and enhanced unemployment benefits for wage workers in service industries and other industries where workers come into regular contact with the public. These policies will both cut down on the spread of the virus and ease the financial burden on individuals and the economic impact on society.

References


  1. Centers for Disease Control and Prevention, “History of the 1918 Flu Pandemic,” https://www.cdc.gov/flu/pandemic-resources/1918-commemoration/1918-pandemic-history.htm.
  2. “Influenza Pandemic of 1918-19,” Encyclopedia Britannica, updated March 20, 2020, https://www.britannica.com/event/influenza-pandemic-of-1918-1919.
  3. Smithsonian National Air and Space Museum, “America by Air: Airline Expansion and Innovation 1927-1941” (2007), https://airandspace.si.edu/exhibitions/america-by-air/online/innovation/innovation15.cfm.
  4. World Health Organization, “Novel Coronavirus (2019-nCoV) Situation Report – 1,” Jan. 21, 2020, https://www.who.int/emergencies/diseases/novel-coronavirus-2019/situation-reports.
  5. World Health Organization, “Novel Coronavirus (2019-nCoV) Situation Report – 12,” Feb. 1, 2020, https://www.who.int/emergencies/diseases/novel-coronavirus-2019/situation-reports.
  6. Johns Hopkins University & Medicine, “COVID-19 Map,” Coronavirus Resource Center (2020), https://coronavirus.jhu.edu/map.html.
  7. Derrick Bryson Taylor “A Timeline of the Coronavirus Pandemic,” The New York Times, updated April 2, 2020, https://www.nytimes.com/article/coronavirus-timeline.html.
  8. Carl Zimmer, “Most New York Coronavirus Cases Came From Europe, Genomes Show,” The New York Times, April 8, 2020, https://www.nytimes.com/2020/04/08/science/new-york-coronavirus-cases-europe-genomes.html.
  9. United Nations, Department of Economic and Social Affairs (UNDESA), Population Division, 2018 World Urbanization Prospects (2018), https://population.un.org/wup/.
  10. UNDESA, “Growth of the Urban and Rural Population, 1920-2000,” Population Studies, no. 44 (1969), https://population.un.org/wup/Archive/Files/studies/United%20Nations%20(1969)%20-%20Growth%20of%20the%20World%27s%20Urban%20and%20Rural%20Population,%201920-2000.pdf; UNDESA, Population Division, 2019 World Population Prospects (2019), https://population.un.org/wpp/.
  11. UNDESA, 2018 World Urbanization Prospects.
  12. Xiao Wu et al., “Exposure to Air Pollution and COVID-19 Mortality in the United States,” medRxiv, April 7, 2020, https://doi.org/10.1101/2020.04.05.20054502.
  13. UNDESA, 2019 World Population Prospects.
  14. UNDESA, 2019 World Population Prospects.
  15. Nurith Aizenman, “Why the Death Rate From Coronavirus Is Plunging in China,” NPR, All Things Considered, March 3, 2020, https://www.npr.org/sections/goatsandsoda/2020/03/03/809904660/why-the-death-rate-from-coronavirus-is-plunging-in-china.