new_0920f-homelessness

How Many People in the United States Are Experiencing Homelessness?

The economic effects of the coronavirus pandemic in the United States include an unemployment rate higher than at any time in the country’s history—including the Great Depression. As an unprecedented number of Americans struggle with job loss, many of them may lose their homes. Many others may lose their homes due to natural disasters or other crises. As these events fluctuate, so too may the number of people without a home. So how do we know how many people are experiencing homelessness in the United States?

We don’t. We have only widely differing estimates based on varying methodologies and definitions.

Estimates of homelessness in the United States range from fewer than 600,000 to more than 1.5 million people, and the estimates vary by source. The two key sources of data—the U.S. Department of Housing and Urban Development Point-in-Time Count, and the National Center for Education Statistics Count of Students Experiencing Homelessness—vary greatly in their coverage and in their annual estimates.

The HUD Point-in-Time Count—One Night Only

The U.S. Department of Housing and Urban Development (HUD) captures data on people experiencing homelessness through point-in-time (PIT) counts. PIT counts take place nationwide and are conducted on one night in the last week of January each year. HUD mandates that programs that receive funding to assist people experiencing homelessness, called Continuum of Care Programs (CoC), organize a count in their jurisdiction. The count itself is conducted by project staff and community volunteers. The CoC can choose to conduct their count either through a complete count or a sample. The sample method must follow HUD standards for counting and estimating the population.

The PIT counts both sheltered and unsheltered people experiencing homelessness. People included in the sheltered count sleep in shelters, transitional housing, or hotels and motels paid for by charities or government programs. Those who sleep in cars, parks, encampments, and other places not designated for regular sleeping are included in the unsheltered count.

HUD does not consider people who are temporarily doubled up with family or friends as homeless. This standard misses many people who lack permanent housing. In particular, parents with children may be less likely to seek group shelters and interact with authorities for fear of losing custody of their children.1

HUD provides a one-night snapshot of an experience that is often fluid for people who experience homelessness. The count does not include people who fall in and out of homelessness throughout the year. Additionally, changes in the count from year to year may reflect either an actual change or a change in the count’s accuracy. HUD itself cautions against drawing conclusions or trends from the count since data quality review is limited, reliability and consistency differ between CoCs, and methods may change between reporting periods.

Given these limitations, it is likely that the PIT undercounts the number of people experiencing homelesseness. These estimates can best be thought of as a snapshot of the minimum number of people who are homeless in a community, a state, or the nation.

The 2019 PIT count identified about 568,000 people experiencing homelessness. The states with the largest populations of people experiencing homelessness were California (151,000), New York (92,000), and Florida (28,000).

The NCES Count of Students Experiencing Homelessness—School Children Only

Another source of data on the number of people experiencing homelessness is the National Center for Education Statistics (NCES). Housed within the U.S. Department of Education, NCES compiles data on public school students experiencing homelessness during the school year. The count uses local school enrollment data that are submitted to the states and then reported to the Department of Education.

Unlike the one-night PIT count, the NCES count covers the entire school year and more accurately captures the fluid nature of homelessness. NCES defines students experiencing homelessness more broadly than the PIT count to include youth who are doubled up in housing and other temporary circumstances. However, this count includes only public school students and does not track adults experiencing homelessness. This count also does not include children who have dropped out of school, children in private schools, young children who are not yet enrolled in school, and children who experience homelessness outside of the school year.

According to NCES, more than 1.5 million students experienced homelessness during the 2017-2018 school year. This estimate is more than double the PIT count for 2018.More than 390,000 of these students were living at a shelter, staying at a hotel or motel, or were unsheltered. The remainder were doubled-up. California (263,000), Texas (231,000), and New York (153,000) had the largest populations of students experiencing homelessness during the 2017-2018 school year.

Which Estimate Is Best?

Both the PIT and NCES counts have advantages and challenges. Table 1 provides a comparison of the two estimates.

Table 1. Comparison of Data Sources on Homelessness in the United States

wdt_ID Data Source Type Universe Excludes Time Period
1 HUD Point-in-Time Count Enumeration (at selected locations) Entire population in selected communities Anyone doubled-up; communities not on HUD’s list One night (last week of January)
2 NCES Education for Homeless Children and Youth Administrative records Public school students Anyone not enrolled in public school School year

Note: The HUD Point-in-Time counts occur only in some communities and likely underestimate the population experiencing homelessness.

The PIT and NCES estimates both have well-documented undercount issues. NCES does not count adults or children not enrolled in school. PIT does not count anyone who is doubled-up. Data users should be aware of these limitations when working with either data source.

Children Participate in E-Learning Activity at Home

Digital and Economic Divides Put U.S. Children at Greater Educational Risk During the COVID-19 Pandemic

With the number of coronavirus infections surging, school districts across the United States are grappling with decisions about whether and how to re-open this fall. For online learning to be effective, students need access to computers and high-speed internet access, but a new analysis and interactive dashboard by PRB show sharp digital and economic divides among school-age children across states and between racial and ethnic groups.

In 2018, roughly 10% of U.S. children ages 5 to 17 did not have a computer—desktop, laptop, or tablet—at home, and 23% did not have home access to paid high-speed internet.1 Fully one-fourth of all school-age children were lacking either a computer or high-speed internet. Children without computers or high-speed internet at home were already at an educational disadvantage before the COVID-19 pandemic due to the growing need for students to access resources and submit assignments online. Many relied on computers and internet access at school or a local library to complete their work. As the pandemic prompted libraries to close and schools across the country shut down and moved to online instruction, this digital divide has become even more critical.

The Digital Divide Is Wider for Children of Color

A racial and ethnic digital divide also persists. Half of all American Indian/Alaska Native children lack either computers or paid high-speed internet access (or both) at home (see Table 1). More than one-third of Black and Latinx children lack computers or high-speed internet at home, compared with only one-fifth of non-Hispanic white children and one in seven Asian/Native Hawaiian and Other Pacific Islander (NHOPI) children.

Economic barriers contribute to the digital divide between racial and ethnic groups. Poverty rates range from 10% among non-Hispanic white children ages 5 to 17 to 31% among Black children. American Indian/Alaska Native and Latinx children also have poverty rates far above the national average of 17%.

Black, American Indian/Alaska Native, and Latinx school-age children are two to three times more likely to live in households receiving Supplemental Nutrition Assistance Program (SNAP) benefits than white or Asian/Native Hawaiian and Other Pacific Islander children. Nearly 40% of Black and 35% of American Indian/Alaska Native school-age children live in households receiving SNAP benefits. Children whose households receive SNAP benefits are automatically eligible to receive free meals at school—which provide an essential source of daily nutrition for many of these children. With schools shut down, children of color whose families live in poverty and receive SNAP benefits are at much greater risk of going hungry and not receiving the nutrition they need during the pandemic.

TABLE. Children of Color More Likely to Lack Computers and High-Speed Internet at Home

Digital and Economic Divides of Children Ages 5 to 17 by Race and Ethnicity, 2018

wdt_ID Racial or Ethnic Group Lacks Computer, High-Speed Internet Access, or Both Family Income Below 100% of Poverty Household Receives SNAP Benefits
1 American Indian/Alaska Native 50 30 35
2 Black 36 31 39
3 Hispanic or Latino 34 25 28
4 White 20 10 12
5 Asian/NHOPI 14 11 11
6 Two+ Races 19 16 23
7 All Children 25 17 21

Notes: Computers include desktops, laptops, or tablets. All racial groups are non-Hispanic, and Hispanics can be of any race. NHOPI is Native Hawaiian and Other Pacific Islander.
Source: PRB analysis of data from the U.S. Census Bureau’s 2018 American Community Survey Microdata Sample.


View interactive dashboard


Nearly half (47%) of school-age children who live in poverty and 43% of those who receive SNAP benefits lack access to either computers or high-speed internet, compared with only 21% of children who do not receive SNAP benefits and whose family incomes are above the poverty line.

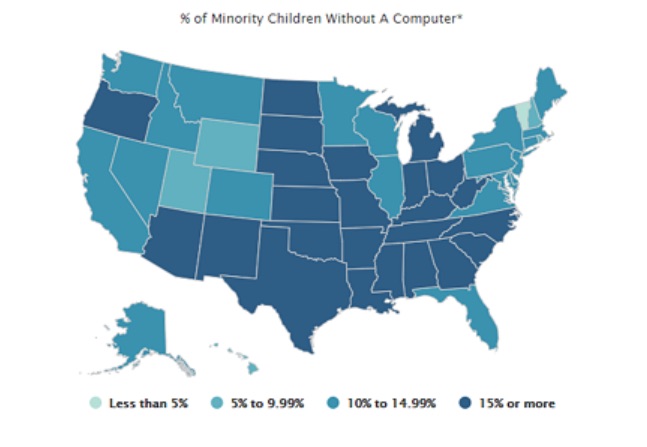
Within every racial and ethnic group, the share of school-age children without access to computers or high-speed internet is much higher for those who receive SNAP benefits and those who live in poverty (see Figure 1). While half of all American Indian/Alaska Native children lack access to computers and high-speed internet, this share jumps to 61% for those receiving SNAP benefits and nearly 70% among those living in poverty. Among non-Hispanic white children, the share without access to computers and high-speed internet nearly doubles from 20% to 39% for those receiving SNAP benefits and from 20% to 41% for those in poverty. Lower levels of economic well-being are widening racial and ethnic gaps in access to computers and high-speed internet.

FIGURE 1. Low Levels of Economic Well-Being Contribute to the Digital Divide

Percent of Children Ages 5 to 17 in Different Racial/Ethnic Groups Lacking Access to Computers or High-Speed Internet by Poverty Status and Receipt of SNAP Benefits, 2018


Notes: All racial groups are non-Hispanic, and Hispanics can be of any race. AIAN is American Indian/Alaska Native. NHOPI is Native Hawaiian and Other Pacific Islander. Without access means without access to either a computer, high-speed internet, or both at home.
Source: PRB analysis of data from the U.S. Census Bureau’s 2018 American Community Survey Microdata Sample.

Digital and Economic Divides Vary Across States

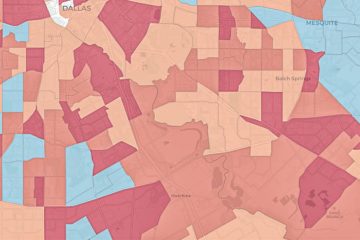
States vary widely in their shares of school-age children without access to computers and high-speed internet, from a low of 13% in New Hampshire to a high of 46% in Mississippi. In eight states—Alabama, Arkansas, Louisiana, Mississippi, New Mexico, Oklahoma, Tennessee, and Texas—more than 30% of children lack either or both computers and internet access, but this count rises to 31 states (including the District of Columbia) for minority children. More than half of school-age minority children in Mississippi, Arkansas, and South Dakota lack access to computers and high-speed internet at home.2

The economic divide is also present in every state. Twelve states (including the District of Columbia) have more than 20% of children ages 5 to 17 living in poverty, and 24 states (including the District of Columbia) have more than 20% of school-age children living in households receiving SNAP benefits. Concentration of poverty and SNAP receipt among school-age minority children is much higher than among non-minority children and is widespread across states. There are only 10 states where the share of minority children living in poverty drops below 20% and only three states (Utah, Vermont, and Wyoming) where the share in households receiving SNAP benefits falls below 20%. Conversely, nine states (Alabama, Arkansas, Louisiana, Mississippi, Ohio, South Carolina, South Dakota, Tennessee, and West Virginia) have one-third or more of minority school-age children living in poverty, and 22 states have more than one-third living in households receiving SNAP benefits.

Reading and Math Proficiency Are Linked to Digital and Economic Divides

Digital and economic divides among school-age children are linked to differences in reading and mathematics proficiency levels across states and between racial and ethnic groups. Proficiency in reading by the end of third grade is an important marker of overall educational development but, beginning in fourth grade, it is also essential for learning other subjects and keeping up academically.3 Children who reach fourth grade without being able to read proficiently are more likely to drop out of high school—reducing their earnings potential and chances for success.4 Similarly, proficiency in mathematics fundamentals makes college attendance and completion more likely, which increases earnings potential.5

In 2019, a shocking two-thirds of all fourth graders in the United States scored below the proficient level in reading, as did two-thirds of eighth graders in math. However, these shares are much higher among children in the racial and ethnic groups with the highest levels of poverty and receipt of SNAP benefits, and the least access to computers and high-speed internet (see Figure 2).

FIGURE 2. Two-Thirds of U.S. Students Score Below Proficient Level in Reading and Mathematics

Reading and Math Proficiency of Children by Race and Ethnicity, 2019


Notes: All racial groups are non-Hispanic. NHOPI is Native Hawaiian and Other Pacific Islander.
Source: PRB analysis of data from the the U.S. Department of Education’s 2019 National Assessment of Education Progress (NAEP) database.

Among Black and American Indian/Alaska Native students, at least 80% of fourth graders scored below the proficient level in reading, and 85% or more of eighth graders scored below the proficient level in math. More than three-quarters of Latinx fourth graders scored below the proficient level in reading and math in 2019. With higher levels of economic well-being and access to computers and high-speed internet, the shares of non-Hispanic white and Asian/Native Hawaiian and Other Pacific Islander children scoring below the proficient level in reading and math are much lower. These gaps in basic reading and math skills make it hard to envision how today’s children can become tomorrow’s productive workers in a globally competitive economy. In outlining his education policy in 2009, President Barack Obama argued that “The relative decline of American education is untenable for our economy, it’s unsustainable for our democracy, and it’s unacceptable for our children—and we cannot afford to let it continue.”6

States also vary widely in reading and math proficiency levels. For example, the share of fourth graders who scored below the proficient level in reading ranged from a low of 55% in Massachusetts to a high of 76% in New Mexico, while at least seven out of 10 children scored below proficient in reading in eight states. The share of eighth graders who scored below proficient in math ranged from a low of 53% in Massachusetts to a high of 79% in New Mexico, while at least seven out of 10 eighth graders scored below the proficient level in math in 17 states in 2019.

The low levels of proficiency in reading and math among children of color are even more concerning given the fact that minorities make up a growing share of the school-age population. The share of school-age children who are members of a racial or ethnic minority ranges from a low of 7% in Vermont to a high of 80% in the District of Columbia. Among minority students, only two states—Hawaii and Vermont—had fewer than seven out of 10 fourth graders who scored below the proficient level in reading. However, no states had fewer than seven out of 10 minority eighth graders who scored below proficient in math. For example, nearly half (48%) of school-age children in Louisiana belong to a racial or ethnic minority group, and 84% of minority fourth graders scored below proficient in reading while 88% of minority eighth graders scored below proficient in math. Taken together, roughly 40% of all fourth and eighth graders in Louisiana had already fallen behind academically even before the COVID-19 pandemic hit and schools closed.

As schools shut down in spring 2020, some districts like Los Angeles Unified tried to address the digital divide by distributing laptops to all students who needed them. In addition, some districts provided internet access to students without it by distributing hot spots or data plans. However, these solutions were not economically feasible in many districts serving low-income communities of color such as Prince George’s County Public Schools in Maryland. With 10 of the 15 largest school districts already deciding to begin the new school year online as of early August, reducing the digital divide and providing free and reduced-price meals for children who need them has become a daunting challenge across the country.

Unemployment rates remain at record highs, and with the supplemental $600 unemployment payments ending and Congress unable to agree on a new stimulus package, poverty levels and demand for SNAP benefits are both likely to rise this fall. A growing economic divide may further exacerbate the digital divide among school-age children, putting even more students at risk of falling further behind.


References

  1. Includes children who lack either a computer or high-speed internet access, or both.
  2. Minority children include those who are not non-Hispanic white or non-Hispanic Asian/Native Hawaiian and Other Pacific Islander.
  3. Annie E. Casey Foundation, Early Warning! Why Reading by the End of Third Grade Matters (Baltimore, MD: Annie E. Casey Foundation, 2010).
  4. Annie E. Casey Foundation, Early Warning Confirmed: A Research Update on Third-Grade Reading (Baltimore, MD: Annie E. Casey Foundation, 2013).
  5. Annie E. Casey Foundation, Race for Results: Building a path to opportunity for all children, KIDS COUNT Policy Report (Baltimore, MD: Annie E. Casey Foundation, 2014).
  6. https://obamawhitehouse.archives.gov/the-press-office/remarks-president-united-states-hispanic-chamber-commerce.
0520-coronavirus-stress

Coronavirus Stress and Fear Could Take a Toll on Our Health

Stress and fear during coronavirus social isolation can alter gene activity in ways that affect your immune system, but doing good deeds can bolster health.

Heightened fears and the stress of social distancing and isolation may negatively impact the health of millions of Americans who are already feeling burdened by the effects of the novel coronavirus pandemic.

And some health experts believe that such impacts might even leave certain people more susceptible to infection by the coronavirus.

Research in the emerging field of social genomics has found that chronic social isolation and loneliness can alter gene activity in ways that inhibit an individual’s antiviral response while increasing their risk of diseases such as arteriosclerosis, cancer, and dementia over the long term.1But there’s no data yet on the effects of short-term isolation related to social distancing and stay-at-home orders.

“A lot depends on the timing and the psychology,” says Steve Cole, professor of medicine and biobehavioral sciences at the University of California, Los Angeles (UCLA).

His research, supported by the National Institute on Aging (NIA), examines how psychological experiences—including prolonged social isolation, a lifetime of poverty, and constant fear for one’s safety—can influence our immune systems and, in turn, our health.

Cole has examined the immune-response genes of socially isolated and chronically lonely people, exploring why they got sick and died faster when they contracted HIV, the virus that causes AIDS. He and his colleagues found that the fight-or-flight stress response is highly activated among chronically lonely people, triggering the expression of genes involved in inflammation while suppressing the activity of genes governing the virus-fighting Type I interferon system.2 This inflammatory response to loneliness may have evolved in early humans, enabling those separated from their tribe or social group to heal from injuries sustained without group protection, he explains.

But the fight-or-flight stress response is “a double-edge sword,” says Cole, noting that while it can help steer our immune system “toward inflammatory responses that kill bacteria,” inflammation also “fuels the growth of some other slow-brewing illnesses such as cardiovascular diseases, neurodegenerative diseases, and many types of cancer.”

Stress and Fear Can Dampen Antiviral Responses

Sustained fear and insecurity also trigger that fight-or-flight stress response, according to Cole. “The body doesn’t care what we’re afraid of—fear of the virus or fear of rejection by others, as is common in lonely people. Either type of fear will still stimulate our inflammation system, suppress our interferon system, and mess with a wide range of other physiologic systems we need to keep us healthy.”

While it is too early for studies related to the current pandemic, Cole offers what we do know about other types of coronaviruses. “Fight-or-flight stress physiology strongly suppresses the Type I interferon system, which is the body’s first line of defense against viral infections of all types. Coronaviruses are highly vulnerable to our Type I interferon responses, and it stands to reason that any stress-induced suppression of that system would leave us more vulnerable to this type of virus.”

It would be particularly tragic, he notes, if the stress of social distancing makes us more vulnerable to infection if we are exposed, even as it reduces our likelihood of exposure in the first place.

Short-Term Loneliness Is Unlikely to Make a Lasting Difference to Health

The good news is that a few weeks or months of being home alone is unlikely to noticeably affect a person’s health over the long term. The inflammation that hardens arteries and contributes to a heart attack takes many decades to build up, for example.

“The loneliness people feel after a move to a new town or the end of a romantic relationship is generally transient,” Cole says. “Any short-term change in our physiology would probably not significantly impact the long-term development of chronic illnesses like heart disease or cancer.”

Loneliness makes us focus on ourselves but redirecting that focus outward… can change our outlook, our brains, and our body chemistry.

Steve Cole, Professor of medicine and biobehavioral sciences at the University of California, Los Angeles

Doing Good For Others Can Help Us Stay Healthy

Cole and his colleagues have identified a surprising way to dampen stress-related inflammation and bolster the body’s virus-fighting capacity in chronically lonely people—altruism and purpose.3

“Loneliness makes us focus on ourselves,” he explains. “But redirecting that focus outward, toward helping others or some other self-transcendent purpose, can change our outlook, our brains, and our body chemistry.”

Older volunteers mentoring elementary school students experienced such immune system benefits. That’s according to a study led by Teresa Seeman, UCLA epidemiology professor and co-director of the UCLA and University of Southern California Center on Biodemography and Population Health.4 Those who reported the greatest increases in their sense of life purpose and meaning during the study also showed the greatest reduction in inflammation and increase in antiviral response.

During the current pandemic, focusing attention on how our own social distancing is protecting the common good and checking in on others by telephone or video conference could “very likely” counter some of the negative effects of stress and fear, says Cole.

And mounting evidence suggests that a variety of strategies—including mindfulness practices, yoga, tai chi, cognitive-behavioral stress management techniques (such as anxiety reduction, thought substitution, and coping skills), and certain drugs—can also alter the fight-or-flight signaling that increases inflammation and dampens antiviral responses, according to Cole.5

Prolonged Economic Insecurity, Poverty, and Grief Can Affect Health

What concerns Cole most right now is the potential for deepening poverty and widespread economic insecurity—particularly if unemployment persists and an economic recession takes hold. The long-term stress of living in poverty “gets under the skin,” “weathers” people, and sets them up for a host of chronic diseases at older ages, he and his colleagues find based on nationally representative Health and Retirement Study data.6

Bereavement—such as the unexpected loss of a loved one due to COVID-19, the disease caused by the novel coronavirus—is also known to worsen heart problems and raise mortality risks.7

Research on the health effects of the 2008 recession may provide clues on what to expect during the economic downturn that many are predicting in the wake of the current pandemic.  Seeman and colleagues documented a higher-than-expected rise in risk factors for heart disease and diabetes among Americans ages 45 and older following the global financial decline.8

The negative changes were most pronounced among those most likely to be affected by the economic downturn, including working-age adults and homeowners ages 65 and older “whose declining home wealth may have reduced their financial security, with less scope for recouping losses during their lifetime.” Least affected were older adults without a college degree; their reliance on Medicare and Social Security may have protected them, the researchers suggest.

Consider Spending More Time on Creative Activities

Older Americans may feel the effects of stay-at-home orders more acutely than other groups; 42% of those ages 65 and older lived alone in 2018, the largest share of any other U.S. age group.9

Those isolating themselves at home may be better off limiting television viewing and spending more time on mentally stimulating activities such as reading, carpentry, gardening, and crafting. That’s the advice of a University of Michigan researcher who studies older adults and the connections among their health, satisfaction with life, loneliness, and time use with NIA funding.10

“Spending the whole day alone listening to a constant stream of bad news is clearly not good for anyone,” says Jacqui Smith, a professor affiliated with the Michigan Center for the Demography of Aging and Institute of Social Research.

Television is passive, Smith points out. Activities that involve more social, mental, and physical engagement contribute the most to the positive side of adults’ daily emotional balance sheets, her work shows.11

This line of research, known to academics as subjective well-being, looks beyond traditional measures of physical and cognitive health to examine how older people evaluate and experience their daily lives. Researchers are finding that people who report that their lives are full of meaning and purpose tend be physically healthier and live longer than people who do not, as are those who report their day-to-day experience as largely positive and satisfying.12

For older adults confined at home by social distancing, Smith’s research underscores the positive health effects of phone conversations with friends and family, and exercise such as walks or stretching at home—activities that could benefit us all during the coronavirus pandemic, at any age.

Stay informed, Smith says, but spend more time on activities that “absorb your attention so fully that you lose track of time,” such as crafts, baking, or reading.

References

1Morgan Levine et al., “Contemporaneous Social Environment and the Architecture of Late-Life Gene Expression Profiles,” American Journal of Epidemiology 186, no. 5 (2017): 503-9; and Steven W. Cole, “Social Regulation of Human Gene Expression: Mechanisms and Implications for Public Health,” American Journal of Public Health 103, Supplement 1 (2013): S84-92.

2Steven W. Cole et al., “Accelerated Course of Human Immunodeficiency Virus Infection in Gay Men Who Conceal Their Homosexual Identity,” Psychosomatic Medicine 58, no. 3 (1996): 219-31; and Steven W. Cole, “Social Regulation of Human Gene Expression: Mechanisms and Implications for Public Health.” Type 1 interferons are a group of proteins that protect cells from infection by interfering with viral replication.

3Steven W. Cole, et al. “Loneliness, Eudaimonia, and the Human Conserved Transcriptional Response to Adversity,” Psychoneuroendocrinology 62, no. 1 (2015): 11-7.

4Teresa Seeman et al., “Intergenerational Mentoring, Eudaimonic Well-Being and Gene Regulation in Older Adults: A Pilot Study,” Psychoneuroendocrinology 111, no. 1 (2020): 104468.

5Jennifer M. Knight et al., “Propranolol Inhibits Molecular Risk Markers in HCT Recipients: A Phase 2 Randomized Controlled Biomarker Trial,” Blood Advances 4, no. 3 (2020): 467-76; Michael R. Irwin et al., “Cognitive Behavioral Therapy and Tai Chi Reverse Cellular and Genomic Markers of Inflammation in Late-Life Insomnia: A Randomized Controlled Trial,” Biological Psychiatry 78, no. 10 (2015): 721-9; J. David Creswell et al., “Mindfulness-Based Stress Reduction Training Reduces Loneliness and Pro-Inflammatory Gene Expression in Older Adults: A Small Randomized Controlled Trial,” Brain, Behavior, and Immunity 26, no. 7 (2012): 1095-101; Julienne E. Bower et al., “Yoga Reduces Inflammatory Signaling in Fatigued Breast Cancer Survivors: A Randomized Controlled Trial,” Psychoneuroendocrinology 43, no. 1 (2014): 20-9; and Julienne E. Bower et al., “Mindfulness Meditation for Younger Breast Cancer Survivors: A Randomized Controlled Trial,” Cancer 121, no. 8 (2015): 1231-40.

6Morgan Levine et al., “Contemporaneous Social Environment and the Architecture of Late-Life Gene Expression Profiles,” American Journal of Epidemiology 186, no. 5 (2017): 503-9.

7See multiple citations in Ashton M. Verdery and Emily Smith-Greenway, “COVID-19 and Family Bereavement in the United States,” Applied Demography, Special Issue on Covid-19, Committee on Applied Demography, Population Association of America, March 2020, pp. 1-2, www.populationassociation.org/wp-content/uploads/CAD_SpecialEdition_COVID19_March2020.pdf.

18Teresa Seeman et al., “The Great Recession Worsened Blood Pressure and Blood Glucose Levels in American Adults,” Proceedings of the National Academy of Sciences 115, no. 13 (2018): 3296-301.

9U.S. Census Bureau, 2018 American Community Survey.

10Jacqui Smith et al., “Snapshots of Mixtures of Affective Experiences in a Day: Findings From the Health and Retirement Study,” Population Ageing 7, no. 1 (2014): 55-79; and Tara L. Queen et al., “Loneliness in a Day: Activity Engagement, Time Alone, and Experienced Emotions,” Psychology and Aging 29, no. 2 (2014): 297-305.

11Smith et al., “Snapshots of Mixtures of Affective Experiences in a Day.”

12Yoichi Chida and Andrew Steptoe, “Positive Psychological Well-Being and Mortality: A Quantitative Review of Prospective Observational Studies,” Psychosomatic Medicine 70, no. 7 (2008): 741-56; and Angus Deaton and Arthur Stone, “Evaluative and Hedonic Wellbeing Among Those With and Without Children at Home,” Proceedings of the National Academy of Sciences 111, no. 4 (2014): 1328-33.

new_0320f-undercount-children-c

Why Are So Many Young Children Undercounted in the U.S. Census?

Children under the age of 5 face the highest risk of being undercounted in the U.S. decennial census. In the 2010 Census, there was a net undercount of almost 1 million young children. PRB estimates that at least 4 million children live in areas with a very high risk of undercounting young children in the 2020 Census.

As households prepare to fill out their census forms, this primer explains why young children are missed and why it matters.

Why are so many young children missed in the U.S. census?

Children under the age of 5 are undercounted for several reasons, which can vary across different neighborhoods. Some adults may not realize that babies, toddlers, and young children are supposed to be included in the census and leave them off the census form. Children’s living arrangements also play an important role in child undercount. Young children who live in female-headed households or grandparent-headed households are at higher risk of being missed, as are those who live in blended families or multigenerational households. Also, children who split their time between multiple households—like those in joint custody arrangements—are at greater risk of being missed. PRB analysis suggests that two measures currently being used to identify areas where young children are more likely to be missed—the 2010 Census mail return rate and the Low Response Score (also based on mail return rates)—are not very good predictors of net undercount rates for young children in large counties. A 2020 PRB paper shows that young children are more likely to be missed in neighborhoods with high shares of:

  • Children under age 5 living in poverty.
  • Adults ages 18 to 34 without a high school diploma or GED.
  • Children living in female-headed households with no spouse present.
  • Children under age 6 living with grandparent householders.
  • Households that are limited-English speaking.
  • Children living in immigrant families.
  • People living in renter-occupied housing units.

How long has the undercount of young children been an issue?

The undercount of young children is not a new issue. Demographers have found evidence of undercounts as far back as the 1880 Census. However, since 1980, the net undercount rate for young children in the U.S. decennial census has been increasing while the rate for adults has been falling. If unchecked, the undercount rate of young children may continue to climb.

What is the potential impact of undercounting young children?

Census data are used to allocate federal funding for programs such as Head Start and the Supplemental Nutrition Assistance Program (SNAP) and guide policy planning by states and local jurisdictions. When young children are missed, communities do not get their fair share of federal resources, and local policymakers do not have accurate information to develop long-term plans for schools and other services.

What can be done to address the undercount of young children?

Community organizations and others need new tools to better pinpoint neighborhoods that require special outreach and attention during the decennial census. The Count All Kids initiative has resources that advocates can use for outreach, including links to a PRB database and an interactive map (developed by the CUNY Mapping Service at the City University of New York’s Graduate Center) that show the risk of undercounting young children across census tracts in nearly 700 large U.S. counties.

New_0220f-household-synthesis

Understanding Local Variation in How Female Genital Mutilation/Cutting Declines, Changes, or Persists

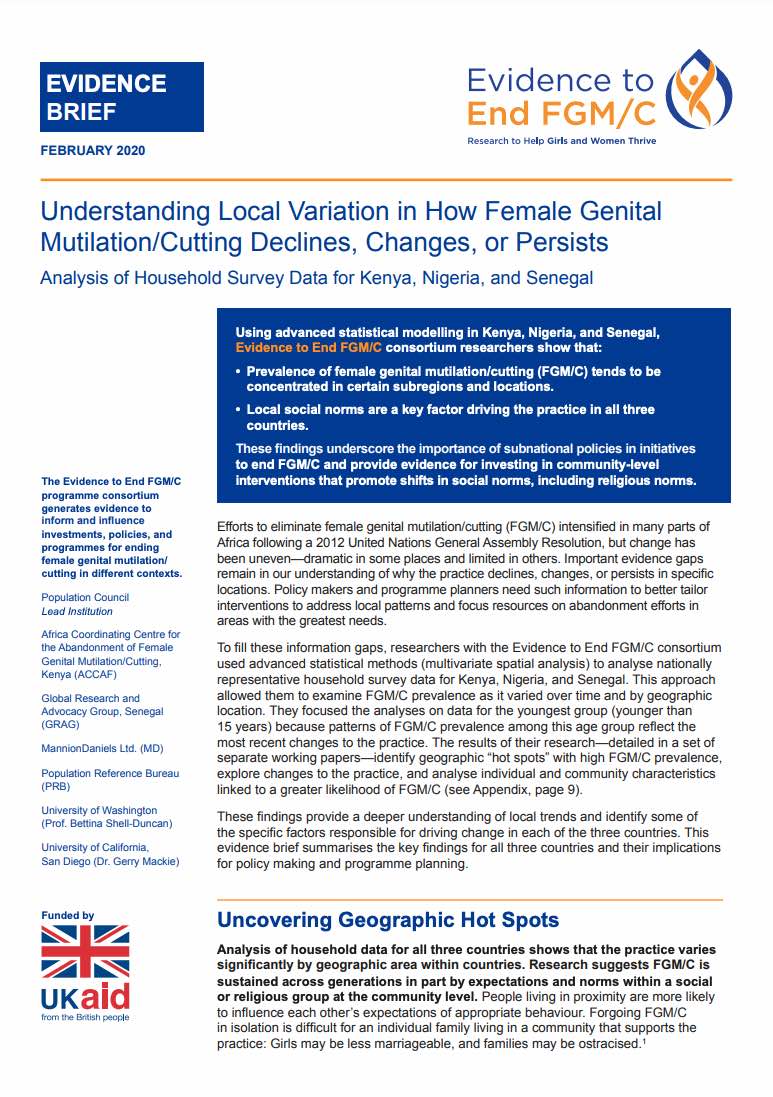
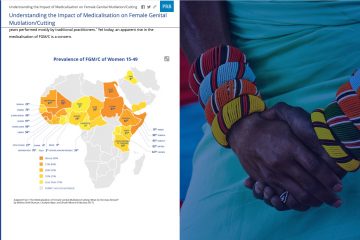
Population Reference Bureau (PRB) is a core partner on the Population Council’s Evidence to End FGM/C: Research to Help Girls and Women Thrive—a UKAID-funded research consortium to help end female genital mutilation/cutting (FGM/C) within one generation. Our role is to build the consortium’s capacity for research utilization and develop innovative tools and products to improve how researchers communicate their findings about FGM/C to key decision makers.

A new PRB-prepared Evidence Brief, “Understanding Local Variation in How Female Genital Mutilation/Cutting Declines, Changes, or Persists: Analysis of Household Survey Data for Kenya, Nigeria, and Senegal,” summarizes the research consortium’s recent findings related to geographic differences in FGM/C trends among girls under age 15.

The researchers used advanced statistical modeling to show that FGM/C prevalence among girls tends to be concentrated in certain subregions and locations in Kenya, Nigeria, and Senegal—with local social norms driving the practice. Their findings underscore the importance of subnational policies in initiatives to end FGM/C and provide evidence for investing in community-level interventions that promote shifts in social norms, including religious norms.

Single mother playing with young sons in front of house

U.S. Homeownership Rates Fall Among Young Adults, African Americans

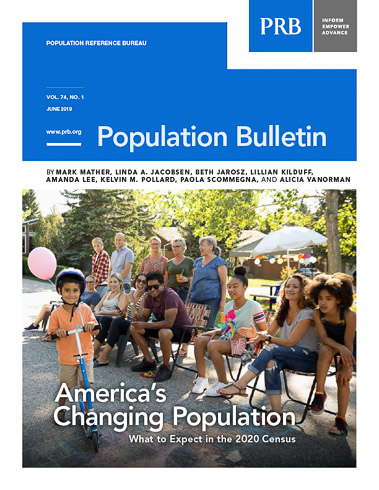
The benefits of owning a home in the United States are well documented. Homes can create wealth for their owners that in turn can benefit families for generations. Homeownership can also reduce economic risk by protecting families from rising rent prices. Owning a home has also been associated with better psychological health and greater stability for homeowners’ children.1 Decennial census data can be used to monitor trends in homeownership and differences across geographic areas. The 2017 American Community Survey data provide a preview of patterns in the 2020 decennial housing data.

At the beginning of the 20th century, the homeownership rate, or the share of owner-occupied households, was 47 percent. That rate dropped to 44 percent in 1940 following the Great Depression, and then increased sharply between 1940 and 1950, from 44 percent to 55 percent. The post-World War II housing boom was fueled by low-interest loans for newly constructed homes, a provision of the G.I. Bill.2 The homeownership rate reached a peak in 2000 at 66 percent. Since the subprime mortgage crisis of 2007-2010, the rate has slowly declined, dropping to 64 percent by 2017.

Most age groups experienced a decline in homeownership rates after the subprime mortgage crisis, which ended in 2010. Between 2010 and 2017, only adults ages 65 and older experienced an increase (1 percentage point), while the rates dropped for adults ages 20 to 34 and 35 to 64 (3 percentage points each) (see Figure 1). Historically, young adult householders (ages 20 to 34) have had lower homeownership rates compared with older householders (ages 65 and older), and the gap between these two groups has increased over time—from a 25 percentage-point difference in 1960 to a 44 percentage-point gap in 2017. For adults ages 35 to 64, the homeownership rate has returned to the same level it was nearly six decades ago (67 percent).

FIGURE 1. Homeownership Rates Have Dropped Sharply Among Households Headed by Young Adults

U.S. Homeownership Rate (%) by Age of Householder, 1960 to 2017

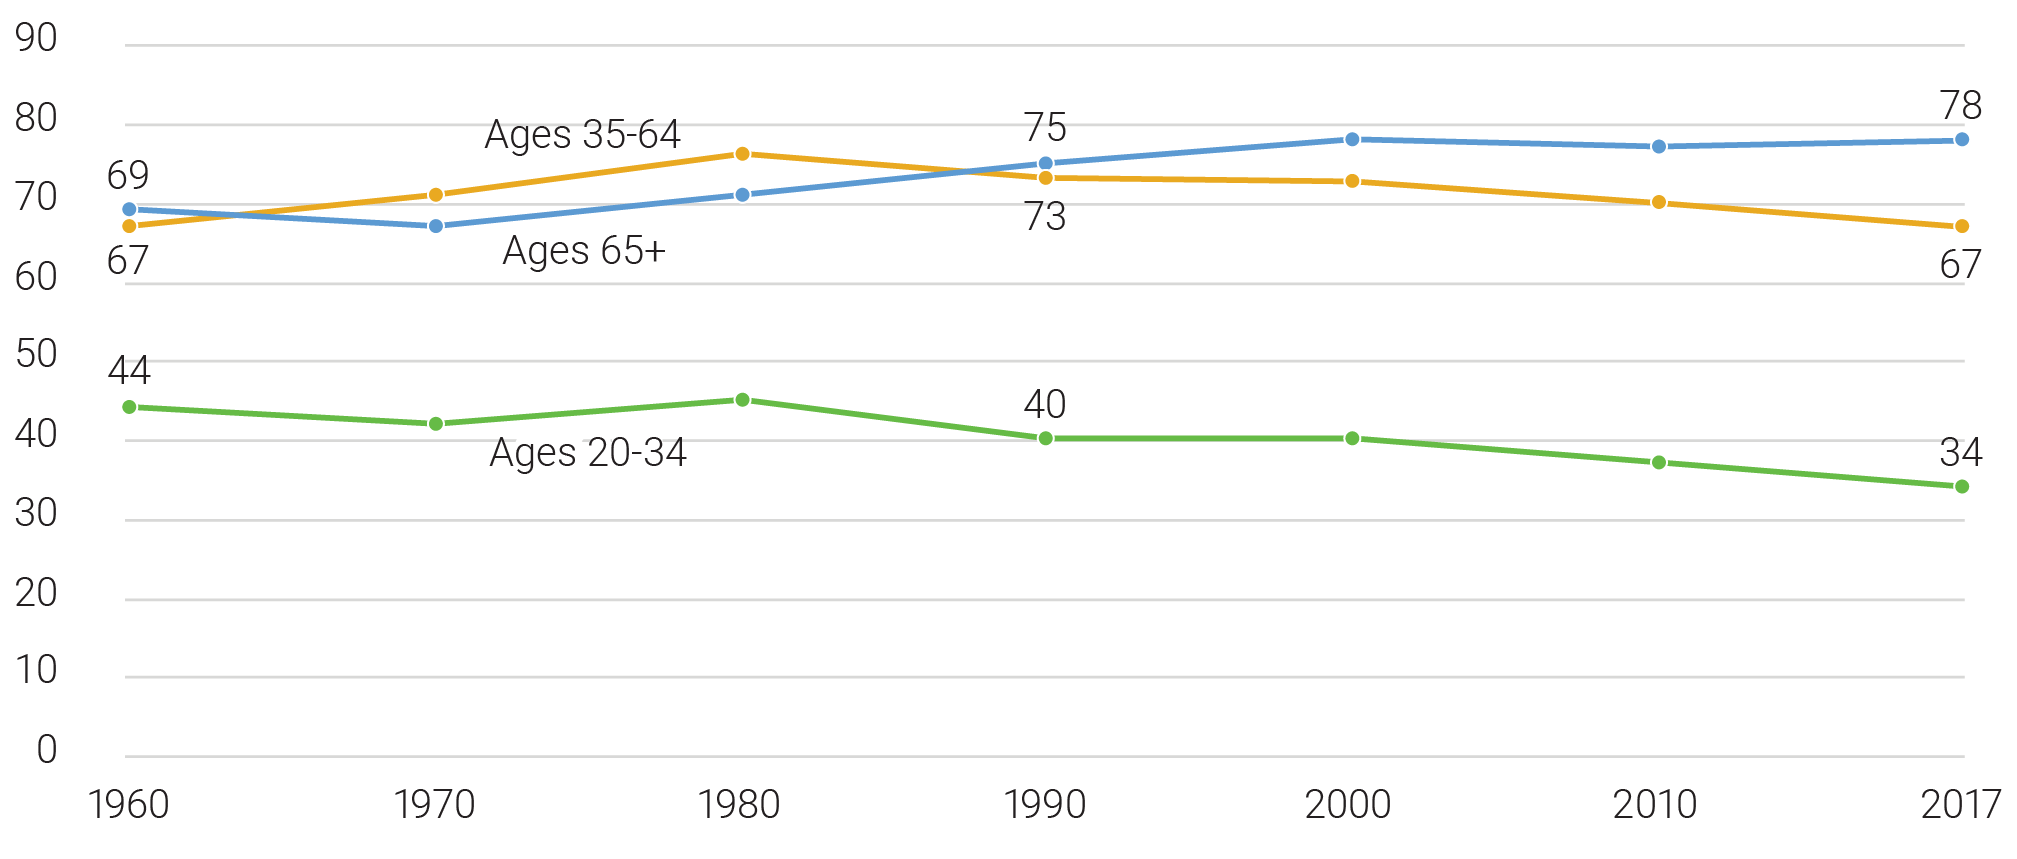
Source: Integrated Public Use Microdata Series (IPUMS), U.S. Census and American Community Survey: Version 8.0.


Between 1960 and 2017, the young adult homeownership rate dropped 10 percentage points, representing a shift from owning to renting. Although this trend suggests a change in housing preferences, more than two-thirds (67 percent) of renters report that they would buy a home if they had the financial resources to do so.The decline has also been linked to lower rates of marriage and household formation among young adults.4 The share of young adults ages 18 to 34 living with a spouse dropped from 26 percent in 2010 to 23 percent in 2017.

Homeownership rates also differ between urban and rural areas. In 2017, rural areas had a homeownership rate of 81 percent, compared with 60 percent in urban areas.5 This rural-urban gap is consistent across the country’s four regions but is widest in the Northeast, where the homeownership rate in rural areas (84 percent) was 26 percentage points higher than the rate in urban areas (58 percent).6 After each decennial census, the Census Bureau redefines urban and rural areas based on criteria related to population thresholds, density, distance and land use.7

The White-Black Gap in Homeownership Is Large and Growing

Leading up to the late 1960s, various race-based housing practices, such as redlining (denying loans to people in certain neighborhoods) and mortgage discrimination, led to extremely high levels of black residential segregation and housing inequality.8 As part of the civil rights movement and following the death of Martin Luther King, Jr., Congress passed the Fair Housing Act of 1968. The act made it illegal to refuse to sell or rent to any person based on race, religion, national origin, or sex. Policymakers use data from the decennial census to enforce the act by examining rental and homeownership trends.

Despite these efforts, gaps in homeownership persist across different racial and ethnic groups. Historically, white householders have had the highest homeownership rates—a pattern that continues today9 (see Figure 2). In 2017, the white homeownership rate was 72 percent, compared with a national rate of 64 percent.

FIGURE 2. The Homeownership Gap Between Whites and Other Racial/Ethnic Groups Persists

U.S. Homeownership Rate (%) by Race/Ethnicity of Householder, 2000 to 2017

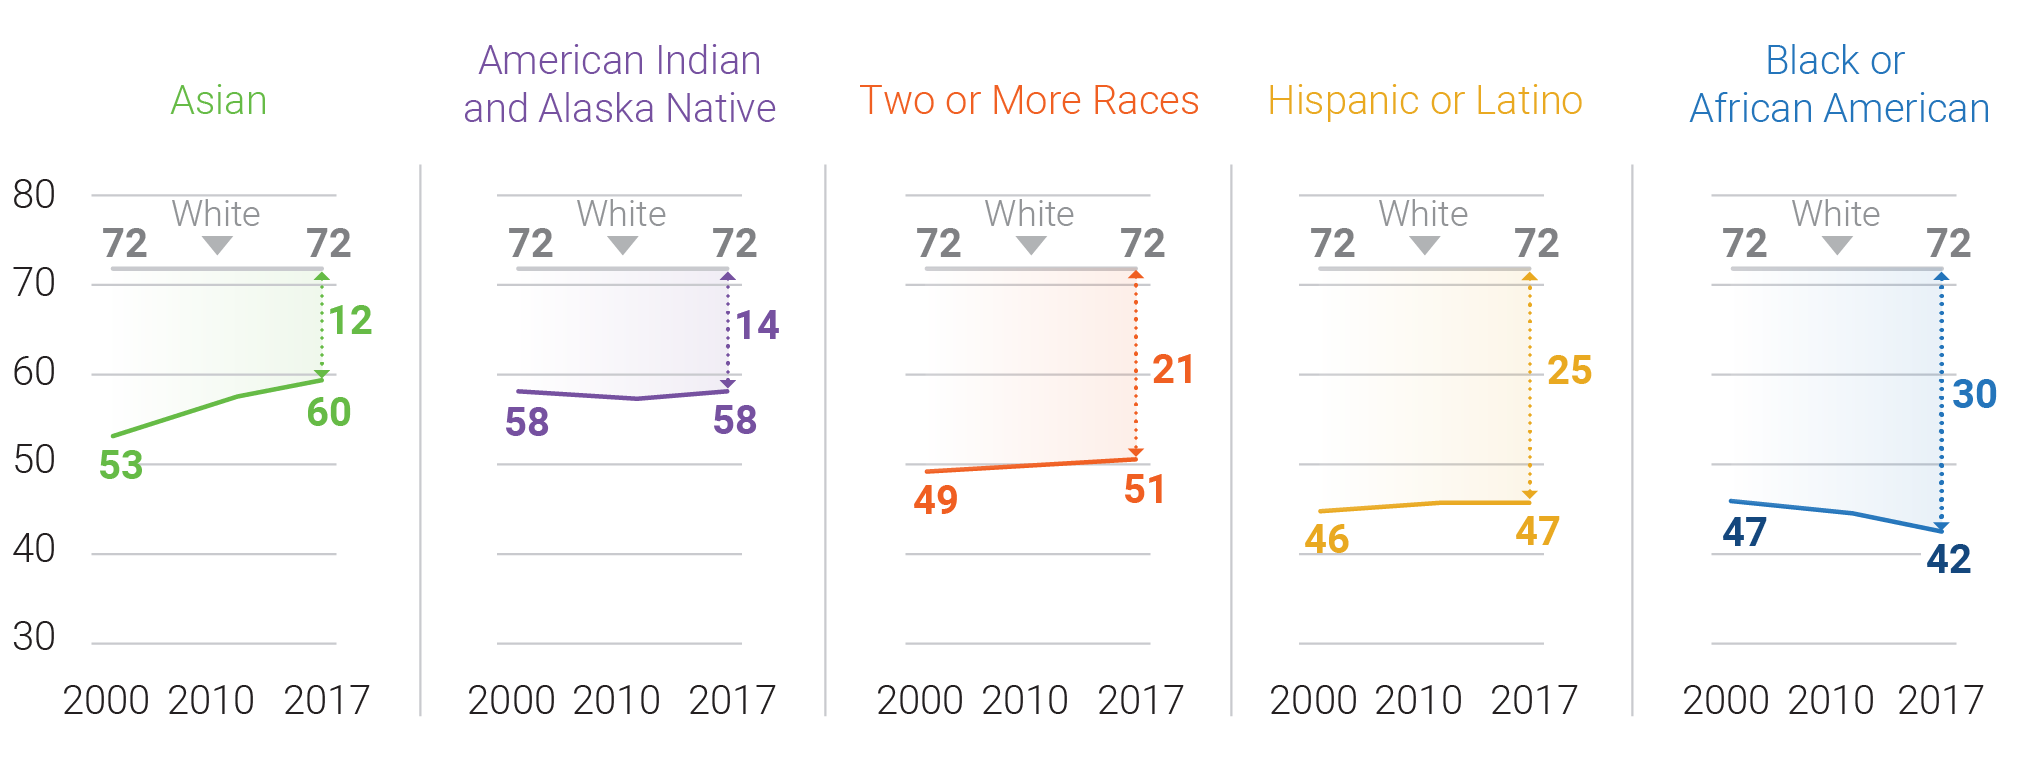
Notes: “Other living arrangements” include householders living alone, with an unmarried partner, with other relatives, or with nonrelatives. Percentages may not sum to 100 due to rounding.
Source: U.S. Census Bureau, 2010 and 2017 American Community Survey PUMS.


Asian American and American Indian/Alaska Native householders had rates 12 and 14 percentage points lower than whites, respectively. The homeownership rate was lowest among black householders (42 percent—30 percentage points lower than the rate for whites). The size of the white-black gap in homeownership varies widely across geographic areas, with larger gaps in northeastern and midwestern cities and smaller gaps in cities in the South and West.10 Data from the 2020 Census will allow researchers to analyze homeownership rates at the region-, state-, county-, census tract-, and block group-level and ascertain whether the gaps between groups are shrinking or growing.

The overall homeownership rate dropped two percentage points between 2000 and 2017. This decline can be explained in part by changes in the racial and ethnic composition of householders. Whites have a high homeownership rate relative to other racial/ethnic groups, so as the white share of householders declined between 2000 and 2017, the homeownership rate also declined.

Recovery from the subprime mortgage crisis has been uneven. Both African American and American Indian/Alaska Native householders experienced declines in homeownership between 2000 and 2010. However, the American Indian/Alaska Native homeownership rate dropped just one percentage point between 2000 to 2010 and then rebounded by 2017, while the rate for African Americans continued to fall, declining 5 percentage points from 2000 to 2017. Predatory lenders targeted black and Latino communities prior to the mortgage crisis, resulting in high foreclosure rates when home values started to fall.11 Since 2010, homeownership rates for most racial/ethnic groups held steady or increased, but the rate for blacks continued to drop, especially among young adults. With higher incomes, white families are able to purchase homes an average of eight years earlier compared with black families, generating more equity and potential for growth in assets.12

The Asian American homeownership rate increased by nearly 7 percentage points between 2000 and 2017—more than any other group. The precise reasons behind this increase are unclear, but a high median income among Asian Americans, combined with a below-average homeownership rate, has positioned them for substantial gains in homeownership in the coming years.


This article is excerpted from Mark Mather et al., “What the 2020 Census Will Tell Us About a Changing America,” Population Bulletin 74, no. 1 (2019).

prb-hero

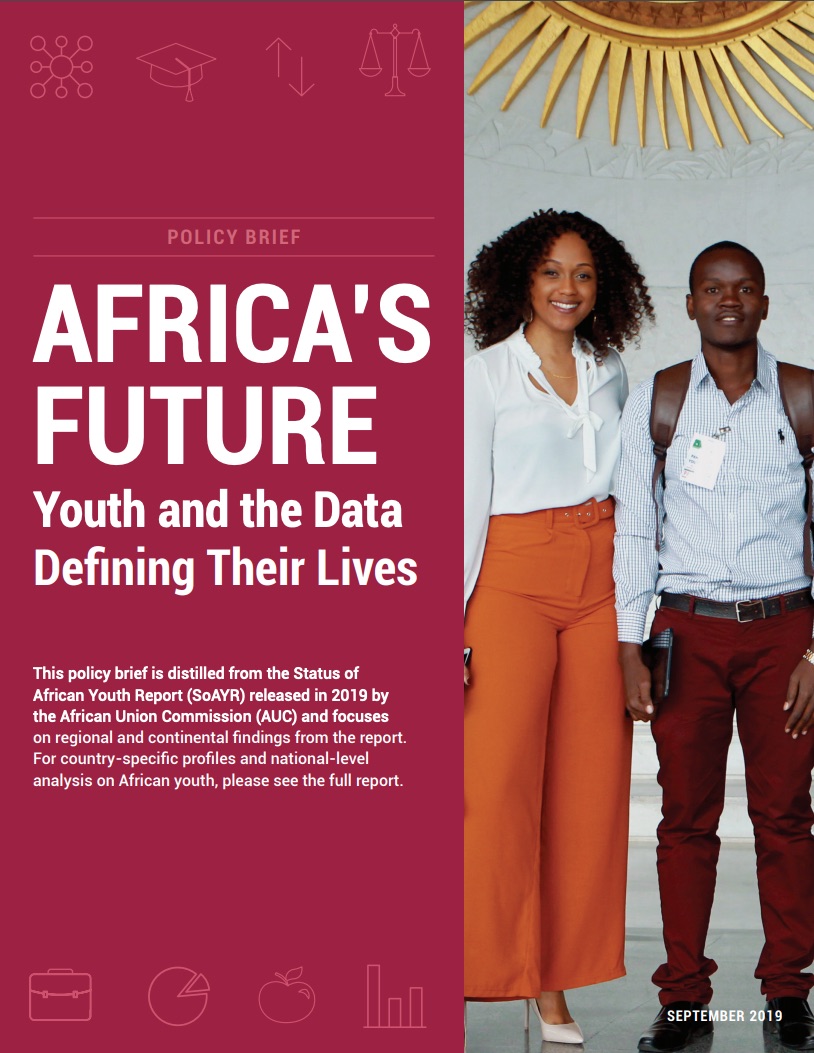
By 2030, young Africans are expected to make up 42 percent of the world’s youth and account for 75 percent of the those under age 35 in Africa. With such a large population of young people, supportive policies and programs on inclusive youth development are critical now more than ever. Harnessing the demographic dividend and expanding opportunities for young people—to the benefit of all Africans—will require sound data and evidence on the status of African youth.

Recognizing this need, the African Union Commission (AUC) has worked to build an evidence base of youth-specific data across a wide range of sectors to assist policymakers to make targeted investments and design effective interventions for young Africans. PRB has partnered with the AUC to create a policy brief focused on regional and continental findings on youth development in Africa to spark discussion among youth advocates and policymakers alike.

The policy brief examines inclusive youth development in Africa through the four pillars and enabling environment of the African Union Demographic Dividend (AUDD) Roadmap, which identifies key areas for increasing investments in youth, driving policy change, and setting member countries on a path towards a prosperous future. Using indicators selected and analyzed by teams of African youth researchers, the brief examines obstacles and opportunities facing African youth today. It calls for innovative, multisectoral approaches that holistically address youth experiences—across the employment, education, health, and governance sectors. The brief aims to make the case for evidence-based investments in young people and guide resource allocation across the continent.


prb-hero

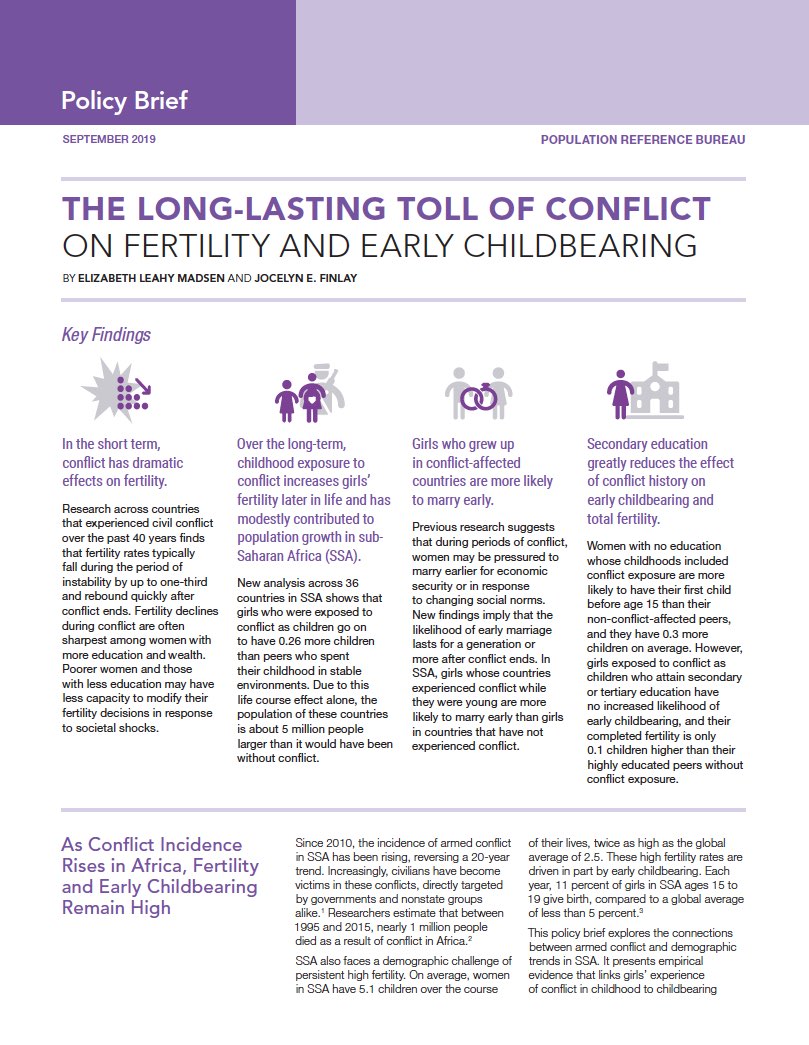
Over the past decade, the incidence of conflict has been rising in sub-Saharan Africa (SSA), reversing a 20-year trend. Conflict’s pernicious effects on society are wide-ranging, even after stability returns, and extend to demographic trends. A body of previous research has found that fertility rates typically fall during conflict and rebound afterwards—but these effects are much smaller among less-educated women and in high-poverty settings.

A new PRB policy brief builds upon this previous research, breaking new ground by examining long-term trends in fertility in SSA among girls who lived in conflict zones when they were very young. The findings show that early childhood exposure to conflict has long-lasting repercussions—and those repercussions vary based on women’s eventual education.

Across 36 countries in SSA, girls who were exposed to conflict as children go on to have more children than peers who spent their childhood in stable environments, and they are also more likely to marry and begin childbearing before age 18. However, conflict-affected girls who attain secondary education have no increased likelihood of early marriage or childbearing. Education may offer girls affected by conflict a mechanism to build their resiliency and overcome some of the economic and social shocks of childhood in a conflict zone.

Image of men and women gathered as a group

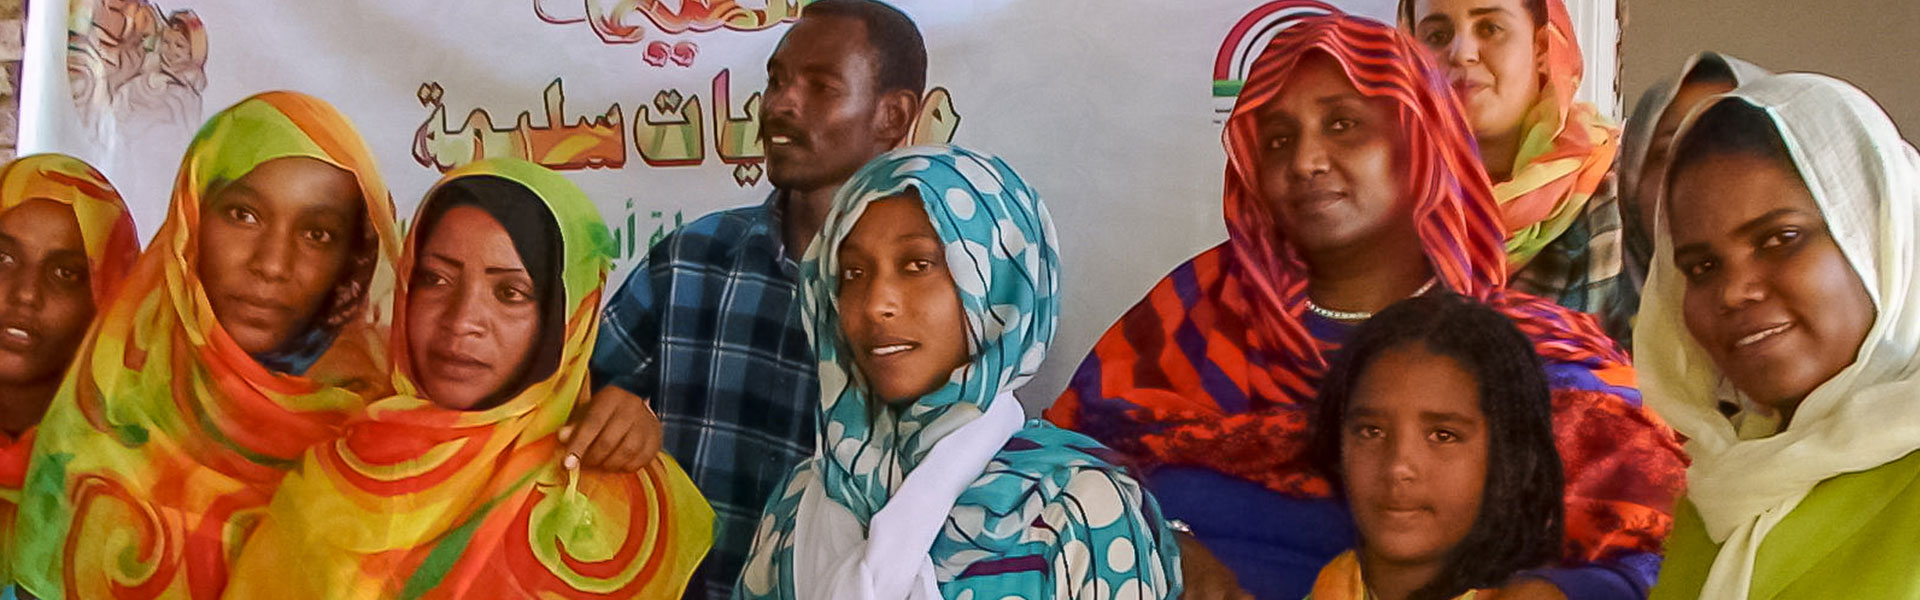
Population Reference Bureau (PRB) is a core partner on the Population Council-led Evidence to End FGM/C: Research to Help Girls and Women Thrive consortium—a UKAID-funded research program to help end female genital mutilation/cutting (FGM/C) within one generation. Our role is to build the consortium’s capacity for research utilization and to develop innovative tools and products to improve how researchers communicate their findings about FGM/C to key decisionmakers.

View English Video

View Arabic Video

PRB has created a short video that shares key lessons from two studies in Egypt and Sudan that looked at effective elements of various social marketing campaigns. The video highlights how the four P’s—product, price, place, and promotion—can be used to design a high-quality FGM/C campaign. It also offers additional insights for program managers and designers that can help ensure social marketing campaigns to end FGM/C are grounded in the right principles and approaches. The video is based on the following two reports:

  • A. Rahman, S. El Nagar, R. Gindeel, and A. Salah, “Understanding the Key Elements for Designing and Implementing Social Marketing Campaigns to Inform the Development of Creative Approaches for FGM/C Abandonment in Sudan,” Evidence to End FGM/C: Research to Help Women Thrive (New York: Population Council, forthcoming).
  • Abou Hussein and S. Ghattass, “’No to Circumcision’: The Road to Effective Social Marketing Campaigns in Egypt,” Evidence to End FGM/C: Research to Help Women Thrive (New York: Population Council, forthcoming).
Hispanic businesswoman using laptop in office

Older Women Live Longer, But With More Disability and Financial Challenges Than Men

Older women in the United States continue to live longer than men, on average, but they’re spending an increasing share of their later years living with a disability, research suggests.

“Women may be living longer but not healthier lives than men,” says Eileen Crimmins of the University of Southern California. Her team examined life expectancy and disability rates in the 40-year period from 1970 to 2010.1Their analysis of U.S. vital statistics shows that both men and women saw lifespan increases, but women are spending a larger share of the additional years with a disability than men.

Other researchers see similar patterns. “Just a few decades ago, older women used to spend more time in their later years functioning independently than men—without needing help taking care of themselves or managing basic household activities,” says Vicki Freedman of the University of Michigan. Her research team examined data on disability trends among U.S. Medicare enrollees from 1982, 2004, and 2011.2

Freedman and colleagues compared disability rates from two nationally representative studies—the National Health and Aging Trends Study and the National Long Term Care Survey. They found over the 30-year period that the time adults ages 65 and older can expect to live without physical or activity limitations (called active life expectancy) increased more than twice as much for men than for women.

“Women can no longer expect to live more active years than older men, despite living longer,” she notes. Women are more likely than men to develop a number of debilitating conditions such as arthritis, fall-related fractures, and dementia that could limit their ability to remain independent without assistance.

Women facing such health and long-term care needs in late life are at a further disadvantage to men, research also suggests, because on average they have fewer resources.3 Their economic resources are not only linked to work- and family-related decisions made over a lifetime, but also to choices about the timing of retirement.

Despite Disability, Older Adults May Try to Postpone Retirement Because of Debt

Population Reference Bureau’s publication, “Health and Working Past Traditional Retirement Ages,” notes that when workers were asked to assess their capacity to continue working at their current job, their health and disability shaped their perceptions and were linked to whether they retired within roughly 1.5 years.4

Between 1994 and 2012 nearly one in three older Americans ages 65 to 69 were either retired or unemployed but were healthy enough to work.5 A growing body of research, however, finds evidence that baby boomers nearing traditional retirement ages may have higher levels of disability than earlier generations, which could constrain their ability to remain on the job.6

Older adults must also factor personal finances into retirement decisions. In coming years, high levels of debt may contribute to more men and women postponing retirement despite their health and disability levels.

A team of researchers finds a “dramatic increase” in the amount of debt carried by older Americans nearing retirement ages (ages 62 to 66 in 2010). National Bureau of Economic Research (NBER) affiliates Annamaria Lusardi of The George Washington University, Olivia S. Mitchell of the University of Pennsylvania, and Noemi Oggero of the University of Turin attribute this age group’s financial distress mainly to “having purchased more expensive homes with smaller down payments” than previous generations.7

Using data from the nationally representative Health and Retirement Study (HRS) and the National Financial Capability Study, they analyzed the debt of Americans ages 56 to 61 in 1992, 2004, and 2010. Their analysis shows that the median debt-to-income ratio (the percentage of income that goes to debt payments) climbed from 14 percent in 1992 to 45 percent in 2004, and to 50 percent in 2010. The median amount of debt rose sharply between 1992 and 2004, from $6,800 to $31,200 in 2015 dollars.

Their analysis also shows that while older adults nearing traditional retirement ages in 2010 carried more debt than their counterparts in earlier years, they carried less debt than adults further from traditional retirement ages (ages 56 to 61) in 2010. “While people’s financial situation does seem to improve with age, the older group is still financially distressed,” they write.

Married Women Who Retire Earlier Take a Financial Hit

Even without high levels of debt, married women face challenging retirement decisions—with unclear tradeoffs.

American married women tend to be younger than their husbands but retire around the same time, contributing to a gender gap in lifetime Social Security benefits, finds Nicole Maestas of NBER and Harvard University.8

By retiring early, older married women often forego both substantial future earnings and additional Social Security benefits that they would have received if they had worked longer, her analysis shows. They also incur health insurance costs if they retire before age 65, when they become eligible for Medicare.

“Unless married couples have other assets—from savings, for example—women’s younger retirement age means they have less wealth to live on during their remaining life together, and during any subsequent divorce or widowhood,” she says.

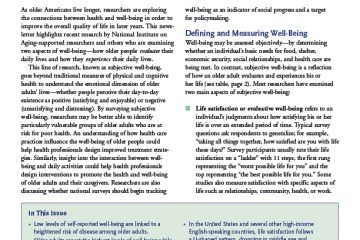
Older women face an important tradeoff between spending time with their retired husbands and continuing to work to increase their Social Security benefits and savings.

Nicole Maestas

Maestas finds that working extra years beyond midlife has a greater impact on the current value of older women’s lifetime Social Security benefits than it does for men for two reasons: Older women commonly have shorter careers than older men (often delaying or interrupting employment to care for children), and their earnings tend to peak in their late 50s—men tend to work continuously and their earnings peak earlier.

“If women chose to work longer, their earnings later in life would replace their lower earnings in earlier years in calculating their Social Security benefits,” she explains.

Social Security benefits at age 65 are based on an individual’s highest annual earnings over a 35-year period. Maestas calculates that married older men and women are on nearly equal footing in terms of the value of their Social Security benefits over their remaining lifetime if they both work until age 70. “But older women face an important tradeoff between spending time with their retired husbands and continuing to work to increase their Social Security benefits and savings,” she points out.

For the study, she used nationally representative HRS data and compared two groups over time—the “early cohort,” born from 1936 to 1947, and the “boomer cohort,” born from 1948 to 1959.

For both cohorts, women were more likely than men to retire “early”—before age 62—or move from full- to part-time employment. In the boomer cohort, 47 percent of women retired or transitioned to part-time work early, but only 41 percent of men did so.

Married Women Could Close the Gender Gap in Social Security by Working Longer

Baby boomer women spent more time in the labor force than their predecessors so are now poised to receive higher individual benefits. The average value of lifetime Social Security benefit for baby boomer women is about $145,000, 26 percent greater than for the early cohort. For baby boom men, the value is only about 7 percent higher than the earlier cohort.

Maestas’ calculations also show substantially higher lifetime benefits for women in both cohorts if they work until age 70. By contrast, men see no gains by working until age 70, illustrating the financial impact made by women’s interrupted careers. Maestas concludes that if women are physically and cognitively able to work through their 60s, they could virtually eliminate the gender gap in lifetime Social Security benefits.

And attitudes toward working longer may be shifting among women. Lusardi and Mitchell report that in recent generations women in their 50s and 60s are more likely than their peers from the early 1990s to say they plan to work to older ages.9 But the match—or mismatch—between their level of physical and cognitive functioning and the demands of their jobs will play a large role in determining whether they can continue to work as they have planned, according to Freedman.


A portion of a summary by Morgan Foy, National Bureau of Economic Research, was adapted for this piece and used with permission.


References

1 Eileen Crimmins, Yuan Zhang, and Yasuhiko Saito, “Trends Over Four Decades in Disability-Free Life Expectancy in the United States,” American Journal of Public Health 106, no. 7 (2016): 1287-93.

2 Vicki Freedman, Douglas A. Wolf, and Brenda C. Spillman, “Disability-Free Life Expectancy Over 30 Years: A Growing Female Disadvantage in the U.S. Population,” American Journal of Public Health 106, no. 6 (2016): 1079-85.

3 Robert Hauser and Erin Ruel, “Explaining the Gender Wealth Gap,” Demography 50, no. 4 (2013): 1155-76.

4 Alyssa McGonagle et al., “Individual and Work Factors Related to Perceived Work Ability and Labor Force Outcomes,” Journal of Applied Psychology 100, no. 2 (2015): 376-98.

5 Courtney Coile, Kevin S. Milligan, and David A. Wise, “Health Capacity to Work at Older Ages: Evidence From the United States,” in Social Security Programs and Retirement Around the World: The Capacity to Work at Older Ages, National Bureau of Economic Research Conference Report, ed., David Wise (Chicago: University of Chicago Press, 2017).

6 Hiram Beltrán-Sánchez, Marsha Jiménez, and S.V. Subramanian, “Assessing Morbidity Compression in Two Cohorts From the Health and Retirement Study,” Journal of Epidemiology and Community Health 70, no. 10 (2016): 1011-66; HwaJung Choi and Robert Schoeni, “Health of Americans Who Must Work Longer to Reach Social Security Retirement Age,” Health Affairs 36, no. 10 (2017): 1815-19; and HwaJung Choi, Robert Schoeni, and Linda G. Martin, “Are Functional and Activity Limitations Becoming More Prevalent Among 55- to 69-year-olds in the United States?” PLoS One 11, no. 10 (2016): e0164565.

7 Annamaria Lusardi, Olivia S. Mitchell, and Noemi Oggero, “Debt and Financial Vulnerability on the Verge of Retirement,” National Bureau of Economic Research Working Paper No. 23664 (Aug. 2017).

8 Nicole Maestas, “The Return to Work and Women’s Employment Decisions,” National Bureau of Economic Research Working Paper no. 24429 (March 2018).

9 Annamaria Lusardi and Olivia S. Mitchell, “Older Women’s Labor Market Attachment, Retirement Planning, and Household Debt,” National Bureau of Economic Research Working Paper No. 22606 (Sept. 2016).